



A payment API times out, a checkout throws a 500, and your dashboards stay green the whole time. That’s not a monitoring gap, it’s a structural one: backend alerting only sees aggregate metrics, not what a single user just experienced in their browser. Middleware OpsAI closes that gap by correlating APM traces with RUM sessions in real time, so a broken checkout maps directly to the backend span, the responsible microservice, and in many cases a pull request with the fix, before a support ticket ever gets filed.
Key takeaways
- Traditional APM alerting is backend-only. It misses API failures that degrade the user experience without crossing a backend error threshold.
- OpsAI correlates APM traces with RUM sessions using shared trace IDs, so a broken user session in the browser maps directly to the backend span that caused it.
- Trace correlation identifies which specific microservice in a chain is responsible for an API failure, not just that the API is slow or erroring.
- For application errors, OpsAI performs full root cause analysis across the trace, pulls relevant source code via GitHub MCP, and opens a pull request with a fix.
- OpsAI detects API failures at the trace level before error rates cross alert thresholds, giving a 5 to 15 minute intervention window before user impact escalates.
- Payment API 504 timeouts, checkout 500s, and authentication endpoint regressions are all handled: OpsAI identifies the failing service, diagnoses the root cause, and proposes a targeted remediation.
Why backend monitoring misses API errors users actually experience
Here is a failure mode that every engineering team has encountered: users start reporting a broken checkout, your backend dashboards show no errors, and by the time you find the problem your support queue has 40 tickets.
This happens because traditional APM monitoring is backend-centric. It watches for error rates crossing thresholds, latency exceeding p99 bounds, or services returning 5xx responses. What it does not watch is what the user is actually experiencing in their browser when your API is degraded but not technically broken, timeouts that resolve after a retry, partial response failures that cause silent UI errors, or latency spikes that cause the checkout button to appear frozen.
There are three structural gaps in backend-only API monitoring:
Gap 1: The retry mask
Most frontend clients implement retry logic. When an API call fails, the browser retries once or twice before surfacing an error to the user. From the backend’s perspective, only one request out of three failed, an error rate well below any alert threshold. From the user’s perspective, the checkout took 12 seconds and may or may not have completed. Backend monitoring never fired. User experience was significantly degraded.
Gap 2: The silent failure
Some API failures produce valid HTTP responses with malformed payloads: a 200 with an empty body, a JSON object missing required fields, a truncated response from a timeout mid-stream. The backend logs a successful response. The frontend renders a blank state or crashes silently in JavaScript. Backend monitoring shows green. Users see a broken page.
Gap 3: The cascade blind spot
In a microservices architecture, a user-facing API call typically touches 3 to 12 downstream services. When one of those internal services degrades, increasing latency by 300ms, the upstream API remains within its own error threshold but user-perceived response time has crossed the point of session abandonment. Backend monitoring of the edge service shows no problem. The slow internal service is not directly monitored in the context of user sessions.
Closing these gaps requires connecting what users experience in the browser to what is happening in the backend trace, in real time, automatically, without a human manually correlating two separate dashboards.
What is APM trace correlation and how does it fill above API error gaps
APM trace correlation is the technique of linking a distributed trace, the record of a request as it travels through backend services, to the user session that triggered it. The technical mechanism is a trace ID: a unique identifier generated when the user’s browser makes a request, propagated through every backend service the request touches, and recorded in both the frontend RUM session and the backend APM trace.
When trace IDs are propagated correctly, a single user action (tapping “Place Order”) can be followed from the browser click, through the API gateway, into the order service, down to the payment service database query, and back, all as a connected chain with timing data at every hop. This is distributed tracing as implemented through Middleware’s distributed tracing capability, built on OpenTelemetry standards.
The practical value of trace correlation for API error detection is significant:
- You can see exactly which service in a chain added latency to a user request
- You can determine whether a user-reported error originated in the frontend, the API gateway, an internal microservice, or a database query
- You can identify failures that are intermittent from a backend perspective but consistent from a specific user cohort’s perspective (for example, users on a specific browser version or geographic region)
- You can correlate the precise moment a user abandoned a session with the backend span that caused the timeout
The same trace ID also ties together logs and metrics, not just RUM and APM spans. This is what lets OpsAI cross-reference a slow span with the exact log lines and resource metrics, CPU, memory, connection pool counts, from that same request, instead of treating traces, logs, and metrics as three separate systems a human has to reconcile by hand.
Without trace correlation, frontend and backend monitoring are two separate instruments pointing at the same production system from different angles. With trace correlation, they become a single view of what is actually happening to users.
How OpsAI links a broken frontend session to a failing backend service
Middleware’s Real User Monitoring (RUM) captures frontend events, page loads, user interactions, API calls initiated from the browser, JavaScript errors, Core Web Vitals, and associates each outbound API call with a trace ID. That same trace ID is propagated through the backend APM instrumentation and recorded in every span the request generates.
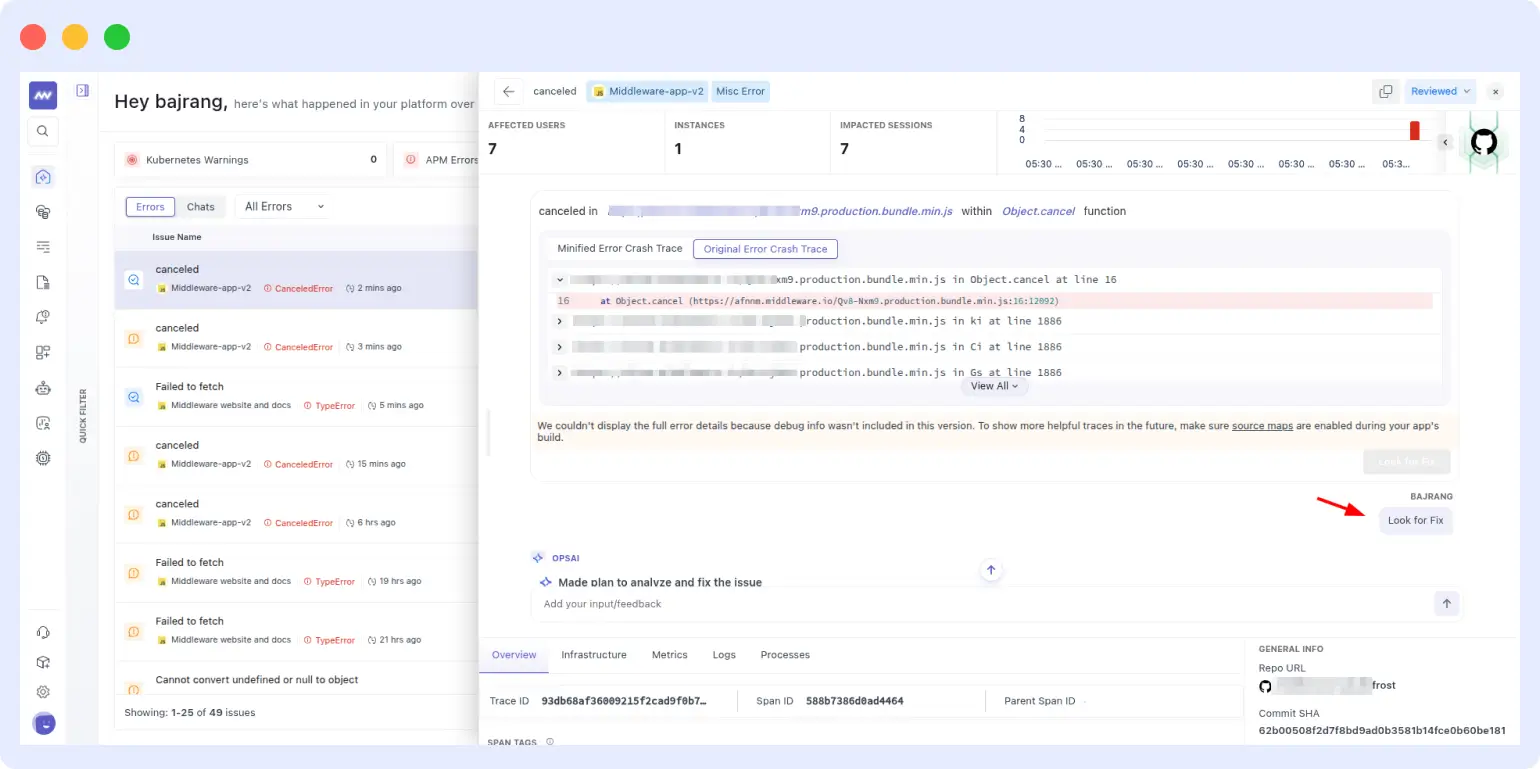
This is the direct answer to a common question of how RUM platforms connect frontend slowness to backend service issues: because the trace ID is shared, a slow page load or a stalled checkout button traces back to the exact backend service and operation responsible, not just a generic flag that “the frontend felt slow.”
When OpsAI detects an issue, it does not treat the RUM signal and the APM signal as separate events. It treats them as two ends of the same request chain. Here is how the correlation surfaces in practice:
Step 1: RUM detects user-facing degradation
A user’s browser session shows a failed API call to /api/checkout/confirm with a 504 timeout after 8 seconds. The RUM session captures: the user ID, the session ID, the full request context, the trace ID of the outbound call, and the JavaScript error that resulted. The user closed the tab without completing the purchase.
Step 2: OpsAI correlates the trace ID to the backend span chain
Using the trace ID from the RUM session, OpsAI retrieves the full distributed trace from the APM data: the request entered the API gateway at T+0ms, was routed to the checkout service at T+12ms, the checkout service called the payment service at T+45ms, and the payment service attempted a database query that timed out after 7,500ms. The 504 the user saw was caused by a PostgreSQL connection pool exhaustion in the payment service, not a checkout service issue, not an API gateway issue.
Step 3: Root cause is pinpointed at the service and code level
OpsAI identifies the specific service responsible (payment service), the specific operation that failed (database connection pool exhaustion), and, when a GitHub or Bitbucket repository is connected, the specific code path that is not handling connection pool saturation correctly. The root cause is not “the checkout API is slow.” It is “the payment service’s database connection pool is not releasing connections after transaction completion in the process_payment() function.”
Step 4: Fix is proposed or applied
OpsAI opens a pull request targeting the identified code path with a proposed fix, in this case, ensuring connection release in a finally block. The PR includes the full incident context: which RUM sessions were affected, how many users experienced the timeout, what the distributed trace shows, and why the specific code change addresses the root cause.
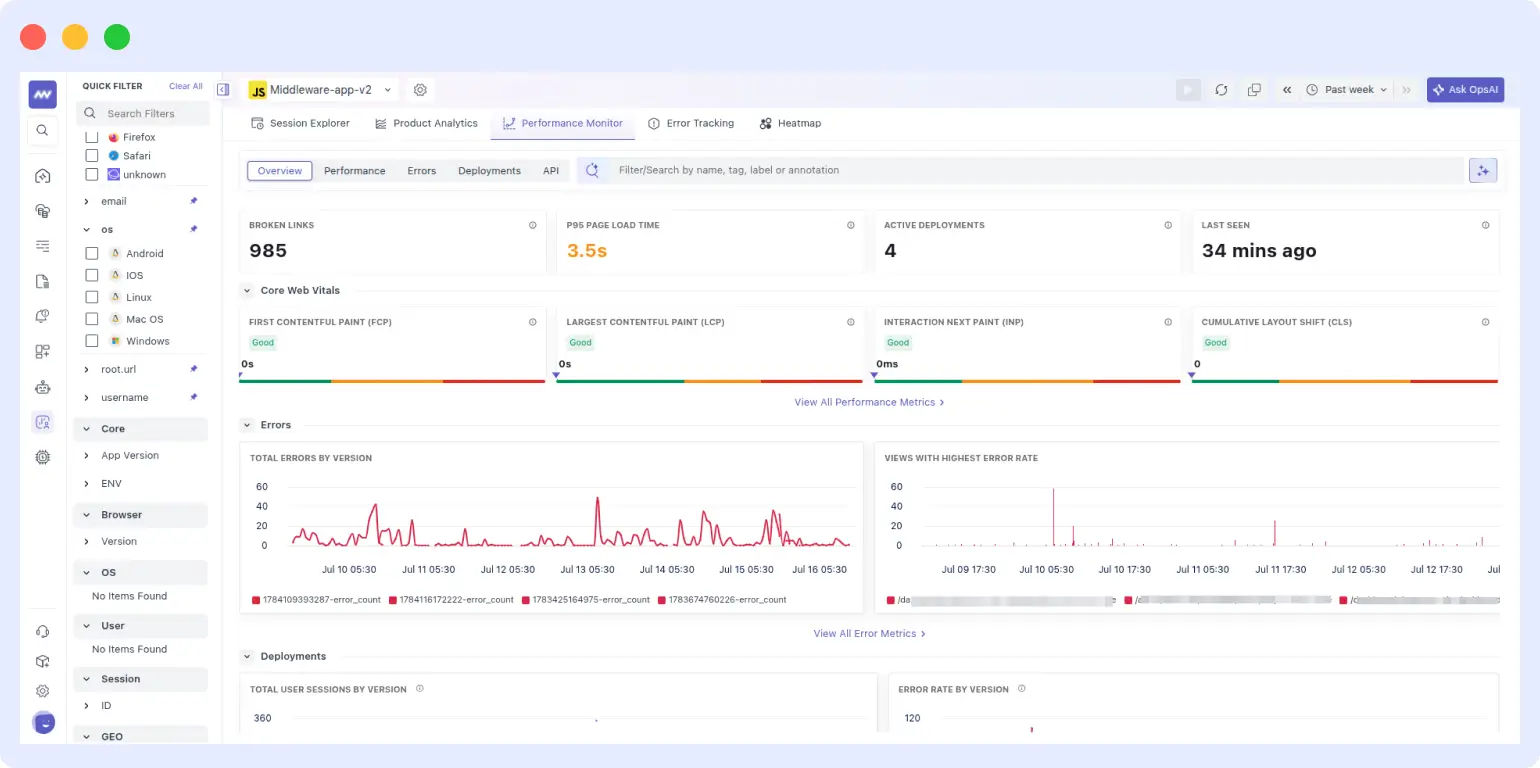
For teams using the frontend-to-backend correlation solution in Middleware, this full chain, from user click to database query to code fix, is visible in a single unified view without switching between tools.
How trace correlation identifies which microservice is causing an API failure
In a microservices architecture, “the API is failing” is the least useful statement you can make about an incident. It tells you which endpoint users are hitting but nothing about which of the 6 internal services that endpoint calls is responsible for the failure. This is why incident response in microservices environments historically requires senior engineers with deep knowledge of service dependencies.
Distributed trace correlation eliminates that dependency on tribal knowledge. When OpsAI analyzes a failing API request, it looks at the full span tree, not just the edge service’s response time, but every hop the request made and how long each hop took.
A typical span tree for a failing e-commerce API call might look like this:
| Service | Operation | Duration | Status |
|---|---|---|---|
| API Gateway | Route /api/order | 8ms | OK |
| Order Service | validate_cart() | 12ms | OK |
| Inventory Service | check_stock() | 9ms | OK |
| Payment Service | process_payment() | 7,612ms | TIMEOUT |
| Payment Service DB | SELECT + BEGIN | 7,590ms | POOL_EXHAUSTED |
From this span tree, OpsAI can determine in under a minute what might take a human engineer 30 to 45 minutes of log searching to find: the API gateway, order service, and inventory service are all healthy. The payment service is the bottleneck, and within the payment service, the root cause is database connection pool exhaustion, not the payment logic itself.
This precision matters because it changes both the urgency and the nature of the fix. An alert that says “checkout API p99 latency exceeded 5s” triggers a broad investigation. A finding that says “payment service connection pool is exhausted, see function process_payment() in payment/service.py” is immediately actionable.
API error monitoring with AI vs traditional APM alerting
Traditional APM alerting operates on static thresholds applied to aggregate metrics: alert when error rate exceeds 1%, alert when p99 latency exceeds 2,000ms, alert when the endpoint returns 5xx more than N times per minute. This approach has served engineering teams reasonably well for monolithic applications, but it has three critical weaknesses in modern API-driven architectures.
| Dimension | Traditional APM alerting | OpsAI API error monitoring |
|---|---|---|
| Detection scope | Backend metrics only, misses frontend impact | Cross-stack: APM traces + RUM sessions correlated |
| Detection threshold | Fires when a static metric threshold is crossed | Detects anomalies and patterns before threshold breach |
| Root cause | Points to the failing service, not the failing code | Pinpoints the file, function, and line responsible |
| Microservice attribution | Requires manual trace exploration to isolate | Identified automatically from span tree analysis |
| User impact visibility | Not available, separate RUM tool required | Directly correlated: X users affected, Y sessions broken |
| Resolution action | Alert, page engineer, investigate, fix | Alert, OpsAI RCA, PR opened or fix applied |
| Time from detection to fix | 30 to 90 min (human-driven investigation) | Under 5 min (OpsAI auto-investigation + PR) |
| False positive rate | High, noisy threshold alerts cause alert fatigue | Low, AI filters noise, surfaces actionable incidents |
The most consequential difference is the user impact visibility row. Traditional APM tells you that a backend service is behaving abnormally. OpsAI tells you that 847 users experienced a broken checkout in the last 12 minutes, 312 of them abandoned their sessions, and here is the exact backend trace that caused it. The former is a technical signal. The latter is a business-severity finding that drives prioritization and urgency correctly.
How OpsAI auto-fixes API errors: the full remediation flow
OpsAI’s remediation capability for API errors follows a five-stage flow that begins at the moment an issue is detected and ends with either an applied fix or an opened pull request, typically in under 5 minutes from the first signal. For the engineering story behind this investigation loop, see how we built an AI SRE agent for production incidents.
Stage 1: Cross-signal detection
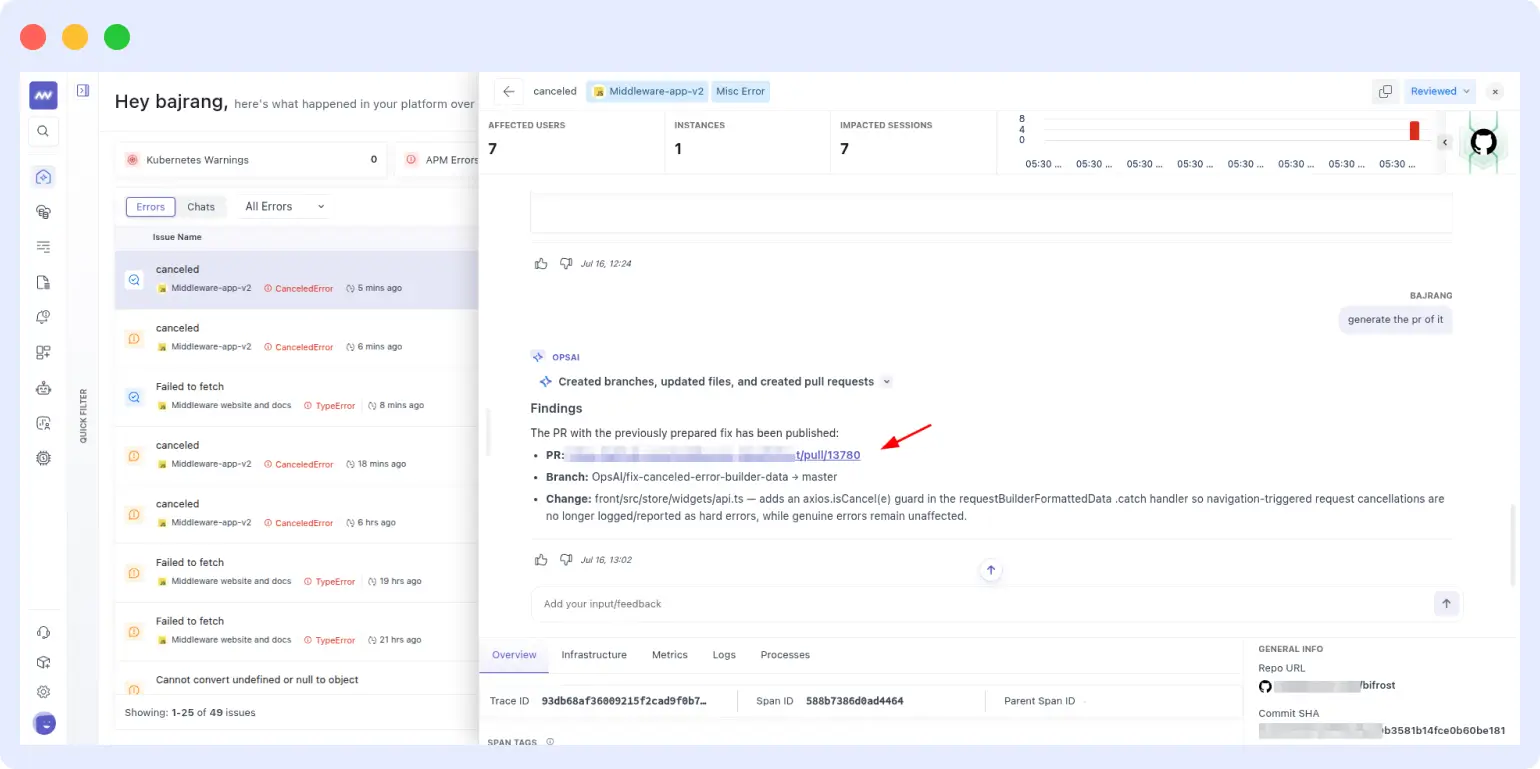
OpsAI continuously monitors APM error rates, latency distributions, RUM session failure rates, and infrastructure metrics simultaneously. Detection is not limited to threshold breaches, OpsAI’s anomaly detection identifies deviations from baseline behavior, including early-stage latency increases that precede user-visible failures. This gives a 5 to 15 minute window to act before the error rate crosses a threshold that would generate traditional alerts.
Stage 2: Trace-level root cause analysis
When an API error is detected, OpsAI pulls the full distributed trace for affected requests and analyzes the span tree to identify the root cause service and operation. It cross-references this with log data from the affected service, infrastructure metrics (CPU, memory, connection pool counts), and error metadata including stack traces and exception messages.
Stage 3: Code context retrieval
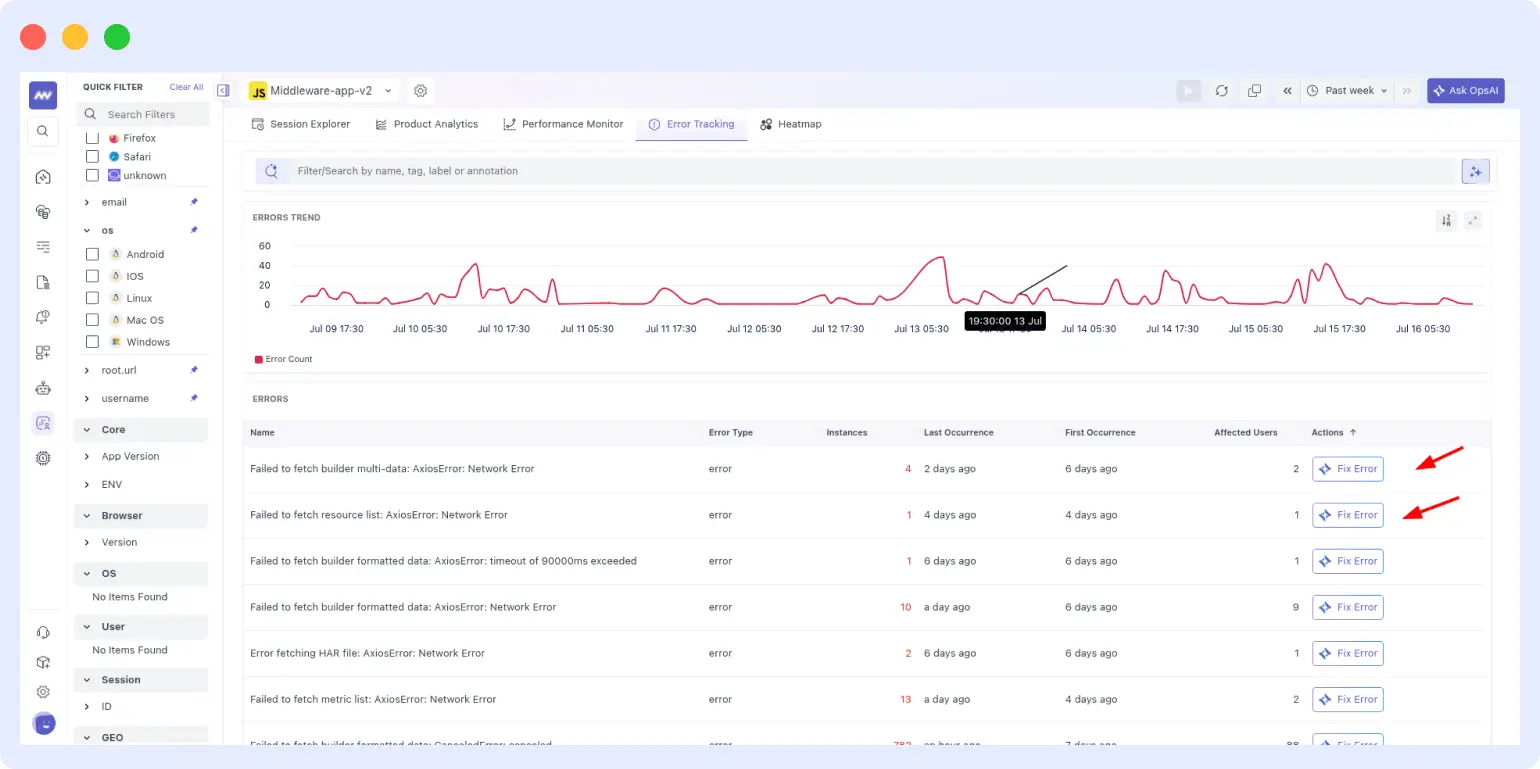
If a GitHub or Bitbucket repository is connected via the GitHub MCP integration, OpsAI reads only the files relevant to the identified error, specifically the service, module, and function that the stack trace points to. It does not scan the full codebase. This targeted retrieval gives OpsAI the source code context needed to propose a meaningful fix rather than a generic recommendation.
Stage 4: Fix generation
OpsAI generates a candidate fix targeting the specific root cause: the code change, configuration update, or query modification that addresses the identified failure mode. The fix is minimal and targeted, OpsAI does not refactor surrounding code or introduce changes beyond what is needed to resolve the incident.
Stage 5: Pull request with full context
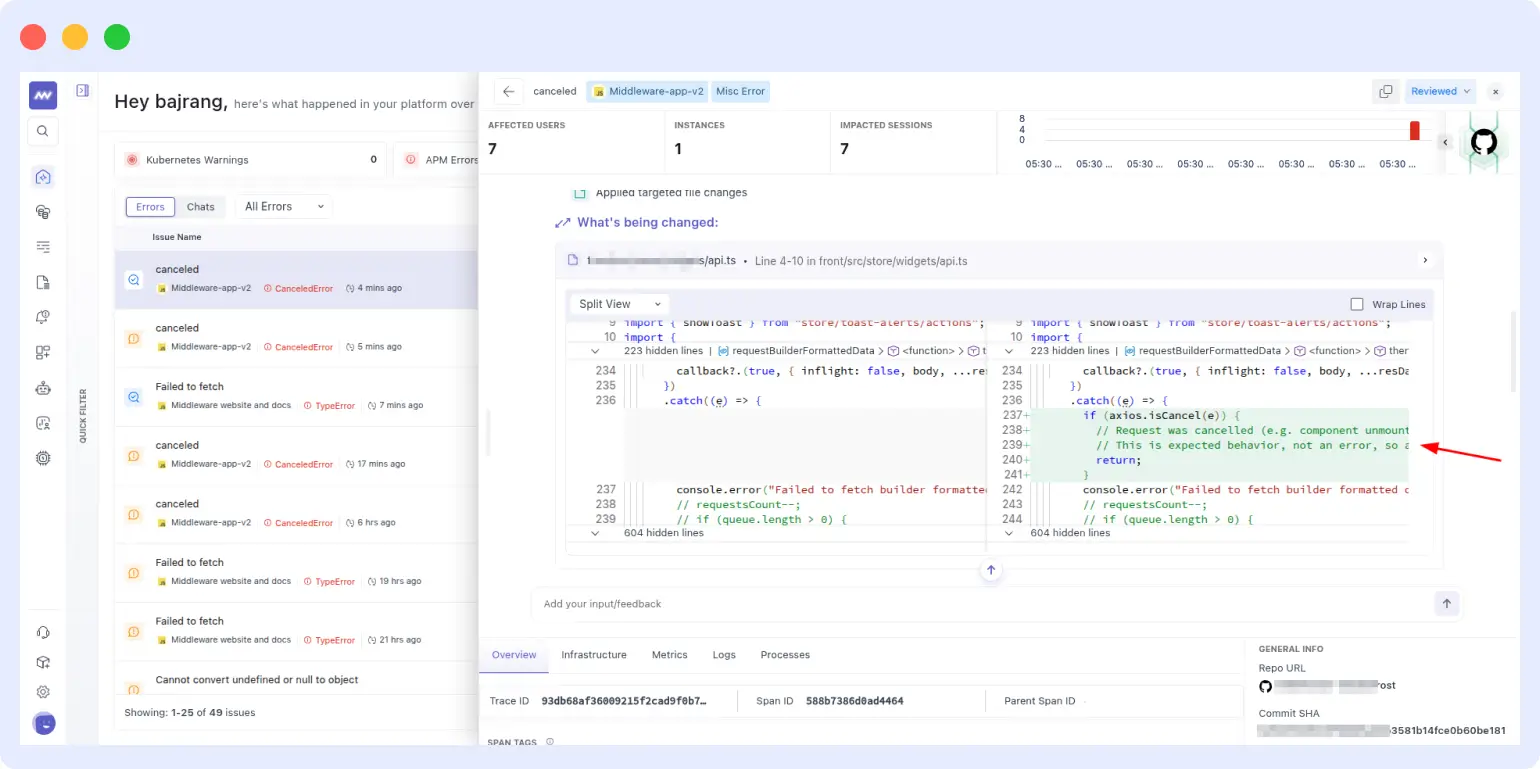
OpsAI opens a pull request in your repository with:
- A clean side-by-side diff showing the proposed change
- A description explaining what failed, why, and how the fix addresses it
- Cross-references to the incident: affected trace IDs, user session count, error timeline
- Enough context for a fast review without requiring the reviewer to have investigated the incident independently
For the engineer reviewing the PR, this is a fundamentally different experience than receiving a pager alert and starting an investigation from scratch. The investigation is already done. The fix is already written. The review is a quality check, not a debugging session.
Real scenarios: payment 504, checkout 500, auth regression
Scenario 1: Payment API returning 504 timeouts
A payment API endpoint begins returning 504 timeouts to approximately 3% of requests during peak traffic. The backend error rate (3%) is below most alert thresholds. But RUM data shows that 3% of requests represents 200 users per hour hitting a broken checkout, with a session abandonment rate of 78% on that error.
What OpsAI does: RUM session failures on the checkout page are correlated with APM traces for /api/payment/confirm. The span tree shows the payment service making a downstream call to a card authorization microservice that is timing out after 8,000ms. The authorization microservice’s own traces show connection pool exhaustion on its Redis cache for session tokens, a cache that was not scaled when traffic increased 40% last week.
OpsAI surfaces the finding: root cause is Redis connection pool size insufficient for current traffic volume, with the specific configuration parameter responsible. It opens a PR modifying the Redis client initialization to increase the connection pool size and adds exponential backoff on connection acquisition failure. The fix ships before the error rate reaches 5% and triggers a traditional threshold alert.
Scenario 2: Checkout API returning intermittent 500 errors
A checkout API returns 500 errors on roughly 1 in 50 requests. The errors are distributed enough that they do not consistently appear in any single user session, making them difficult to reproduce. Backend monitoring shows an error rate below 2%, within acceptable range for many alerting configurations.
What OpsAI does: OpsAI groups the intermittent errors by stack trace fingerprint and identifies that all 500s share the same error path: a KeyError in the cart serialization function when the user’s cart contains a product that was recently marked as discontinued. The RUM correlation shows these errors are not random, they affect users who added items to their cart before a specific product catalog update deployed three days ago.
OpsAI pinpoints the affected function in the cart service codebase, identifies the missing null check on the product status field, and opens a pull request with the fix and a migration script to handle existing carts with discontinued items. The PR is reviewed and merged in 18 minutes from detection to deployment.
Scenario 3: Authentication API regression after a deployment
Twelve minutes after a deployment, OpsAI detects a rising p99 latency on the authentication API, from 180ms baseline to 420ms. Error rate has not increased, this is a latency regression, not an error. But RUM data shows that users on mobile connections where 420ms authentication is causing their session token refresh to time out, triggering unexpected logout events.
What OpsAI does: Trace analysis isolates the latency increase to a new database query introduced in the deployment, a query that performs a full table scan on the user sessions table instead of using the indexed lookup that the previous query used. OpsAI correlates the deployment event with the latency change timestamp and identifies the specific migration that caused the regression.
It opens a PR adding the missing index and modifying the query to use it. The review is fast because OpsAI has already done the attribution work: this deployment, this query, this index, here is the fix.
How OpsAI fits into on-call and SRE workflows
Everything above describes what OpsAI does to a single API error. Zoom out to the on-call rotation and the value compounds: instead of a 2 AM page followed by 45 minutes of manual trace and log searching, the engineer who gets paged already has the finding.
What an AI SRE agent shows an engineer during a live incident
OpsAI is Middleware’s AI SRE agent: it watches APM, RUM, logs, and infrastructure signals continuously, and when a P1 fires, the on-call engineer opens the findings panel to a completed investigation rather than a blank dashboard. That panel shows the affected service, the specific failing operation, the number of users and sessions impacted, and, for application code errors, a pull request with a proposed fix already attached. The engineer’s first action is a review, not a search.
Reducing on-call burnout
Most on-call fatigue comes from the investigation phase, not the fix itself, being paged awake to manually correlate three dashboards before you can even start writing a fix. By doing the cross-signal correlation and root cause analysis automatically, OpsAI collapses that phase to minutes. Engineers still make the final call on application-level changes, but they are reviewing a documented finding instead of starting from a blank incident channel. For a deeper walkthrough of what this looks like end-to-end, see how OpsAI works as an AI SRE agent for on-call engineers.
AI SRE copilot vs traditional runbooks
A runbook only works if the incident matches a pattern someone already documented, and it goes stale as the system changes. OpsAI does not rely on a pre-written runbook: it re-derives the root cause from the live trace, log, and RUM data every time, so it also catches novel failure modes a runbook was never written for, like the discontinued-product KeyError in Scenario 2 above. That said, runbooks are still useful for organizational context, like who to page and what to communicate externally, so OpsAI is best thought of as replacing the investigation step, not the incident communication process.
This is also what removes the dependency on tribal knowledge described earlier: institutional knowledge about which service usually causes checkout slowness used to live in a few senior engineers’ heads. Trace correlation makes that knowledge derivable from the data itself, on every incident, regardless of who is on call. OpsAI also gets faster on repeats specifically: it fingerprints resolved incidents and matches new occurrences against that history, see how OpsAI’s repeat incident detection and Auto RCA works for the full mechanism.
How to set up OpsAI for API error monitoring and auto-fix
APM SDK, RUM snippet, GitHub MCP: the three-step setup for auto-fix.
There are three components to configure for full APM trace and RUM correlation with OpsAI auto-fix: the APM SDK, the RUM snippet, and the GitHub repository connection.
Step 1: Install the APM SDK
Install the Middleware APM SDK for your backend language. OpsAI supports Python, Node.js, Go, Java, and Next.js. Each SDK automatically instruments your application to capture distributed traces with the trace IDs needed for frontend-backend correlation.
See the APM configuration documentation for language-specific setup. The key requirement for OpsAI API error auto-fix is that trace context propagation is enabled, this ensures trace IDs are forwarded to downstream services and are available for span tree analysis.
Step 2: Add the RUM JavaScript snippet
Add the Middleware RUM snippet to your frontend application. The snippet captures user sessions, API call outcomes, JavaScript errors, and Core Web Vitals, and automatically attaches the distributed trace ID from outbound API calls to the corresponding RUM session data.
This is the connection that enables OpsAI to link a broken user session directly to the backend span that caused it. Without RUM instrumentation, OpsAI can still perform backend API error analysis, but user impact data is not available.
Full setup is documented at docs.middleware.io/rum/rum-overview.
Step 3: Connect your GitHub or Bitbucket repository
Connect your code repository via the GitHub MCP integration in Middleware settings. Set these environment variables in your CI pipeline to ensure OpsAI targets the correct branch when opening pull requests:
MW_VCS_REPOSITORY_URL=<your repository URL>
MW_VCS_COMMIT_SHA=<commit SHA>
OpsAI accesses only the files related to a specific error through the MCP connection, it never scans your full codebase and does not store your source code.
Step 4: Enable alert ingestion in OpsAI settings
Go to Settings > OpsAI Setting and enable the Alert Ingestions toggle. This automatically feeds Middleware’s native APM and infrastructure alerts into OpsAI. If you are using Datadog or Grafana for API monitoring, connect them via the Datadog integration or Grafana integration, OpsAI will run trace correlation and RCA against their alert data inside Middleware.
What OpsAI can fix automatically vs what it proposes for review
- Application code errors (API handler bugs, missing null checks, query issues), OpsAI opens a pull request for human review
- Kubernetes-layer issues affecting API performance (pod OOMKills, CrashLoopBackOff on API service pods, HPA misconfiguration causing API capacity limits), OpsAI can apply the fix directly in Auto Fix mode. See how OpsAI auto-remediates Kubernetes pod crashes for the full mechanism, or Kubernetes monitoring for how these signals are collected.
- Configuration-level issues identified through trace analysis, surfaced in the findings panel with specific remediation steps
Full setup documentation is at docs.middleware.io/opsai/opsai_overview.
Catch API failures at the trace level, before your users do
Every API failure that reaches a user before your monitoring catches it is a compounding problem: session abandonment, support tickets, revenue lost, and an investigation that starts after impact rather than before. OpsAI gives your team the correlation layer that connects what users experience in the browser to what is happening in your backend traces, and acts on that connection automatically.
Install the APM SDK and RUM snippet and OpsAI begins correlating traces with user sessions immediately.
FAQs
What is the best way to correlate APM traces with frontend RUM sessions to catch API errors early?
Share a trace ID between your RUM and APM SDKs. The RUM SDK attaches it to every outbound API call, and the APM SDK propagates it through every backend service the call touches, so a session failure traces directly to the backend span that caused it. Middleware does this automatically once both are installed.
Can AI automatically fix a failing API endpoint without a human approving the change?
For Kubernetes-layer issues, like OOMKilled pods or HPA misconfiguration, OpsAI can apply fixes directly in Auto Fix mode. For application code errors, it opens a pull request for human review instead of merging automatically, keeping teams in control of production code changes.
How does trace correlation help identify which microservice is causing an API failure?
A distributed trace records the time spent at every service a request passes through, as a tree of spans. OpsAI analyzes that span tree to find exactly which service and operation added latency or failed, instead of requiring manual log searches across every service in the chain.
Why are users seeing API errors that my backend monitoring is not catching?
Usually because the error rate sits below your alert threshold while still causing session abandonment, retries mask failures the backend logs as eventual successes, or the issue only affects a cohort too small to trip aggregate thresholds. RUM monitoring surfaces all three; backend-only monitoring misses them.
Does OpsAI work if my team already uses Datadog or Grafana for API monitoring?
Yes. OpsAI ingests alerts from both and runs the same trace correlation and root cause analysis against their data inside Middleware, without requiring you to migrate your existing alert configuration.
What is an AI SRE agent, and how does it work during live incidents?
An AI SRE agent continuously correlates traces, RUM sessions, logs, and infrastructure metrics, and performs root cause analysis automatically when it detects an anomaly. During an incident, it surfaces the affected service, the failing operation, and, when connected to a repository, a proposed fix, before a human starts investigating.
How do I reduce on-call burnout for engineers using AI tools?
Most on-call fatigue comes from the investigation phase, being paged to manually correlate dashboards before you can even start fixing anything. AI SRE agents like OpsAI automate that correlation and root cause analysis, so the engineer’s first action is reviewing a finding instead of starting from zero.
AI SRE copilot vs traditional runbooks, which is better for new engineers?
Runbooks only help when an incident matches a documented pattern, and they go stale as systems change. An AI SRE copilot re-derives root cause from live data every time, catching failure modes no runbook covers. Most teams get the most value using both together.
How can I use an AI assistant to transfer SRE knowledge without relying on tribal memory?
Trace correlation makes institutional knowledge, like which service usually causes checkout slowness, derivable from the data itself instead of a senior engineer’s memory. OpsAI re-analyzes the full trace, log, and RUM data for every incident and surfaces the same finding regardless of who’s on call.
How can APM tools reduce mean time to resolution for production incidents?
By narrowing the investigation window: distributed tracing pinpoints the responsible service instead of requiring manual log searches, and AI-powered APM adds automatic root cause analysis and fix generation, cutting typical detection-to-fix time from 30 to 90 minutes down to under 5.

