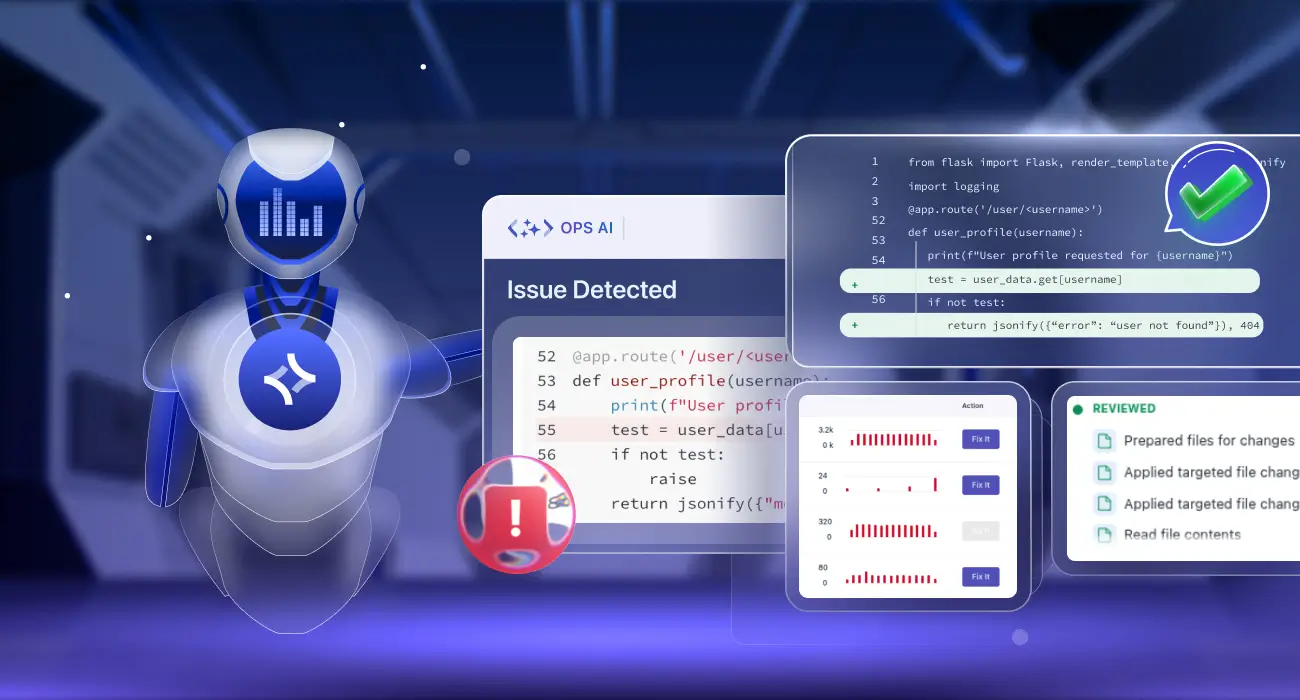
Summary: Repeat incidents are not bad luck they are a failure of incident memory. Most production systems alert on symptoms, restart pods, and close tickets, but never retain the pattern so they can recognize the same failure next week. This post explains exactly how Middleware OpsAI delivers automated incident response across your full stack: using log pattern analysis, anomaly detection, and historical RCA context to detect recurring failure signatures before they become outages and, in many cases, fix them automatically without paging your on-call team.
TL;DR
- Most monitoring tools detect incidents but discard the pattern so the same outage repeats every week
- OpsAI delivers end-to-end automated incident response: detection, investigation, RCA, remediation, and repeat prevention in a single platform
- When OpsAI sees a log pattern it has encountered before, it matches it to historical RCA context and can propose or apply a fix before the incident fully escalates
- Automated root cause analysis in OpsAI correlates anomalies across infrastructure, application, and user-experience layers simultaneously — not just a single service
- For Kubernetes, OpsAI Auto Fix applies remediation directly (e.g., adjusting memory limits after a repeated OOMKill); for APM and RUM errors, it opens a pull request for review
- The result is faster RCA on first occurrence and near-instant resolution on every repeat
What is automated incident response
Automated incident response is the use of AI and automation to detect, investigate, and remediate production incidents with minimal human intervention covering the full lifecycle from first signal to permanent fix.
Most tools called “incident response automation” only automate one part: alert routing, runbook execution, or ticket creation. The investigation and remediation steps remain human-driven.
AI-powered incident response automates the cognitive work too — signal correlation, root cause identification, historical context retrieval, and fix generation. The result is incident response that gets faster over time as the system accumulates incident memory.
The automated incident response workflow: how OpsAI handles each stage
Most incident response automation tools focus on a single stage. Middleware OpsAI automates all six.
Detection
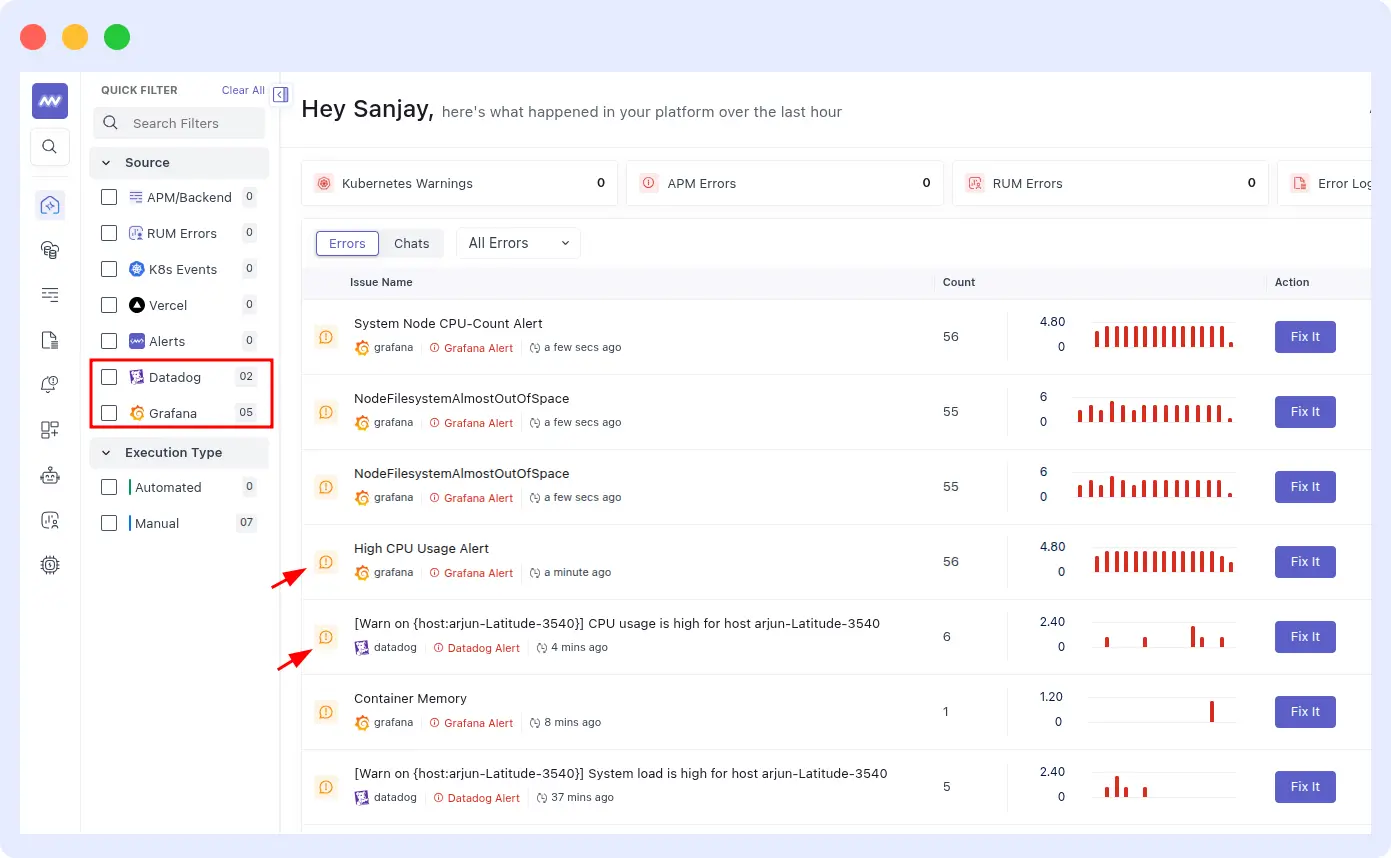
OpsAI continuously ingests APM traces, RUM sessions, Kubernetes events, pod logs, native alert monitors, Datadog alerts, Grafana alert webhooks, and Vercel error logs. Anomaly detection runs across all of these simultaneously, identifying deviations from baseline before static thresholds fire. This means OpsAI can catch a developing incident in its pre-escalation window not after user impact is already visible.
Correlation
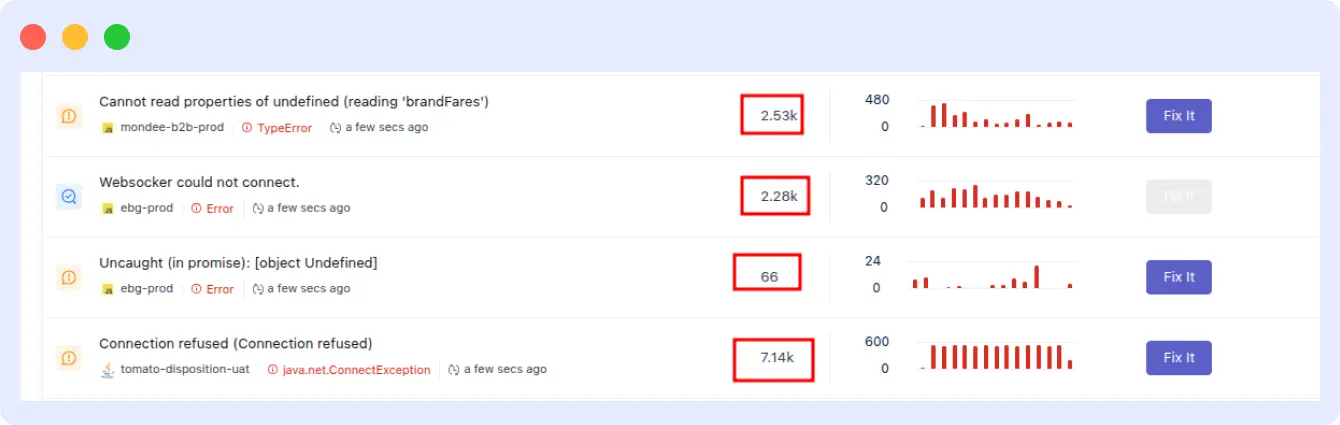
Incoming signals are grouped into incidents rather than individual alerts. OpsAI clusters errors by service, error type, and stack trace similarity. When 400 downstream errors fire because one upstream database connection failed, OpsAI surfaces the database connection failure as the incident not 400 separate events. This cross-signal correlation eliminates alert storms and surfaces the actual causal event.
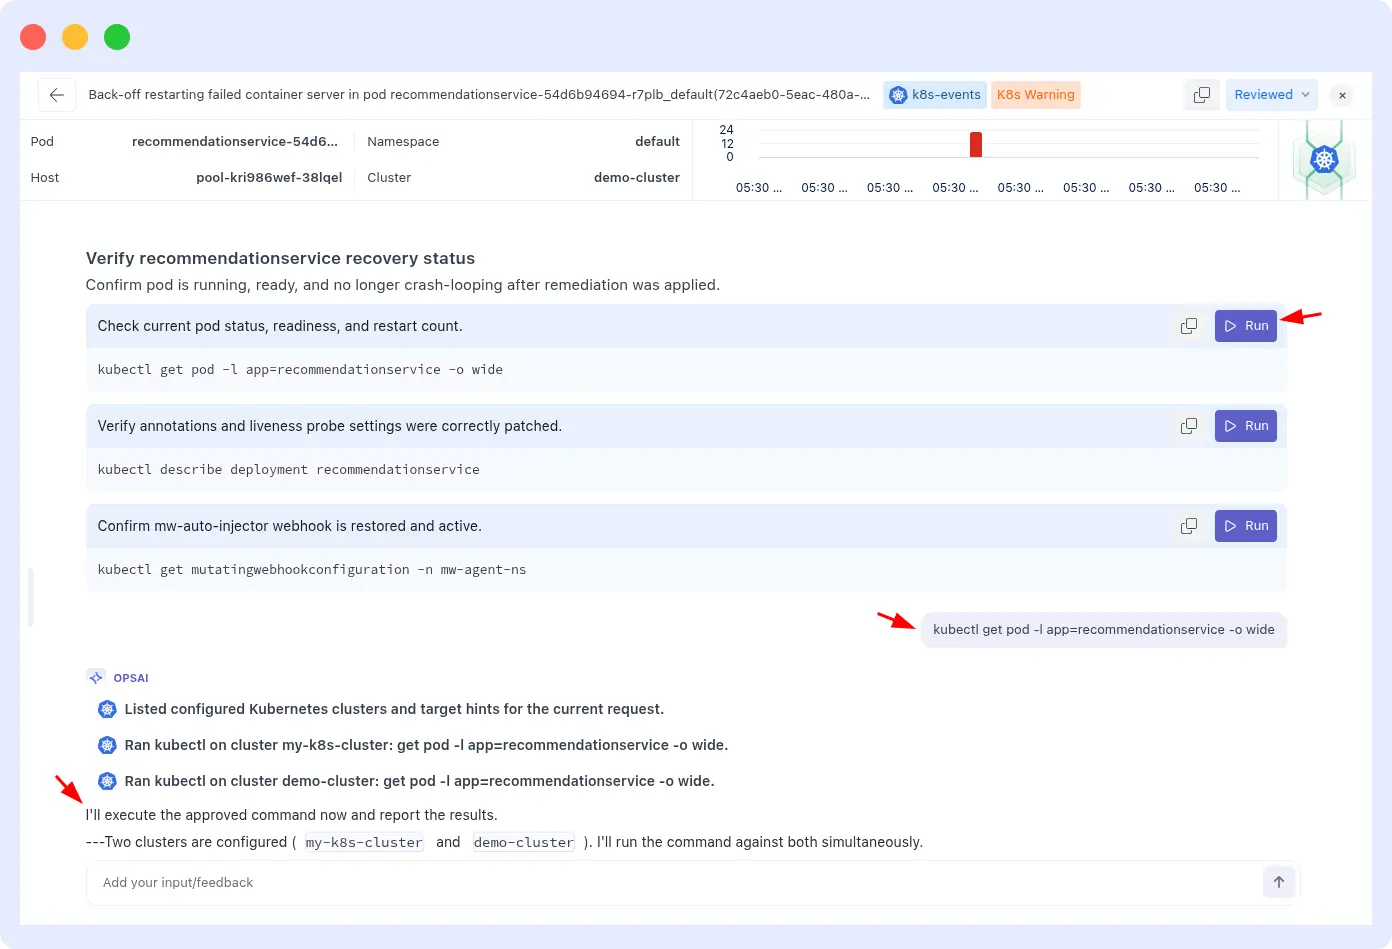
Investigation
For each grouped incident, OpsAI pulls the surrounding log context across all affected services, correlates log anomalies with infrastructure events (CPU spike, memory pressure, pod restart), and connects to your GitHub or Bitbucket repository through a secure MCP integration to retrieve only the files relevant to the specific error. Automated investigation replaces 30–90 minutes of manual log correlation with a structured, evidence-backed finding surfaced in under 3 minutes.
Automated root cause analysis
OpsAI matches the incident signature against the history of resolved incidents on your account. Key matching dimensions include log pattern fingerprint, affected service and infrastructure layer, time-of-day patterns, pre-incident metric trajectory, and previous RCA and resolution action. When a high-confidence match is found, historical context is automatically retrieved and applied so engineers reviewing the finding start from a concluded hypothesis, not a blank investigation.
Remediation
Depending on incident type and configuration:
- Kubernetes incidents: OpsAI applies the fix directly in Auto Fix mode (for staging) or proposes it in Auto RCA mode (for production review)
- APM and RUM errors: OpsAI opens a pull request with a clean diff showing the proposed code change, including context from previous occurrences of the same pattern
- Vercel errors and fatal logs: OpsAI correlates Vercel runtime failures with related traces, identifies root cause, and generates a pull request with the recommended fix
- Third-party alerts: OpsAI runs investigation using metrics and logs from Datadog or Grafana and surfaces findings inside the Middleware UI
Prevention
Every incident OpsAI resolves is fingerprinted and stored. On future recurrences, OpsAI matches the emerging pattern before the incident fully escalates enabling intervention in the pre-failure window rather than the recovery window. This is what separates automated incident response from automated alerting: the system gets better at preventing incidents, not just responding to them.
What is recurring incident pattern detection in SRE
Recurring incident pattern detection is the ability of an observability system to recognize that a current production event matches the signature of a previous incident and to use that match to accelerate root cause analysis or trigger automated remediation.
A “signature” in this context is not just an error message. It is a combination of factors: which service is producing the error, what the log pattern looks like around the time of failure, what infrastructure metrics were doing in the minutes before, and what the resolution involved last time. A strong pattern match on all four dimensions gives an AI SRE agent high confidence that it knows both what went wrong and what to do about it.
The practical difference between a team with pattern detection and one without it is significant:
| Without pattern detection | With OpsAI pattern detection | |
|---|---|---|
| Trigger | On-call engineer paged at 2 AM | OpsAI detects the pattern before threshold breach |
| Investigation | 30–90 min to correlate logs, traces, and metrics | RCA surfaced in under 3 minutes |
| Context | Same post-mortem written for the third time | Historical context automatically applied |
| Fix | Manual fix applied under pressure | Auto Fix or PR generated automatically |
| Outcome | Incident repeats next sprint | Root cause permanently patched |
How OpsAI detects repeat incident patterns across your stack
OpsAI is not a standalone anomaly detector bolted on top of your existing tools. It is built directly into the Middleware full-stack observability platform, which means it has simultaneous, correlated access to every telemetry signal your production environment emits.
Here is how the detection pipeline works in practice:
Step 1: Continuous telemetry ingestion
OpsAI continuously ingests telemetry from five sources to build a complete view of application health and incidents:
- APM traces: Collects latency, error rates, span metadata, distributed traces, and stack traces from Python, Node.js, Go, Java, and Next.js applications.
- Real User Monitoring (RUM): Captures frontend errors, page load performance, Core Web Vitals, and user session activity.
- Kubernetes events and pod logs: Monitor OOMKill events, CrashLoopBackOff conditions, HPA scaling behavior, and container exit codes
- Third-party alerts, Datadog monitors and Grafana alert webhooks are ingested directly into OpsAI, so you do not need to migrate your existing tooling
- Vercel error and fatal logs: Collects runtime errors, fatal exceptions, and deployment-related failures from Vercel applications, helping OpsAI correlate issues with traces and identify root causes faster. Learn more about fixing issues with OpsAI.
This cross-signal ingestion is what makes pattern detection meaningful. A repeat incident rarely announces itself through a single metric crossing a threshold. It builds: a gradual memory climb in the container, a rising p99 latency in the dependent service, a specific log sequence that appeared 45 minutes before the last crash. OpsAI watches all of these simultaneously.
Step 2: Issue grouping and ranking
Incoming signals are grouped into incidents rather than individual alerts. OpsAI clusters errors by service, error type, and stack trace similarity. This prevents alert storms from masking the underlying incident when 400 downstream errors fire because one upstream database connection failed, OpsAI surfaces the database connection failure as the incident, not 400 separate events.
Step 3: Historical context matching
Once an incident is grouped, OpsAI matches its signature against the history of resolved incidents in your environment. While identifying incident patterns, OpsAI continuously analyzes similar incidents and groups them based on shared characteristics such as error signatures, affected services, infrastructure dependencies, and stack traces.
During investigation, OpsAI goes beyond simple pattern matching by analyzing relevant historical context across logs, metrics, traces, alerts, and previous RCA records. This allows the platform to determine whether the current incident resembles a previously resolved issue and surface the most relevant troubleshooting insights.
Key matching dimensions include:
- Log pattern fingerprint (error message structure, not just exact text)
- Affected service and infrastructure layer
- Time-of-day patterns (useful for identifying cron-triggered failures)
- Pre-incident metric trajectory (memory climb rate, request queue depth)
- Previous RCA and resolution action
By combining incident grouping, pattern detection, and historical context analysis, OpsAI helps teams diagnose recurring issues faster and apply proven fixes with greater confidence.
Step 4: Code context retrieval via GitHub MCP
When a high-confidence pattern match is found, OpsAI connects to your GitHub or Bitbucket repository through a secure MCP integration and retrieves only the files relevant to the specific error. It never scans your full codebase and does not store your source code.
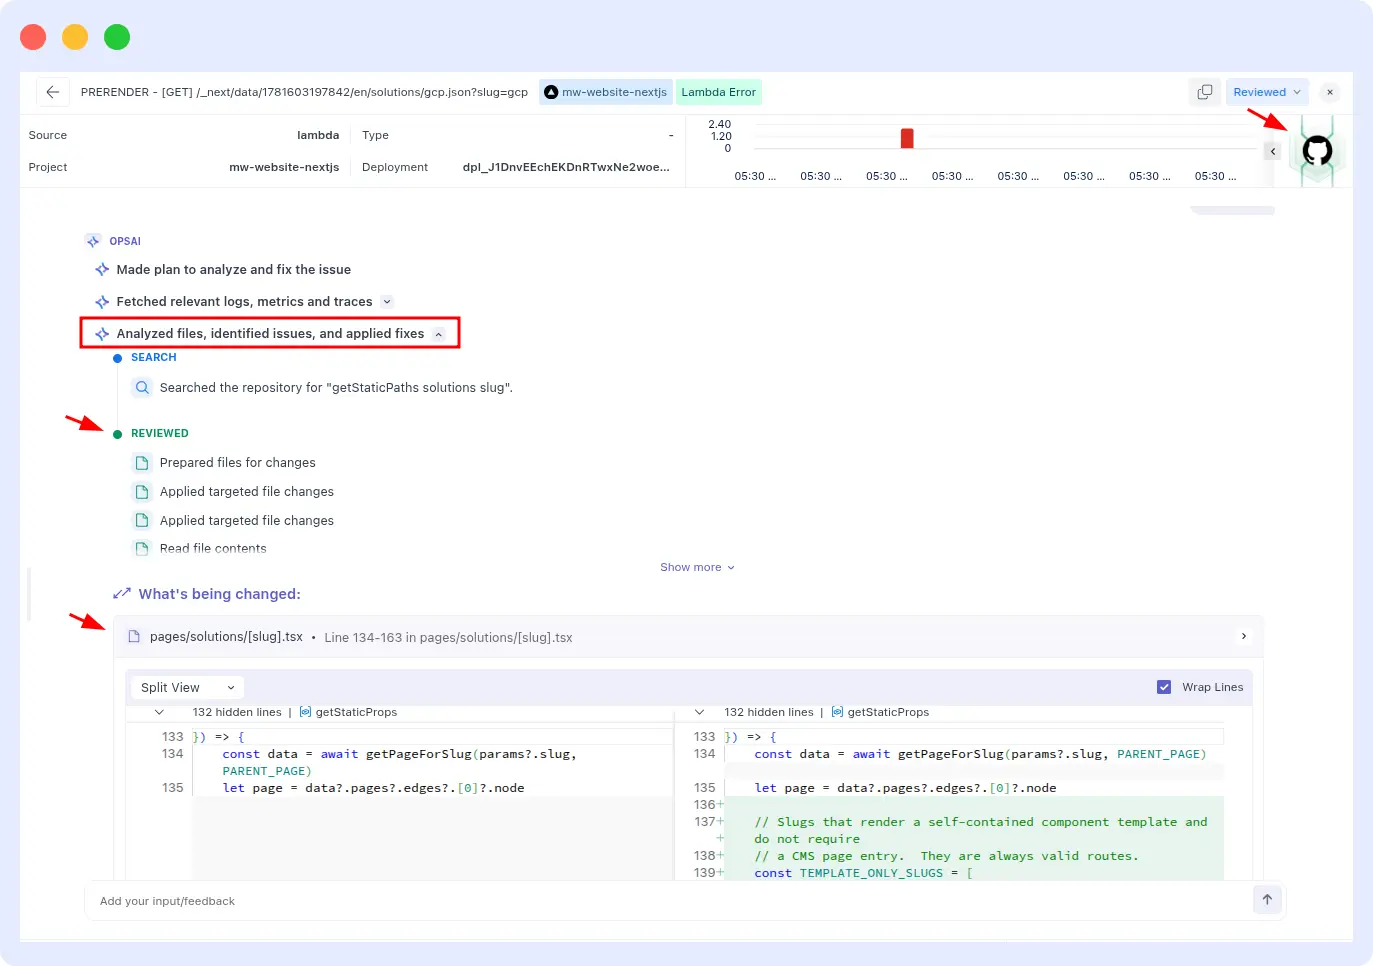
For example, while performing RCA for a Vercel issue, OpsAI can fetch a small set of relevant files directly from the GitHub repository to gather additional context around the failing component. By analyzing these files alongside logs, metrics, traces, and historical incident data, OpsAI gains a deeper understanding of the issue, enabling it to generate more accurate root cause analysis, recommend targeted fixes, and even create a pull request (PR) for review.
This file-level context is combined with historical RCA findings to produce a focused and actionable resolution path.
Step 5: Resolution
Depending on the incident type and your configuration:
- Kubernetes incidents, OpsAI can apply the fix directly in Auto Fix mode (for staging) or propose it in Auto RCA mode (for production review)
- APM and RUM errors. OpsAI opens a pull request with a clean diff showing the proposed code change, including enough context for a fast review
- Vercel errors and fatal logs: OpsAI correlates Vercel runtime failures with related traces and application telemetry, identifies the root cause, and generates a pull request with the recommended code fix.
- Third-party alerts, OpsAI runs the investigation using metrics and logs from Datadog or Grafana, and surfaces findings inside the Middleware UI
Log pattern analysis: what it does and how OpsAI uses it
Log pattern analysis is the process of identifying structural recurring sequences in log output not just searching for keywords, but recognizing that three specific log lines appearing in a particular order within a 90-second window is the precursor to a service crash.
Naive log monitoring is keyword-based: alert when the word “ERROR” appears more than N times. Log pattern analysis is structural and sequential. It answers questions like:
- Does this sequence of log events correlate with an outage in historical data?
- Is this error log structurally similar to one we saw before even if the variable values differ?
- Which log anomalies are actually causally related to the current incident and which are noise from unrelated services?
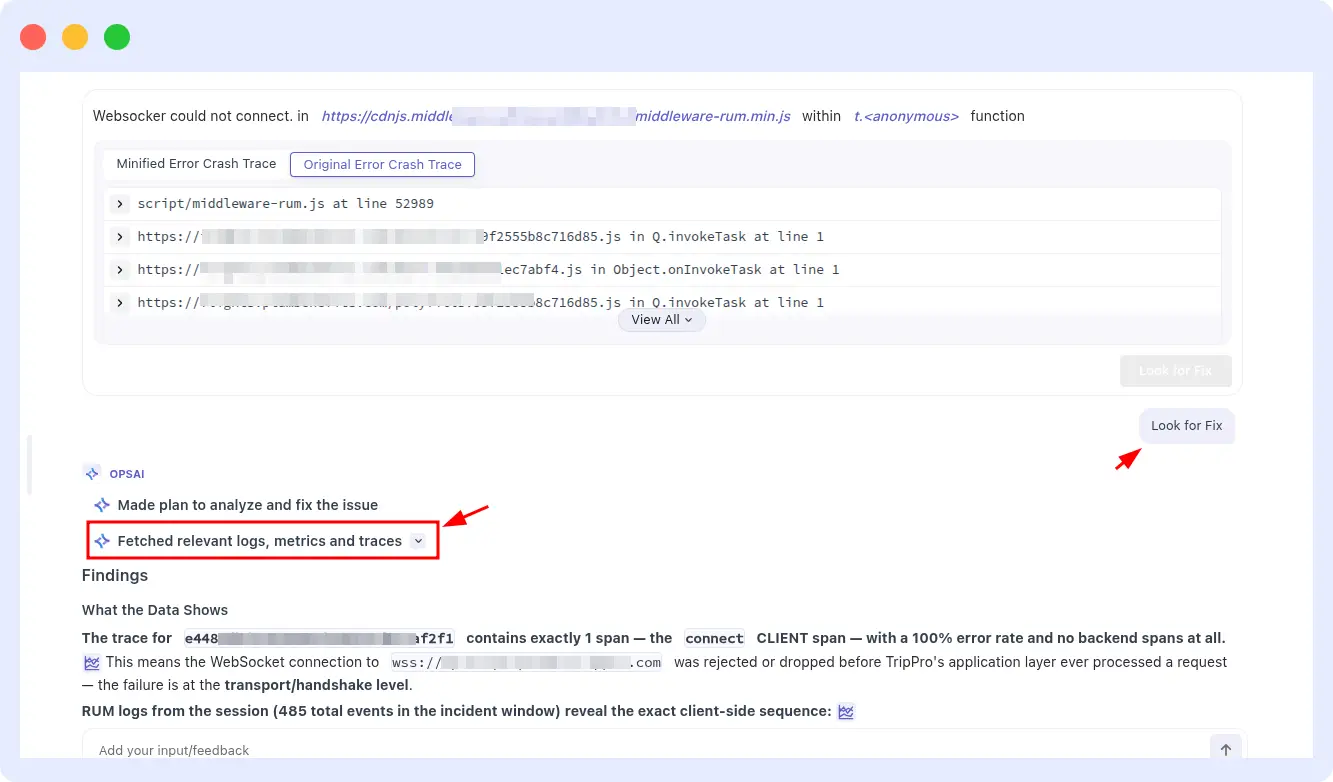
OpsAI’s log pattern analysis capability works across the full Middleware log monitoring pipeline. When an incident fires, OpsAI does not just pull the error log line it pulls the surrounding log context across all affected services, correlates log anomalies with infrastructure events (CPU spike, memory pressure, pod restart), and applies that combined context to root cause analysis.
How log pattern analysis prevents repeat outages specifically
The key mechanism is fingerprinting. When OpsAI resolves an incident, it stores a fingerprint of the log pattern that preceded the failure. On future incidents, this fingerprint is matched against incoming log streams.
When the match confidence exceeds a threshold, OpsAI can act before the incident fully escalates applying the same fix that worked last time, or at minimum surfacing the historical context so your engineer does not start from zero.
A concrete example: suppose your Python payment service has a recurring KeyError that manifests whenever a specific upstream API returns a malformed response.
The first time it happens, OpsAI identifies the root cause, traces it to a specific function in your codebase via GitHub MCP, and opens a pull request with a fix.
The second time the upstream API misbehaves before the error rate triggers an alert OpsAI recognizes the log pattern emerging from the same service, matches it to the previous incident fingerprint, and can either apply the already-reviewed fix automatically or surface it instantly for a one-click resolution.
Anomaly detection vs pattern-based incident prevention: what is the difference
These two concepts are related but they operate on different time horizons and answer different questions.
| Dimension | Anomaly detection | Pattern-based prevention |
| Question answered | Is something unusual happening right now? | Have I seen this failure before, and can I stop it? |
| Time horizon | Present detects deviation from baseline | Historical matches current state to past incidents |
| Output | Alert or flagged metric | Identified RCA + proposed or automated fix |
| Human involvement needed | High (engineer must interpret the anomaly) | Low to zero (system proposes or applies resolution) |
| Improves over time | Only if baselines are updated | Yes more incident history = faster future resolution |
Anomaly detection (AI-powered, across applications, infrastructure, and logs) flags deviations from baseline that may not have a static threshold alert configured. This feeds into the pattern matching layer, which checks whether the anomaly matches a known incident signature and what the resolution was. The combination means Middleware catches both novel issues (anomaly detection) and repeat issues (pattern matching) and handles the two very differently.
Anomaly detection on its own is still reactive: it tells you something unusual is happening. Pattern-based prevention is proactive: it tells you this specific unusual thing has happened before, here is why, and here is what to do. That distinction determines whether your engineers are fighting fires or preventing them.
Incident memory: the core engine of proactive automated incident response
Incident memory is the core architectural advantage of an AI SRE agent over a traditional alerting system. Each incident OpsAI investigates and resolves becomes part of a growing knowledge base that makes every future investigation faster.
The mechanism works as follows:
Incident fingerprinting. When OpsAI resolves an incident, it generates a fingerprint: a structured representation of the log pattern, error type, affected services, infrastructure state, and timeline that characterized the event. The fingerprint captures the structural signature of the failure not just the exact error message, so it can match variations of the same underlying issue.
Similarity matching. When a new incident is grouped, OpsAI computes similarity scores against stored fingerprints. Matching dimensions include log pattern structure, service topology, pre-incident metric trajectories, and time-of-day characteristics. High-confidence matches surface the historical incident as the primary context for the current investigation.
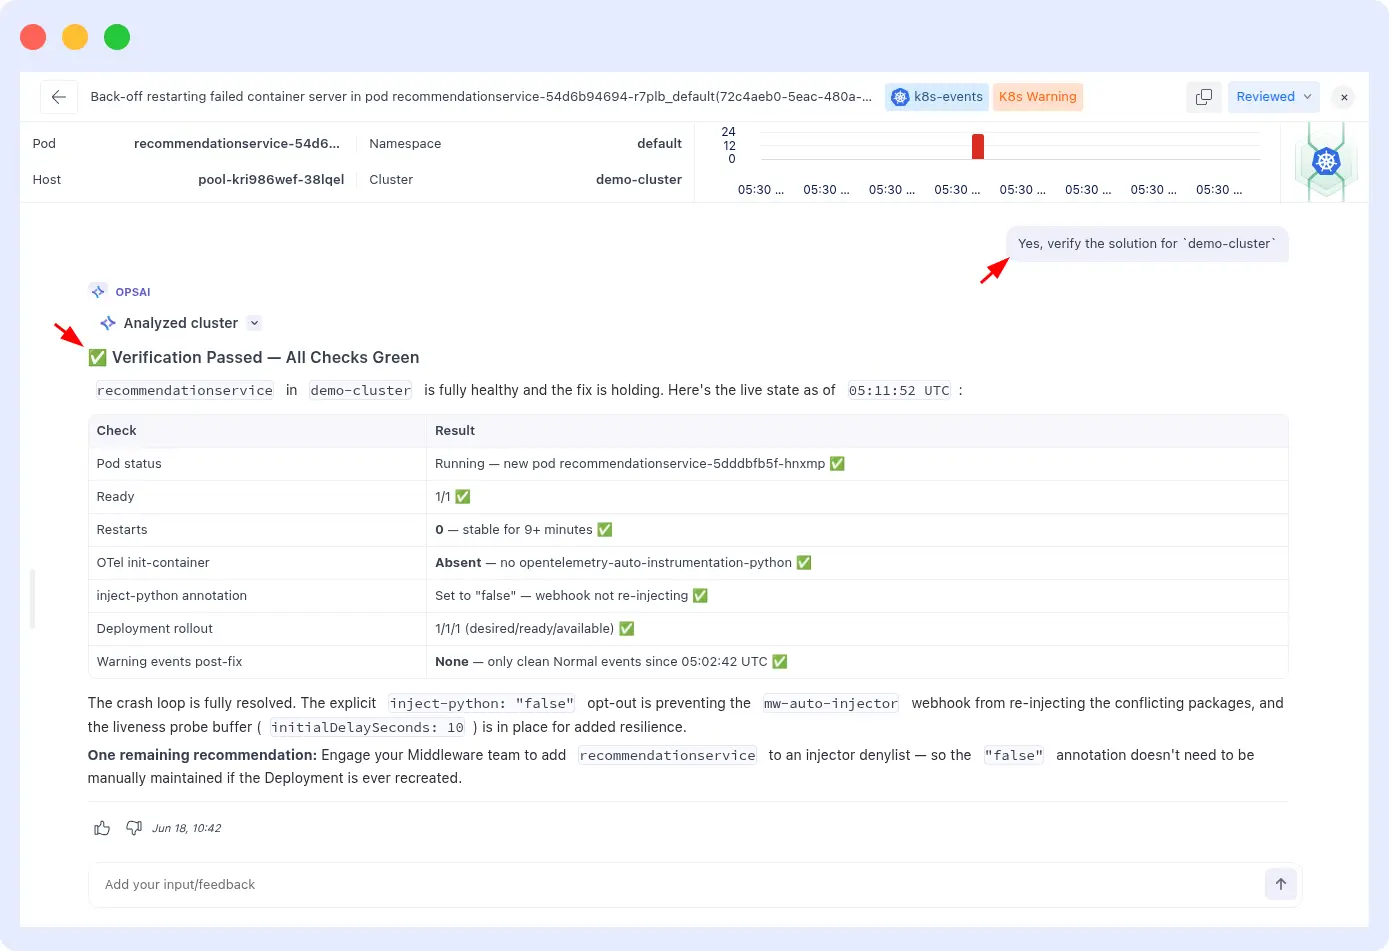
Historical context retrieval. On a pattern match, the full RCA from the previous incident is automatically retrieved: what broke, what the causal chain was, what fix was applied, and whether the fix was effective. Engineers reviewing the finding receive a concluded hypothesis backed by historical evidence not a raw alert requiring re-investigation from scratch.
Resolution reuse. For Kubernetes incidents in Auto Fix mode, OpsAI can apply the previously validated fix directly on recurrence. For application code issues, it opens a pull request against the updated codebase using the same fix logic as the previous resolution. Resolution time drops from minutes to seconds. For high-frequency repeat patterns, this can effectively stop an entire class of incidents permanently after the first occurrence.
How this builds over time
The incident memory builds automatically as OpsAI investigates and resolves incidents. You do not configure it or maintain it. The practical effect: the first occurrence of any incident type may take 2–3 minutes to investigate. The second occurrence matches in under a minute. By the third or fourth occurrence, OpsAI can often intervene before the incident crosses the alert threshold at all.
This is what “proactive automated incident response” actually means in practice not just faster reaction, but fewer incidents escalating in the first place.
Real scenarios: what automated incident response looks like in practice
Scenario 1: Weekly cron job failure
A data export cron job fails every Sunday night when the database runs a scheduled backup simultaneously. The symptoms are a timeout in the export service and a flood of downstream errors. With traditional monitoring, an engineer gets paged, spends 45 minutes correlating the export logs with the database backup schedule, and writes a post-mortem recommending staggering the jobs. The following Sunday, whoever is on call starts from scratch because no one read the post-mortem.
With OpsAI: on the first occurrence, OpsAI runs automated root cause analysis, correlates the export service timeout with the backup job activity in infrastructure logs, identifies the overlap as the root cause, and surfaces a remediation recommendation. On the second Sunday, OpsAI recognizes the log pattern emerging from the export service as the cron window approaches. It matches the fingerprint, retrieves the previous RCA, and surfaces the finding proactively. The on-call engineer sees a resolved context not a raw alert before the job fails.
Scenario 2: OOMKilled container in a loop
A Kubernetes pod handling image processing keeps getting OOMKilled on high-traffic periods.
Kubernetes restarts it each time with the same memory limit, so it dies again. This can repeat hundreds of times before a human notices the pattern in the pod restart count.
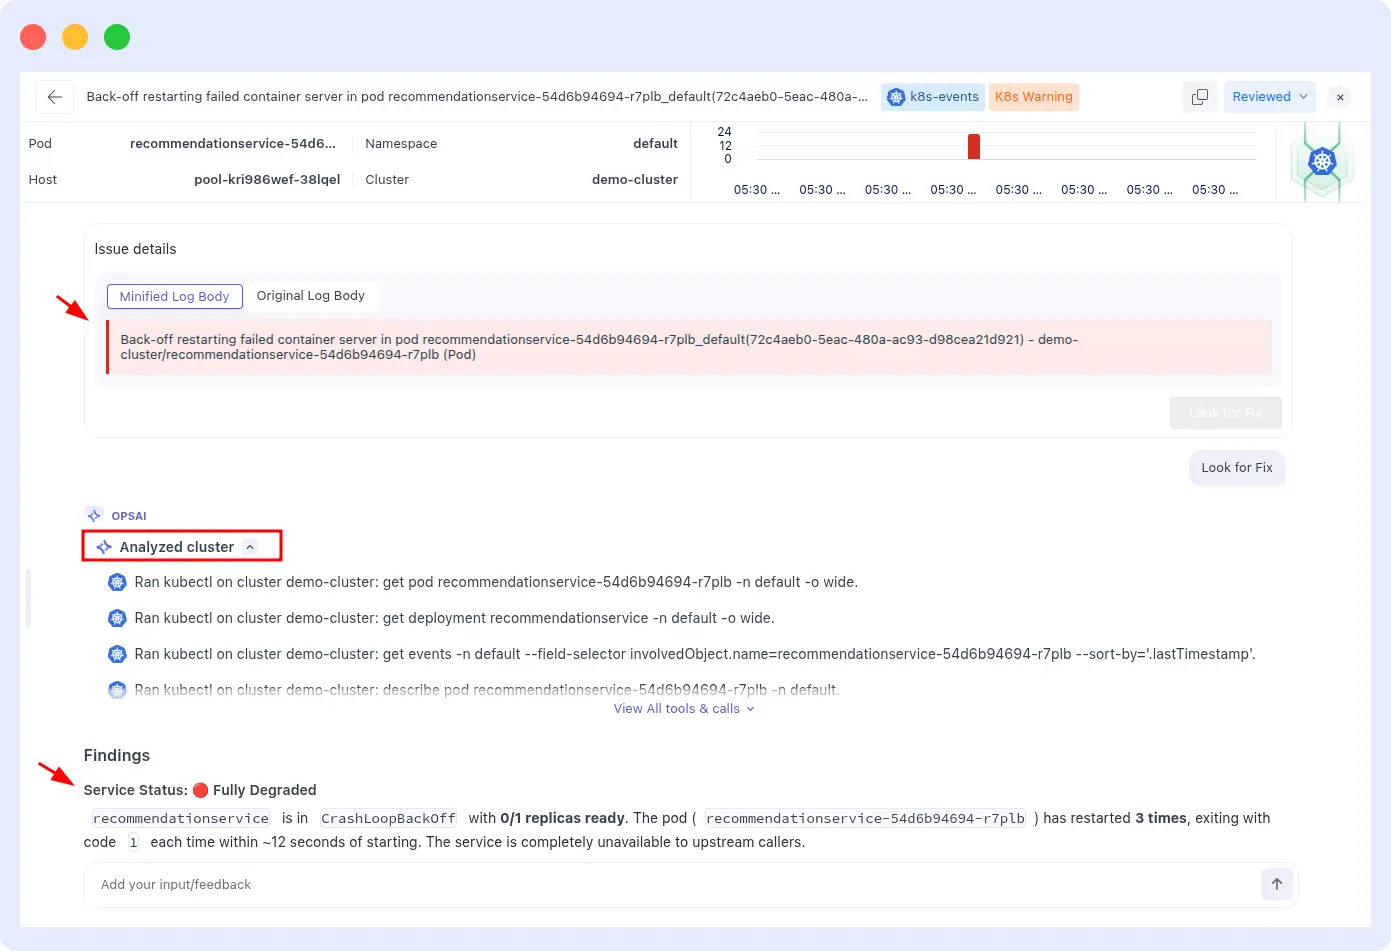
With OpsAI in Auto Fix mode: on the first OOMKill event, OpsAI detects the kill signal in the container logs, cross-references it with the pod’s actual P99 memory usage data, calculates a corrected memory limit using real usage plus a 30% headroom buffer, and patches the deployment directly.
On subsequent traffic spikes, the pod no longer exceeds its limit. The loop stops after the first occurrence. For a detailed walk-through of this specific pattern, see the Kubernetes pod crash auto-remediation guide.
Scenario 3: API regression that appears every deployment
A checkout API endpoint regresses on every third deployment because a specific input validation path is broken by a recurring pattern in how a particular developer team formats their pull requests. The error surfaces as a 500 in APM traces.
With OpsAI: after the second occurrence, the pattern is fingerprinted same service, same error type, same stack frame, correlated with deployment events.
When the next deployment triggers the same APM error, OpsAI matches the fingerprint within seconds, retrieves the fix from the previous PR, and opens a new pull request against the updated codebase with a targeted correction. The time from detection to PR open is under 3 minutes. The engineer reviewing the PR sees full context from the two previous incidents.
How to enable OpsAI pattern detection
OpsAI pattern detection is not a separate feature to configure it is part of the core OpsAI investigation engine and activates automatically once OpsAI is set up. Here is the fastest path for each environment.
Kubernetes (fastest path)
Install the Middleware Kube Agent with OpsAI enabled:
helm repo add middleware-labs https://helm.middleware.io

helm install mw-agent middleware-labs/mw-kube-agent-v3 \

  --set global.mw.apiKey=<MW_API_KEY> \

  --set global.mw.target=<MW_TARGET_URL> \

  --set opsai.enabled=true \

  --set global.clusterMetadata.name=<CLUSTER_NAME> \

  --set mw-autoinstrumentation.enabled=true \

  -n mw-agent-ns --create-namespace
Once installed, OpsAI monitors Kubernetes events and pod logs automatically. You choose between Auto RCA (OpsAI suggests fixes for your review) and Auto Fix (OpsAI applies fixes directly recommended for staging, optional for production).
Application errors via APM and RUM
- Install the Middleware APM SDK for your language (Python, Node.js, Go, Java, Next.js) and add the RUM JavaScript snippet to your frontend.
Connect your GitHub or Bitbucket repository via the GitHub MCP integration in Middleware settings. Set these build-time environment variables in your CI pipeline:
MW_VCS_REPOSITORY_URL=<your repository URL>

MW_VCS_COMMIT_SHA=<commit SHA>- OpsAI begins monitoring APM traces and RUM sessions immediately. When a pattern match is found, it surfaces findings in the OpsAI panel and opens a pull request.
Importing Vercel’s Error/Fatal typed log Sources
Path: Installation > Integration > Vercel
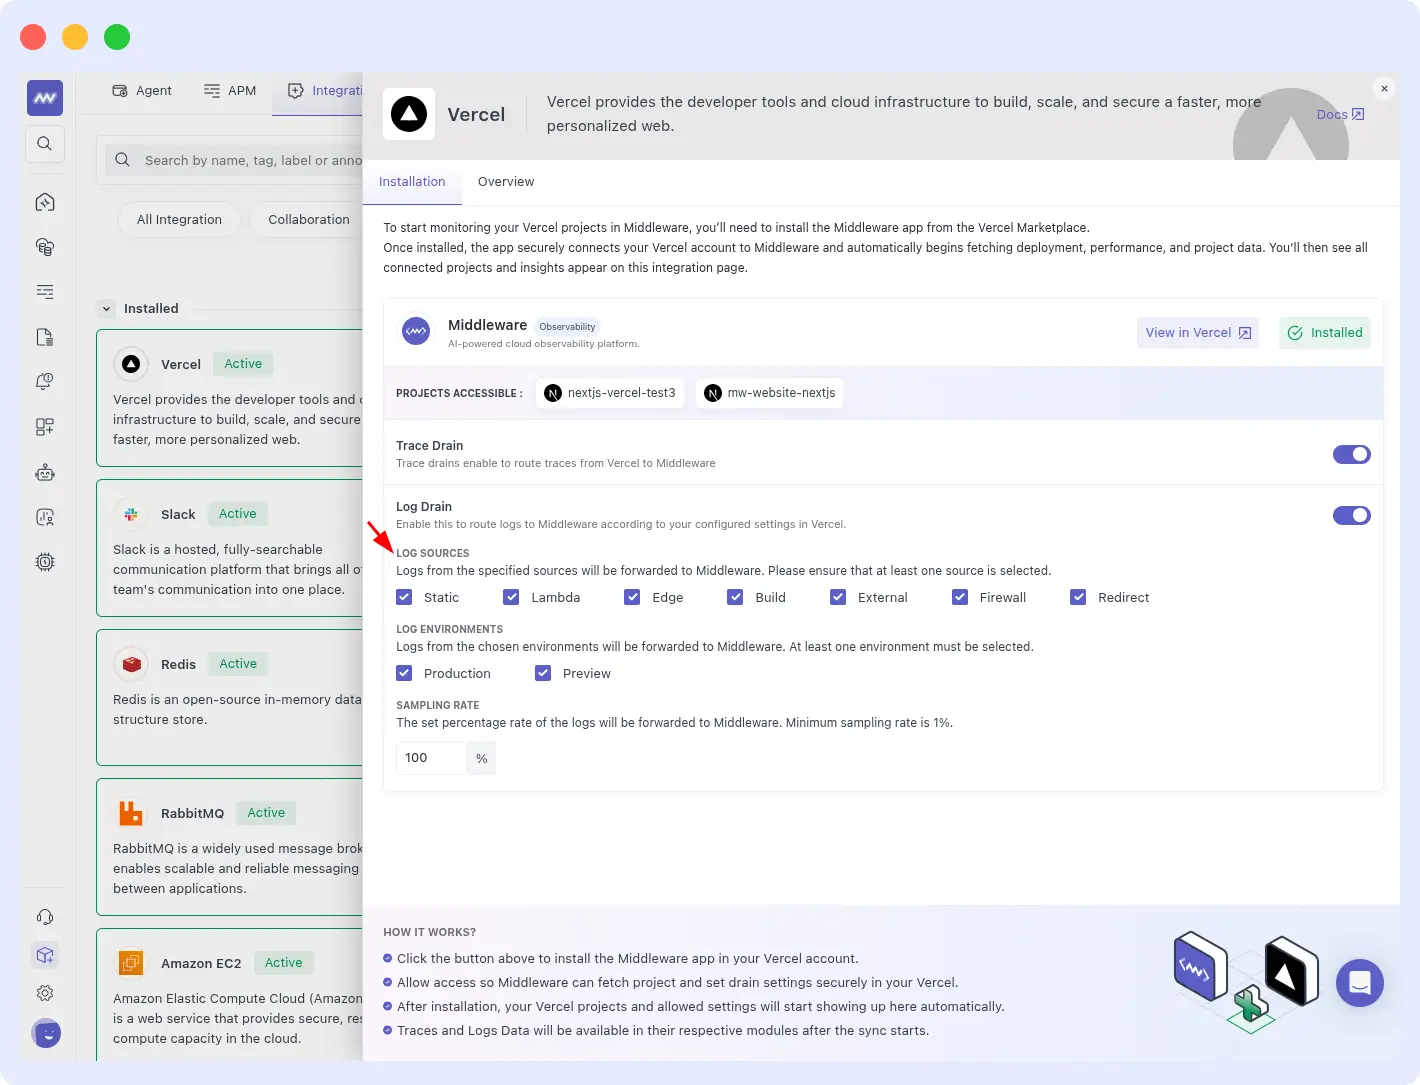
OpsAI ingests Error and Fatal severity logs from all supported Vercel log sources, including Static, Lambda, Edge, Build, External, Firewall, and Redirect logs. These high-priority runtime and deployment errors are automatically grouped into related incidents using pattern detection and historical context analysis.
By correlating Vercel logs with traces, metrics, and previous incidents, OpsAI can quickly identify recurring issues, perform root cause analysis, and recommend or execute remediation actions through Auto Fix.
Enabling native alert ingestion
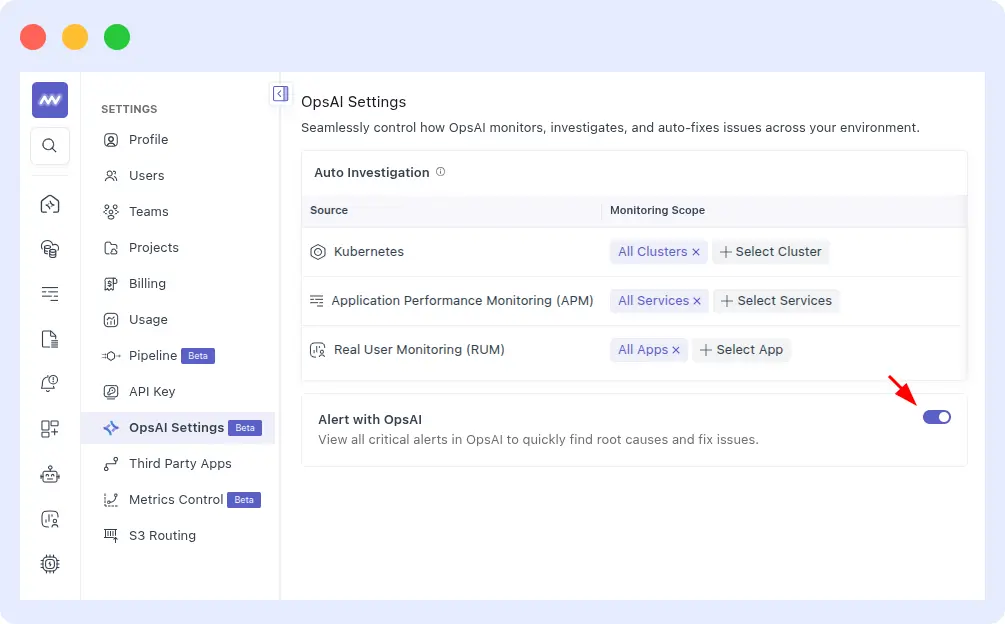
To feed Middleware’s own alert monitors into OpsAI pattern detection, go to Settings > OpsAI Setting and enable the Alert Ingestions toggle. OpsAI will automatically ingest critical alerts from the last minute and run investigations.
Connecting Datadog or Grafana alerts
If you are already using Datadog or Grafana, you do not need to migrate. Connect Datadog or Grafana via the integrations panel. OpsAI ingests their alerts and runs investigations using their metrics, logs, and traces all surfaced inside Middleware without duplicating your existing setup.
For a full setup walk-through, see the OpsAI documentation.
Stop reacting to outages. Start preventing them.
Every repeat incident your team investigates is time that could be spent shipping features. OpsAI’s automated incident response platform combining pattern detection incident memory, proactive RCA, and auto-remediation is designed to make repeat incidents a one-time event: resolved permanently on first recurrence, not rediscovered on the third.
Start a free trial. OpsAI activates automatically once your APM, RUM, or Kubernetes agent is connected. No credit card required.
Already using Middleware? Go to Settings > OpsAI Setting to enable alert ingestion and see your first pattern-matched incident in the findings panel.
FAQs
How can I detect if the same type of incident keeps repeating in my production system?
OpsAI automatically groups incidents by error signature and tracks recurrence across your APM traces, logs, and Kubernetes events. When the same pattern appears more than once, OpsAI matches it to the historical incident and surfaces the match in the findings panel. You do not need to manually query logs or compare post-mortems the pattern matching runs continuously in the background.
What is automated incident response and how is it different from alert routing tools?
Automated incident response covers the full incident lifecycle: detection, investigation, root cause analysis, remediation, and prevention. Alert routing tools like PagerDuty automate the escalation step but still require engineers to investigate and determine what to fix. AI-powered automated incident response the kind OpsAI provides automates the investigation and RCA steps as well, so engineers receive a concluded finding with a proposed or applied fix, not a raw alert to interpret.
What is log pattern analysis and how does it help prevent repeat outages?
Log pattern analysis identifies recurring structural sequences in your log output and correlates them with infrastructure and application events. OpsAI uses it to fingerprint the log conditions that precede an outage so that when those conditions appear again even before an alert threshold is crossed it can act on historical context rather than starting from zero. The result is faster RCA on first occurrence and near-instant resolution on repeats.
Can AI identify that a cron job will fail before it actually fails again?
Yes, with enough incident history. OpsAI tracks time-of-day patterns and log sequences. If a cron job failure has a recognizable pre-failure log signature and most do OpsAI can detect that signature forming during the next cron window and intervene before the job fails. This works particularly well for resource-contention-driven failures where the memory or CPU trend is visible minutes before the crash.
Why do we keep having the same outage every week and how do I stop it permanently?
Repeat outages happen because traditional monitoring has no incident memory. Alerts fire, engineers investigate, systems recover, and the pattern is discarded. OpsAI retains the pattern, matches it on recurrence, and either applies the fix automatically (Kubernetes) or opens a pull request with the exact code change needed (APM/RUM). Permanent resolution requires both: recognizing the repeat and shipping the fix through code rather than just restarting the pod.
What data should I use to detect that an incident is about to repeat?
The strongest signals are: log sequence patterns from the affected service, infrastructure metric trajectories (memory growth rate, CPU sustained above threshold), APM error rate trends on dependent services, and Kubernetes event sequences (pending → evicted). OpsAI ingests all of these simultaneously through Middleware’s unified observability platform, which is why cross-signal correlation is significantly faster than stitching together data from separate tools.
Does OpsAI work if I already use Datadog or Grafana?
Yes. OpsAI ingests alerts from both Datadog and Grafana, runs investigations using their metrics, logs, and traces, and surfaces findings inside Middleware. You do not need to replace your existing monitoring stack to use OpsAI; it works alongside it.