Your Node.js application works perfectly during normal conditions, but tends to be slow when there’s an increase in user traffic. It might experience delays in request processing and system crashes. This unexpected situation always happens.
High traffic transforms minor system issues, such as memory leaks, slow database operations, and unhandled errors, into major system problems. Your main priority should be how to prevent errors during this period.
Application Performance Monitoring (APM) tools like Middleware become essential at this point. It allows you to detect problems before users start complaining or the application fails. APM tools display both the source of the issues and their causes, together with their exact locations.
Why Node.js Apps Fail at Scale
Node.js apps are known for speed and lightness. It’s also great for handling many requests at once. Developers prefer Node.js for developing APIs alongside real-time applications and backend services due to its performance. However, this doesn’t stop it from slowing down or crashing when traffic levels rise.
Common Causes of Errors in High-Traffic Node.js Apps
A lot of traffic can strain your Node.js application. The following are some typical problems that lead to errors:
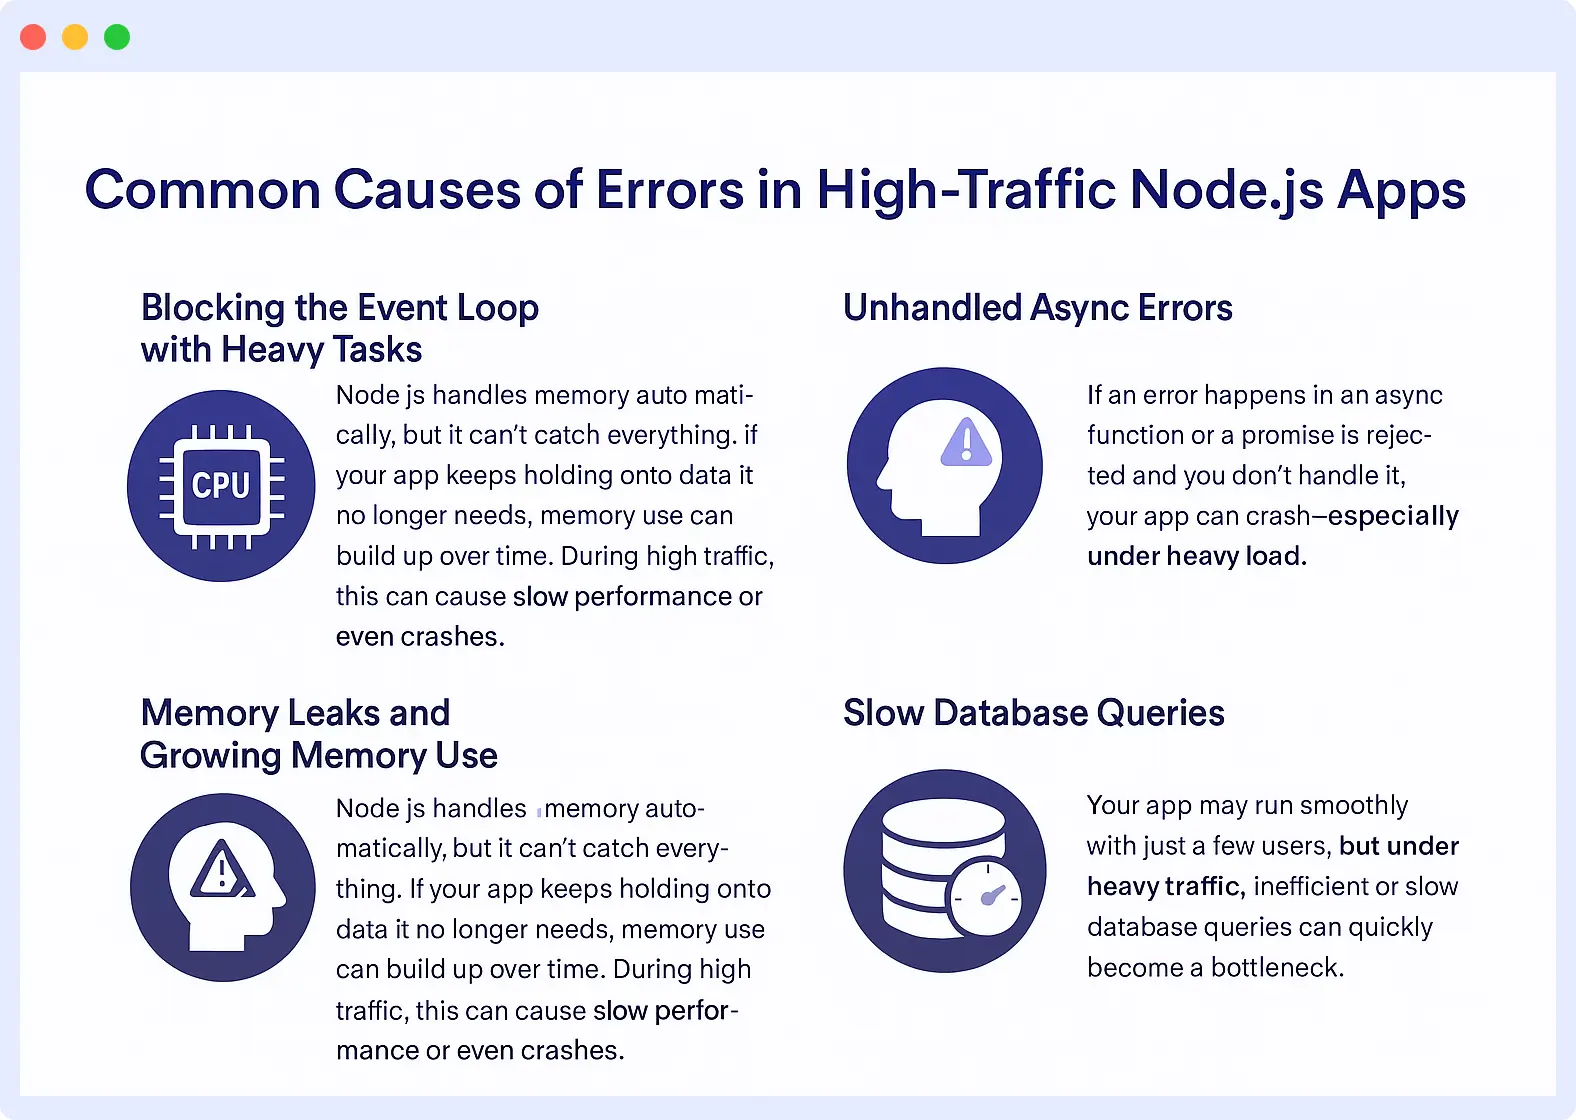
- Using Heavy Tasks to Block the Event Loop: Node.js operates on a single thread. Therefore, your app may slow down when it performs heavy tasks like processing large files or resizing images by blocking the event loop.
- External services that cause I/O latency: Apps use other services, including payment providers and third-party APIs, and Node.js applications follow this pattern. All connected services impact the entire application because one operational problem in any service affects it.
- Memory Leaks and Unmanaged Growth: Node.js handles memory management but fails to identify all potential memory issues. The memory consumption of your application will keep increasing as it stores data that the system no longer needs.
- Uncaught Async/Promise Errors: Node.js relies heavily on asynchronous code. It supports two main ways to handle Promises, which include
async/awaitor.then()and.catch()methods.
app.get('/users, async (req, res, next) => {
  try {
    const users = await fetchUsers();
    res.json(users);
  } catch (err) {
    next(err); // Passes error to error handler middleware
  }
});
Your application will crash when a promise remains unattended in its rejection state.
- Synchronous Code in Busy Areas: If your app uses blocking
(sync)code where it handles requests, it can hold everything up. In high-traffic situations, this might freeze the server and delay responses. - Lack of Real-Time Observability: You can’t fix what you can’t see. Without observing your app in real-time, minor issues can go unnoticed until users start complaining, or worse, the app crashes. At high traffic, problems happen faster and increase quickly.
- Lack of Efficient Database Queries: Your application functions properly with a small number of users, but database queries become inefficient when traffic grows, which creates major performance issues.
- Failures from third-party APIs: In most cases, your app depends on third-party services for payments, emails, geolocation, etc. If these services fail and you don’t act fast, your app will likely crash too. So, you need to handle errors properly to avoid such damage.
To understand why this happens and how to fix it, check out this guide on solving app performance issues.
Detect and Fix Issues in Real-Time with Middleware APM
The amount of time needed to identify errors directly impacts the number of affected users and makes root cause identification progressively more difficult. Struggling with Node.js Performance in Production? Try This Fix
Middleware APM allows users to maintain priority over problems through its real-time monitoring of application health. It delivers essential context alongside automated tools that help you identify problems early.
Here’s a simple Node.js app we’ll be using as a guide:
const express = require('express');
const app = express();
const PORT = process.env.PORT || 3000;
app.get('/', (req, res) => {
  res.send('Hello, Middleware APM!');
});
app.get('/error', function (req, res) {
    try{
        throw new Error('oh error!');
    }catch (e) {
        console.error(e)
    }
    res.status(500).send("wrong");
});
app.listen(PORT, () => {
  console.log(`Server running at http://localhost:${PORT}`);
});
Let’s integrate Middleware for real-time monitoring. Install Middleware agent in your application by running the command:
The next step is to initialize Middleware in your project:
const tracker = require('@middleware.io/node-apm');
tracker.track({  serviceName: "your-service-name",  accessToken: "YOUR_MIDDLEWARE_API_KEY",  target: "https://ccang.middleware.io",});
Once you’re done, you can start your server.
Take note:
- Your “serviceName” is used to identify your application or service within the Middleware monitoring system.
- The “accessToken” is the unique identifier that links your Node.js app to your Middleware account for secure data reporting.
- Finally, the “target” property specifies the URL endpoint where your Middleware APM agent sends the collected telemetry data (metrics, traces, logs).
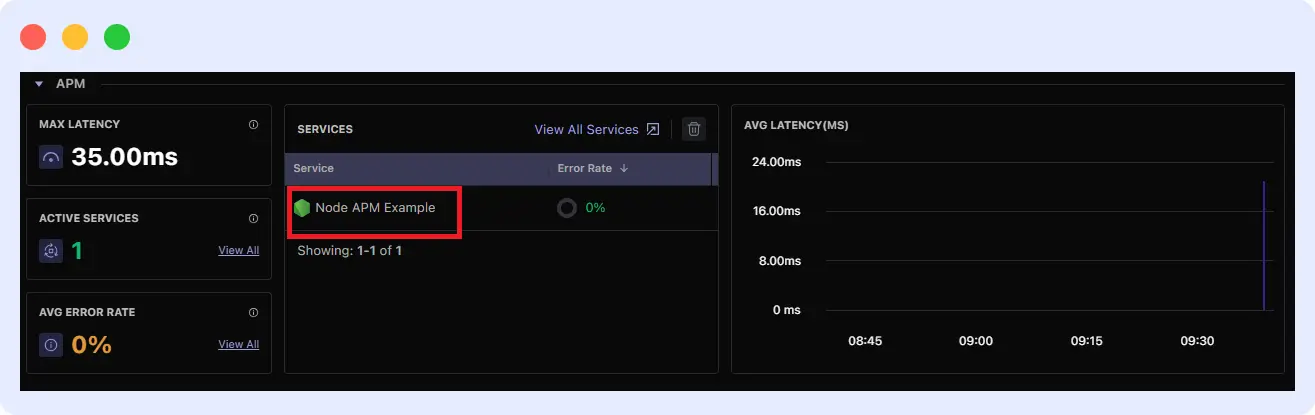
Real-Time Error Detection and Intelligent Alerting
When you set up Middleware correctly, it starts automatically monitoring your application for errors and performance problems while handling incoming requests.
Middleware’s APM will capture errors like:
- Uncaught exceptions
- Unhandled Promise rejections
- HTTP error responses (like 400 and 500)
- Timeouts and failed calls to external services
Here’s how Middleware’s APM handles an uncaught exception in a route.
app.get('/user', (req, res) => {
  const userId = req.query.id;
  if (!userId) {
    throw new Error('Missing user ID');
  }
  res.send(`User ID is ${userId}`);
});
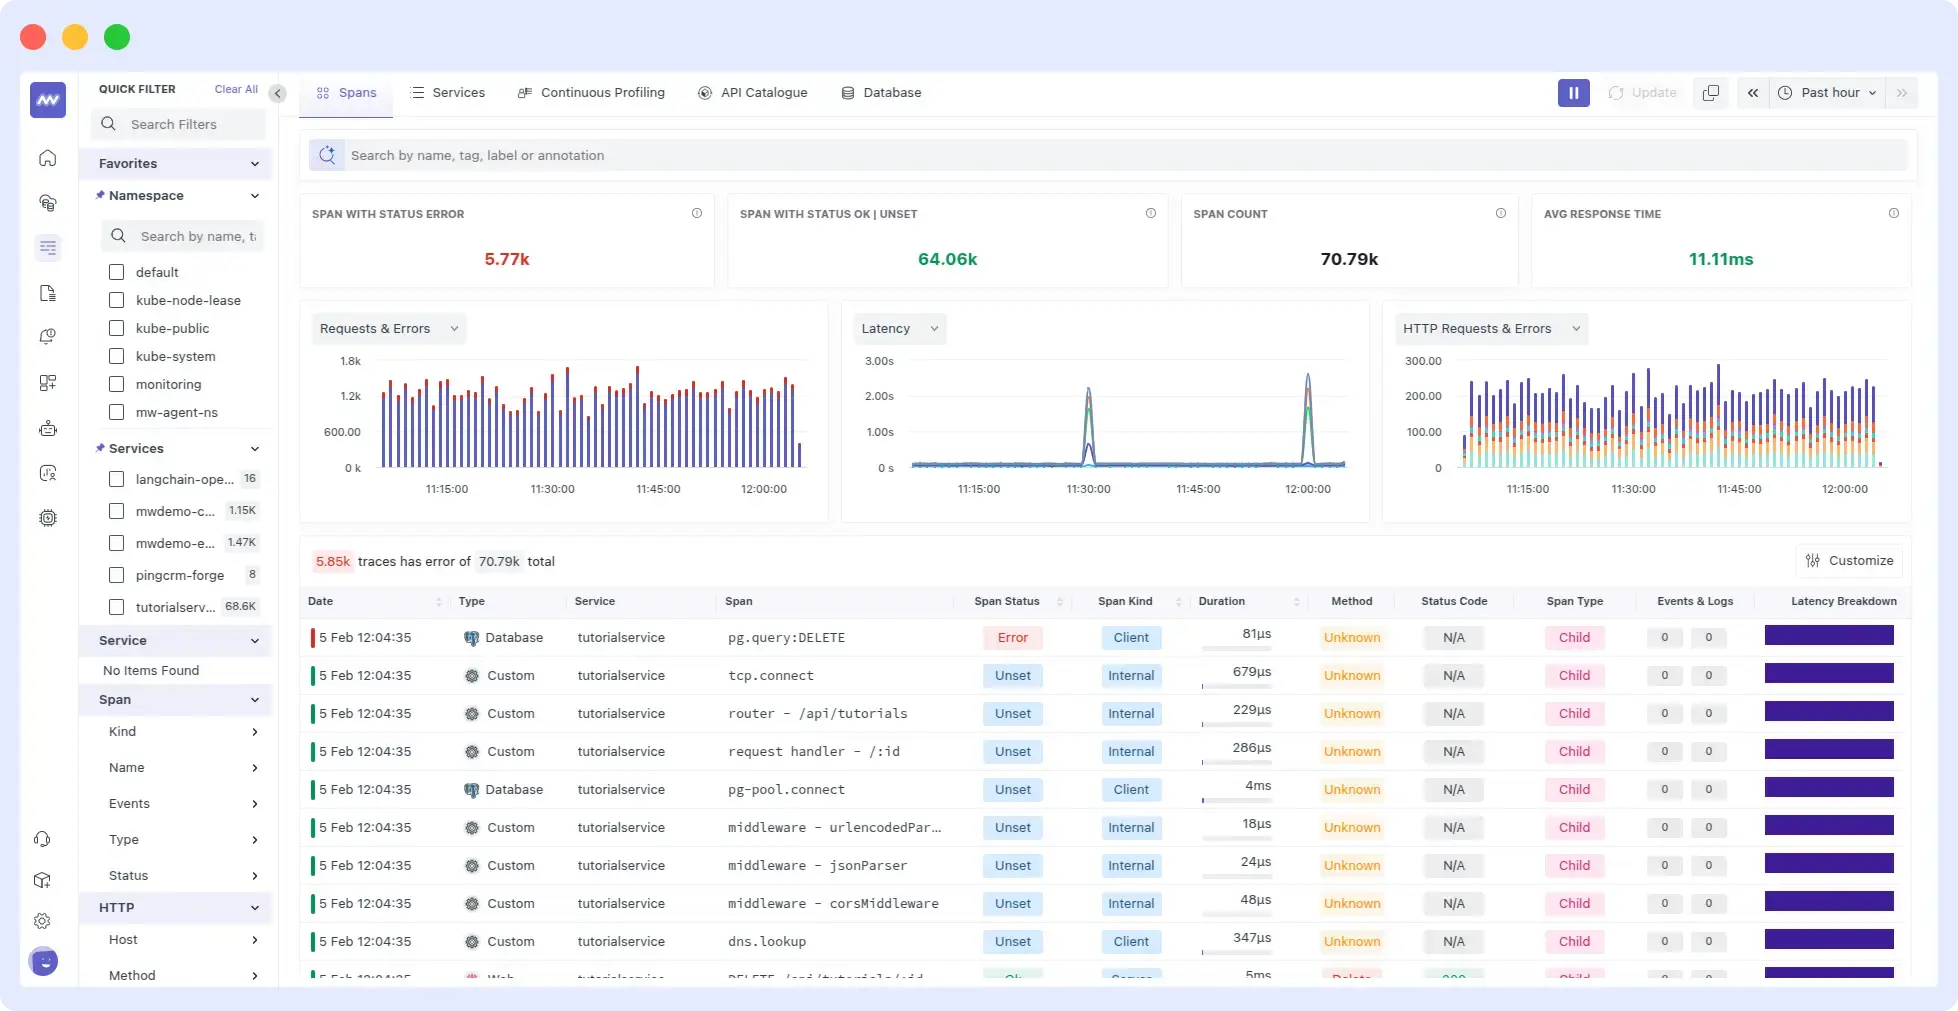
The application demonstrates an express route that generates an error when any query parameter is missing. When a user attempts to reach /user without providing an ID, Middleware instantly detects this exception while presenting the complete error information.
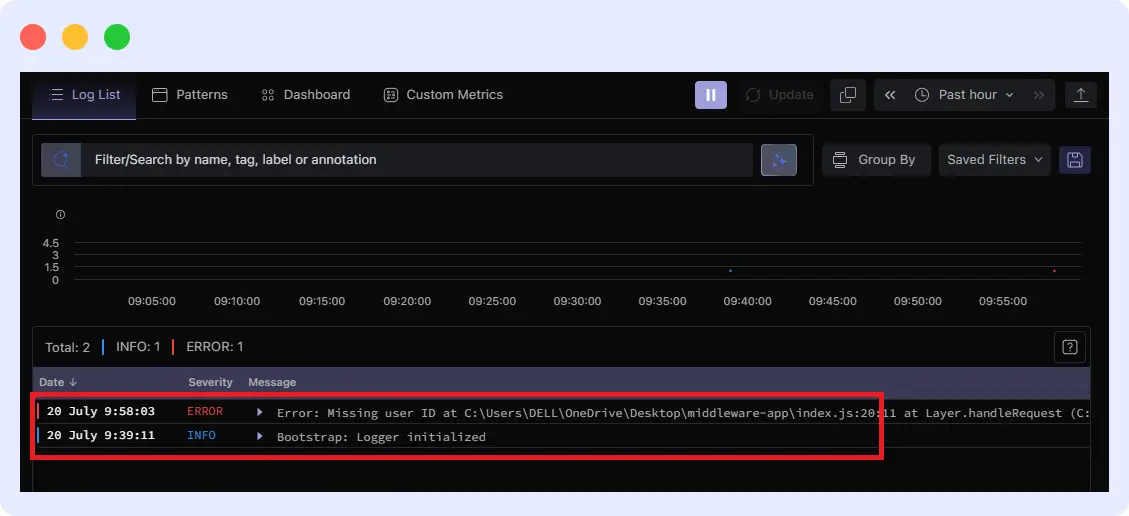
Each error has a date, severity, and an error message. You can see the first error message saying, “missing user ID…”. You can click for more information.
Another interesting thing about Middleware is how it handles alerts. Not every error deserves immediate attention. Middleware detects error patterns, filters the most critical ones, and then sends an alert.
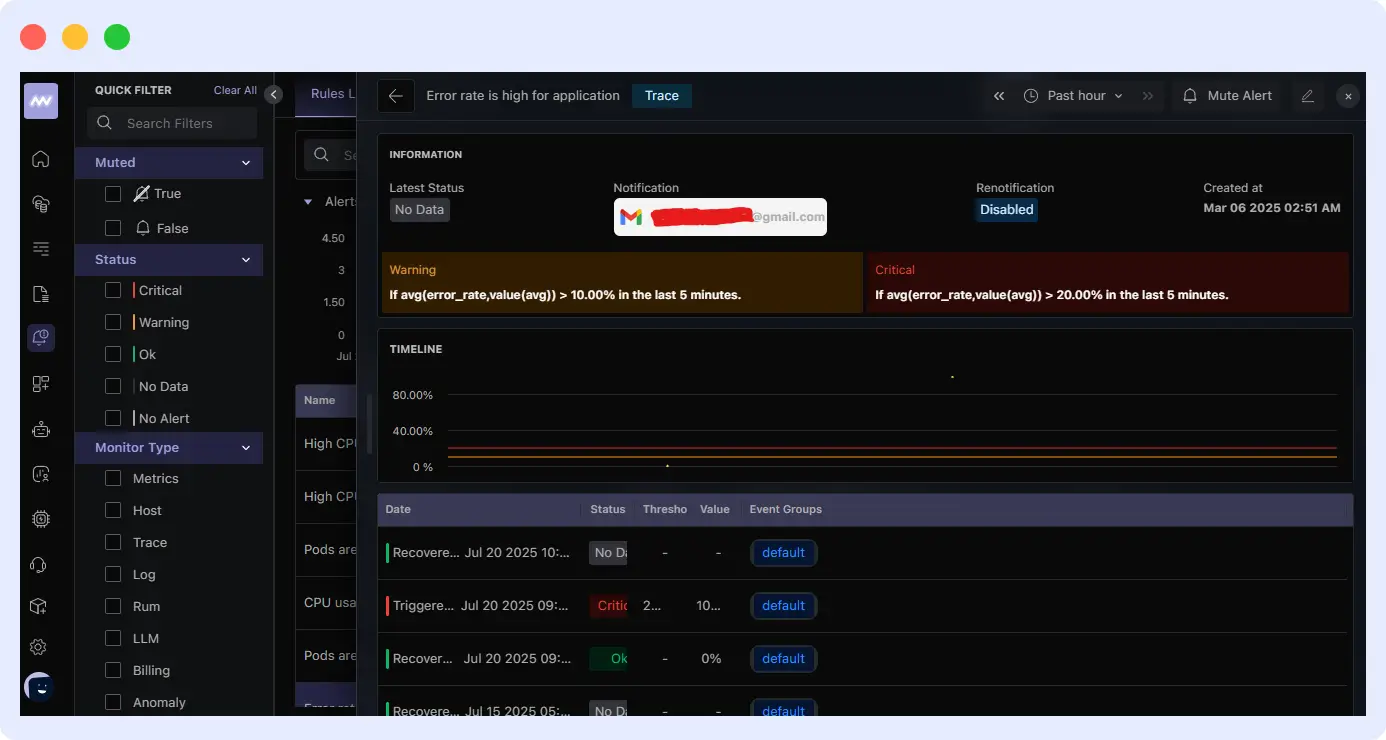
It sends the alert to your email or any custom notification medium, such as Slack, Teams, etc. The alert comes with the error details or related performance metrics. With this, you won’t have to guess or dig through logs when there’s a problem.
Context-Rich Tracing and Code Profiling
Identifying errors in Node.js apps is challenging, especially during periods of high traffic. However, Middleware APM helps you identify these errors, together with the causes and performance issues, by providing:
- Distributed tracing request
- Continuous code profiling
- Dependency and service breakdowns
- Automated root cause analysis with OpsAI
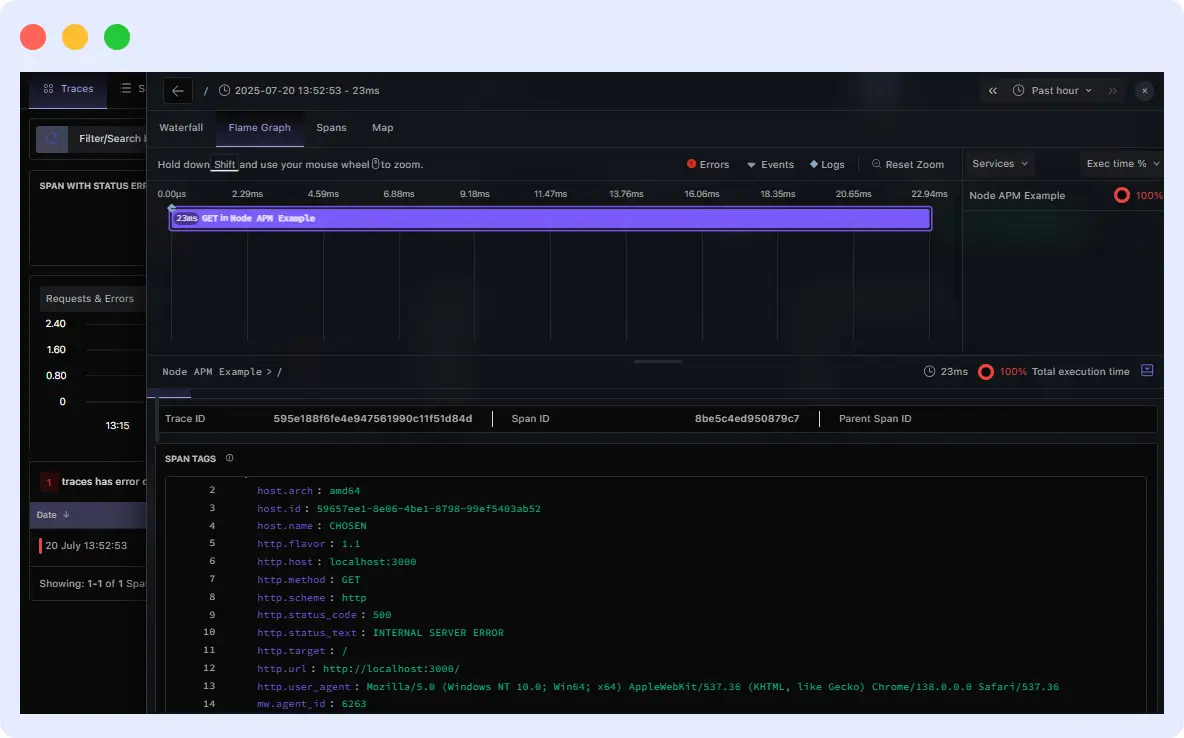
For example:
“res” is missing in the function, so sending it triggers the function to throw an error. When this error occurs, Middleware captures it to show execution time along with the error source, route, and other additional details.
Auto-Remediation with OpsAI
Even with real-time monitoring, high-traffic Node.js apps will still have issues that require immediate attention, like memory leaks, stuck processes, or deployment regressions.
- Without Middleware, the app slows down or crashes, and you’ll start digging through logs or metrics to know what happened, maybe after users report the outage.
- With Middleware, it spots an increase in memory usage and instantly restarts the compromised worker before it crashes. It sends an alert with relevant details and logs the event in your dashboard so you can see what’s going on.
This is where everything becomes more interesting. You can also integrate OpsAI with your GitHub repository, enabling it to monitor and highlight routes and functions with issues, suggest fixes, and auto-generate a pull request to resolve the problem.
🔗 One GitHub connection = zero guesswork.
Let OpsAI monitor your code, spot issues, and open PRs while you build.
Key Metrics That Matter in Reducing Errors
There are key metrics you should track to get information about your app’s behavior so you can detect issues on time. They include:
- Latency: Latency measures the duration between user requests and the time the app responds. Users experience normal and worst-case scenarios through average response times and p95 and p99 percentiles analysis.
- Throughput: Measures the number of requests your application processes in a second. This aids in identifying issues where requests are dropped or delayed, as well as traffic spikes.
- Error Rate: Indicates the percentage of requests that fail to execute. You can identify application problem areas through the Middleware, which divides errors into overall and endpoint-specific errors.
- Resource Utilization: Include important system metrics like event loop lag, CPU usage, and memory consumption. Event loop lag measures how long your app’s main thread is blocked, which directly affects responsiveness. High CPU or memory use can indicate inefficient code or leaks that lead to crashes.
- Custom Metrics: Allows you to track business-related metrics and essential application workflows such as checkout success rates and payment failures. Your organization can use user-defined metrics to monitor specific areas of your application that drive business success.
Learn more about Node.js performance monitoring best practices.
Ways to Prevent Bottlenecks and Deploy with Confidence
The APM insights of Middleware enable your team to practice good development habits that detect errors before deployment, which leads to safer and more reliable updates.
1. Proactive Error Handling & Circuit Breakers
Catch errors early in your code so they don’t cause bigger failures. Middleware’s real-time alerts can trigger fallbacks when services fail, letting your app continue working smoothly with backup options. Circuit breakers also help by stopping repeated calls to failing services. Middleware’s monitoring can automatically manage these circuit breakers based on live data, keeping your app stable under pressure.
2. Load Balancing & Clustering
Your Node.js application needs multiple instances for proper operation during times of high traffic. Tools such as PM2 and Node.js cluster mode enable you to distribute workload between CPU cores, thus enhancing both performance and reliability.
The APM capabilities of Middleware provide complete monitoring of complex environments by displaying performance data from each instance to help you detect problems immediately. This combined solution enables your application to scale efficiently.
🏦 MindOrigin, a FinTech leader, boosted performance across trading apps using Middleware.
📊 Read how they cut MTTR by 50% and improved uptime.
3. Optimized Database and Caching Layer
Most problems also come from the database and not the code. Poorly indexed queries, overused connections, or missing caches can quickly become an issue under load.
To prevent this, teams should:
- Use efficient indexing to speed up frequent queries
- Implement connection pooling to avoid exhausting DB connections
The APM features of Middleware show you which queries take the longest to execute, together with their execution frequency and their impact on overall latency measurement. With this information, you can improve slow queries and implement caching where needed.
4. Continuous Testing and APM Monitoring
The application requires continuous testing. Load and stress tests should be run periodically to replicate actual user traffic so performance problems can be identified before they reach end-users.
Middleware APM checks your application’s performance metrics, including response times and error rates, after every deployment. When the system detects irregularities or regressions, it sends immediate notifications to your team. Through continuous testing and real-time monitoring, you will discover problems at an early stage so you can deploy updates with assurance.
“I don’t want my developers to stay up all night to try to fix issues. That’s a waste of everyone’s time. Middleware helped us become faster. It saves at least one hour of my time every day, which I can dedicate to something else”
— Akshat Gupta, Trademarkia
Middleware: Your Partner in Error Reduction
You need the right tool if you want to reduce errors in your high-traffic Node.js app, and this is where Middleware helps you.
⚙️ Ready to keep your Node.js app fast and stable as it scales? Try Middleware APM now, proactive monitoring, instant insights, zero surprises.
From the moment you integrate Middleware into your project, it starts performing magic with no complicated setup. Here’s what it offers:
- Distributed Tracing: Tracks every request as it moves through your app and connected services. It makes it easy to know where slowdowns or failures start, even in complex systems.
- Code Profiling: Analyzes your code in real time to highlight slow functions and bottlenecks. It also helps you optimize performance by focusing on the most resource-intensive parts.
- Real-Time Dashboards: Visualize key metrics like latency, error rates, and resource usage. The dashboard enables you to monitor your application status in real time, which helps you detect problems as they occur.
- Anomaly Detection: Uses AI to spot unusual patterns or spikes in errors, latency, or resource use. The system detects problems in advance so the team can address them before they grow serious.
- Auto-Fixes with OpsAI: Automatically detects and solves common problems that include memory leaks and stuck processes. It can restart malfunctioning components while simultaneously offering suggestions that reduce system downtime and manual intervention needs.
With these features, Middleware acts as your always-on partner in error reduction, helping your Node.js app stay reliable and resilient under any load.
Conclusion
High-traffic Node.js applications need both suitable tools and proper strategies to reduce errors and maintain system stability. Middleware provides instant integration and intelligent automation to detect and resolve problems before their impact on end users.
Middleware’s APM solution can help you reduce your error rates so you can deploy with assurance.
Try out the free trial or view Middleware APM in action to discover its capabilities.
FAQs
What are Error Rates in a Node.js App?
Error rate shows the number of failed requests compared to the total requests. It enables you to track the occurrence of app failures that include crashes, server errors, and timeouts.
How does Middleware’s APM platform differ from other monitoring tools?
The platform provides real-time monitoring along with AI-based root cause detection and automatic fixes through a straightforward setup process and complete Node.js platform support.
What Metrics Should I Monitor with Middleware APM?
Monitor key metrics like latency, error rate, request throughput, CPU and memory usage, and any custom business metrics.
What are the Best Practices for Handling High Traffic in Node.js Apps?
You should implement try/catch blocks for asynchronous code as well as establish circuit breakers and use APM for real-time error monitoring.


