When your app crashes, you need answers fast. You need to know why it happened, how it happened, and how to fix it immediately. For years, Sentry has been the preferred solution for real-time error and performance tracking. It started as a small side project to catch bugs in code. Over time, it evolved into a comprehensive monitoring platform trusted by millions of developers worldwide.
However, no tool is perfect for every scenario. As your application scales, you might suddenly notice your bills increasing. Or perhaps you’re looking for specific features or integrations that Sentry simply doesn’t offer. That’s exactly why we’ve put together this list of the top Sentry alternatives to consider in 2026.
Why Look for an Alternative to Sentry?
Here are several reasons suggesting why one would want to look for an alternative to Sentry:
- Pricing: Sentry follows an event-based pricing which can become expensive as the application scales and lead to unexpected costs.
- Performance: Some developers have reported that Sentry’s SDK adds latency and eventually impacts high-speed applications.
- Limited observability: Sentry excels at error tracking. However, it lacks key monitoring features. These include distributed tracing and detailed performance analysis.
- Complex configuration: Configuring and maintaining Sentry for a larger-scale infrastructure is quite a task in itself. It becomes a headache if your team demands multiple customizations.
Top alternatives to Sentry
Now that you know what to look for while choosing an alternative to Sentry. Here’s our compilation of what options you can choose from:
1. Middleware
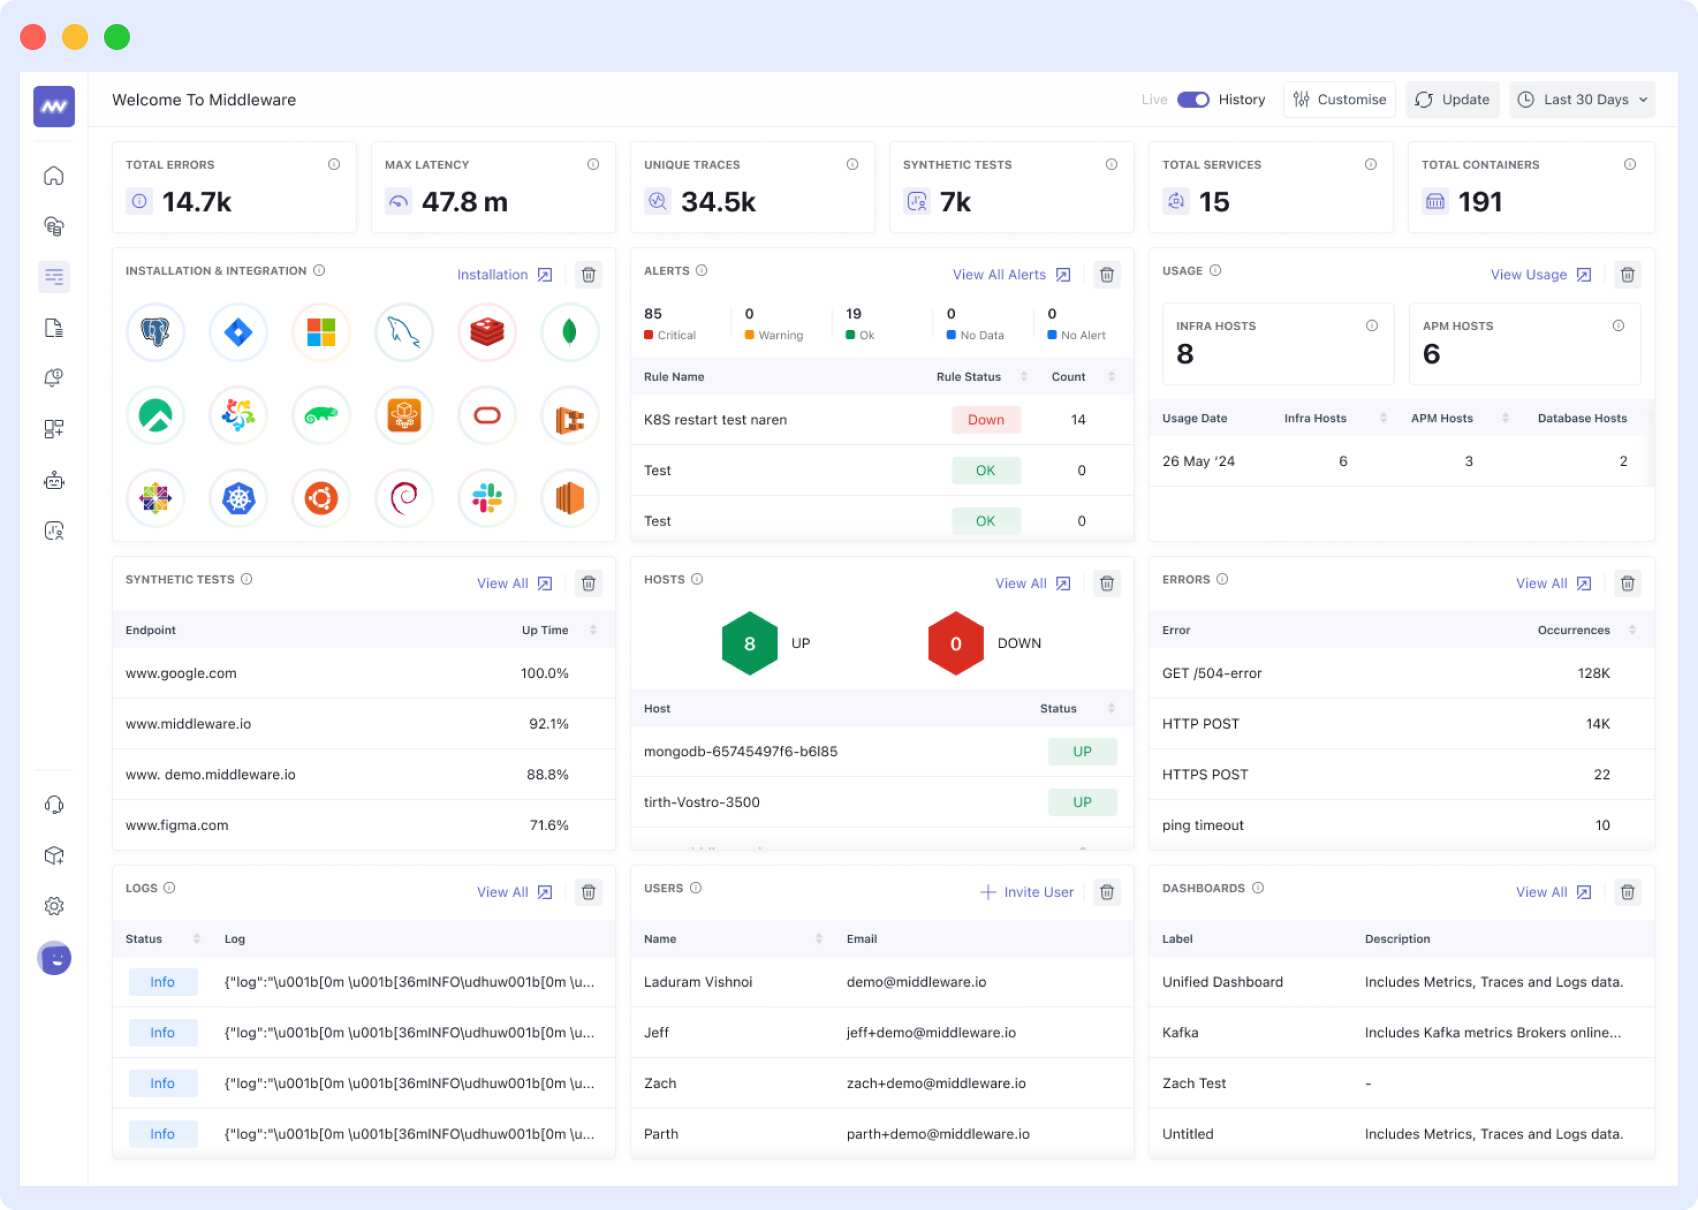
Middleware is the most cost-effective option on our list. It stands out as one of the best Sentry alternatives in 2026. It offers a complete observability suite compared to what you get with Sentry (focused on error tracking only). When an error pops up in Middleware, you don’t just see an error. But you are given a complete report suggesting reasons behind CPU spikes, recent deployments, and other important contextual information that Sentry can’t provide.
Key Features of Middleware:
- Automatic Error Detection and Alerting: Middleware automatically detects application errors across your stack and sends real-time alerts with detailed context, including stack traces, affected services, and performance impact, so you can troubleshoot issues faster and reduce downtime.
- Complete observability: This is Middleware’s most powerful feature. It offers full-stack monitoring with metrics, logs, and traces. All are available in a single dashboard.
- Real User Monitoring (RUM): Track user behavior in real time with session data.
- Synthetic monitoring: It can test site availability before a user encounters any issue.
- Data pipeline control: With Middleware, you can reduce costs by filtering the data at the source.
- OpenTelemetry support: Middleware supports the industry standard for instrumentation, so you have better compatibility compared to other tools.
Middleware Pricing:
- Free Tier: Includes up to 100GB of data per month. You also get 1,000 RUM sessions and 20,000 synthetic checks. The data has a 14-day retention period.
- Pay As You Go: Charges $0.30 per GB of data. RUM sessions cost $1 per 1,000. Synthetic checks cost $1 per 5,000. Data is retained for 30 days.
- Enterprise: A custom pricing model with volume discounts and dedicated support, along with on-premise deployment options.
Who Should Use Middleware?
Middleware tops the list of the best Sentry alternatives. It checks all the boxes for teams seeking a full-stack observability platform. You don’t need to spend on separate products for logs, metrics, and traces.
If you’re tired of context-switching between infrastructure monitoring tools, Middleware can help. It offers predictable pricing and strikes the right balance between capabilities and cost-effectiveness.
2. Datadog
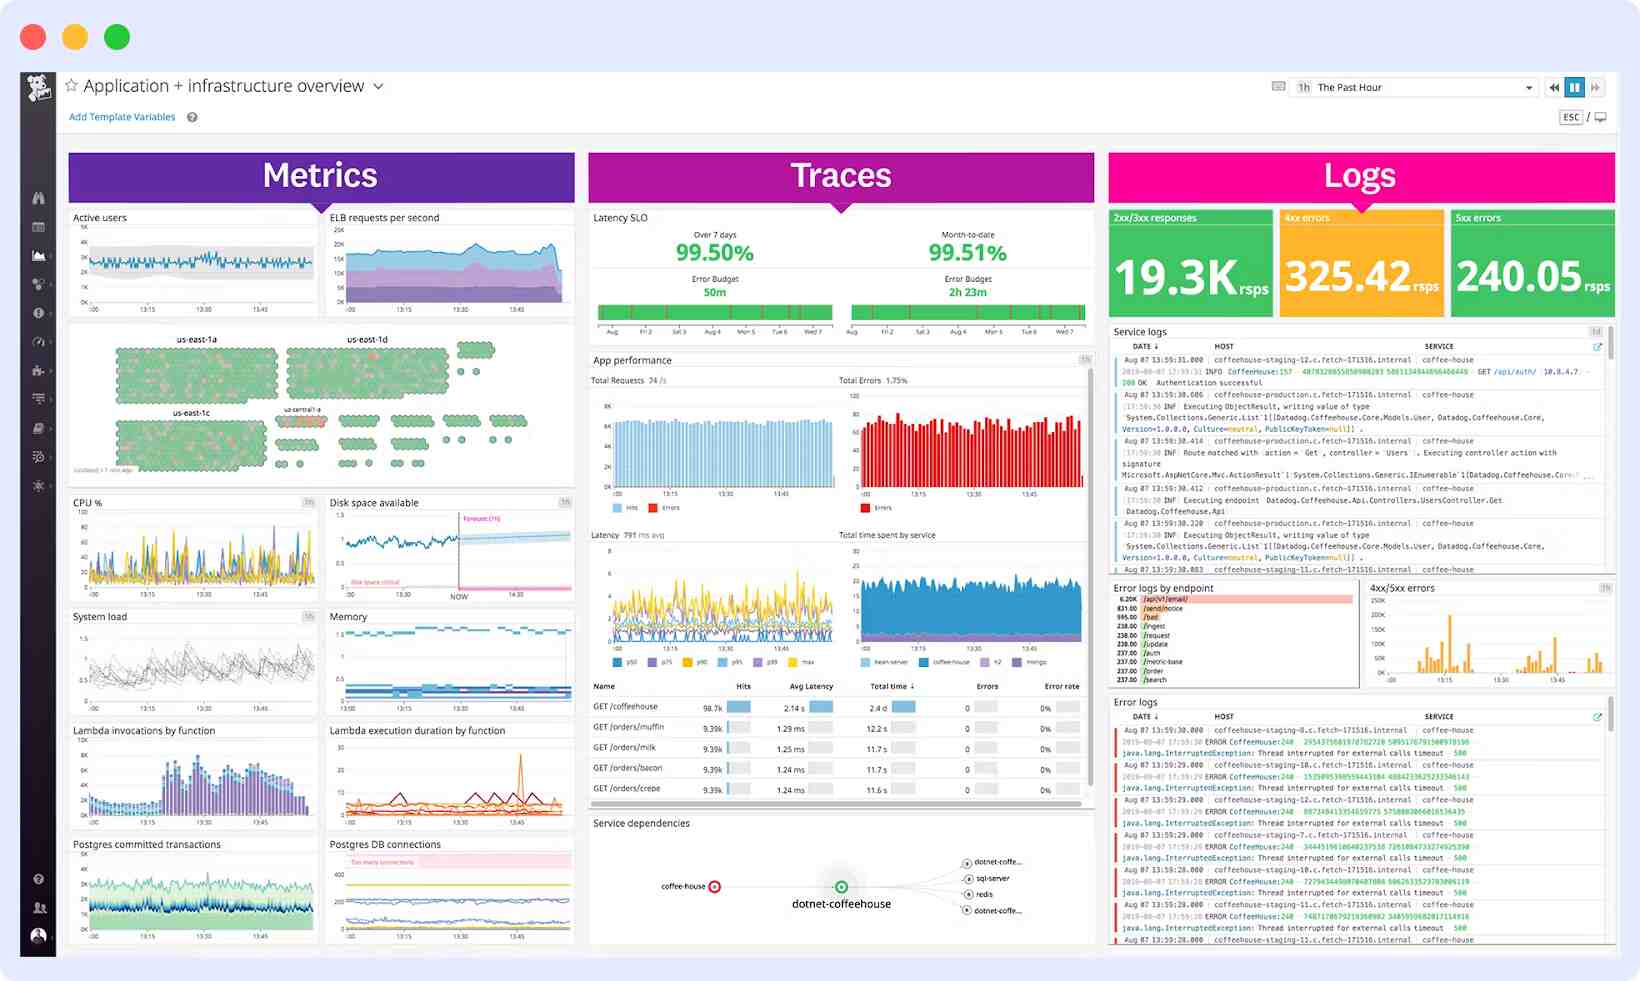
Datadog has over 450+ built-in integrations for databases, web servers, cloud services, languages, etc. It has error tracking capabilities through APM and Real User Monitoring. However, it excels more as a generalist monitoring solution. That makes it one of the best Sentry alternatives on the market.
It works best for DevOps teams and organizations seeking an all-in-one monitoring solution. It covers metrics for cloud infrastructure, application performance traces, and security.
Key Features of Datadog:
- APM with distributed tracing: Allows you to follow requests as they bounce between microservices to find exactly where things break.
- Log management: Ability to centralize all your logs with powerful search capabilities.
- Real user monitoring: You get to know exactly how the user is interacting with your application.
- Security monitoring: Can spot threats and compliance issues before they become a prominent issue.
Datadog Pricing:
- Free Trial: It offers a 14-day free trial with full access to the entire platform.
- Infrastructure Monitoring (Pro plan): $15 per host, per month (billed annually) or $18 per host, per month (billed monthly).
- APM (Application Performance Monitoring): It is a paid add-on for tracing. On the Pro plan, it costs $31 per host per month (billed annually) or $36 per host (billed monthly).
- Log Management: Logs are charged based on data volume. Datadog’s log management will cost $0.10 per GB of logs ingested per month.
Who should use Datadog?
Datadog is more suitable for teams that want broad monitoring across many systems and have budgeted for a premium platform. Datadog is an excellent Sentry alternative for medium-to-large companies with complex, distributed applications (microservices, multi-cloud deployments, etc.). These businesses can now fully leverage Datadog’s powerful features.
3. Dynatrace
Rather than just alerting you that “an error rate spiked,” Dynatrace’s AI will pinpoint the responsible component. It will also explain how the issue occurred. This makes Dynatrace a major plus and one of the best Sentry alternatives for enterprises. It’s ideal for those looking for a hands-off, intelligent monitoring tool for large, complex environments.
Key Features of Dynatrace:
- Full-stack monitoring: Dynatrace provides end-to-end observability across every layer – applications, microservices, processes, hosts, networks, and cloud platforms.
- AI-powered insights: The built-in AI (“Davis”) is continuously pairing together dependencies and anomalies. Dynatrace will not just alert an error, it will try to explain it.
- Automatic instrumentation: One of Dynatrace’s key selling points is OneAgent. You install it on a host, and it automatically instruments all applications, services, and containerized components. No code changes are required.
- Real User Monitoring: It will follow users’ interaction across mobile, hybrid, and single-page apps for detailed analysis.
Dynatrace Pricing:
- Full-stack monitoring: $0.08 per hour for an 8 GiB host (will cost around $57.60 per month).
- Infrastructure monitoring: $0.04 per hour per host of any size (around $28.80 per month).
- Kubernetes monitoring: $0.002 per hour per pod (approximately $1.44 per month per pod).
- Application security: $0.018 per hour for an 8 GiB host along with an active security module.
- RUM: $0.00225 per session (approximately $2.25 per 1,000 sessions).
Who Should Use Dynatrace?
Dynatrace is ideal for enterprises and large-scale cloud deployments. Its automatic instrumentation and intelligent analytics provide significant operational value. This makes it one of the best Sentry alternatives in 2026. However, if your team is smaller and focused on tracking down application bugs, Dynatrace may be more than you need. In that case, you might find Sentry or a simplified alternative much easier to use.
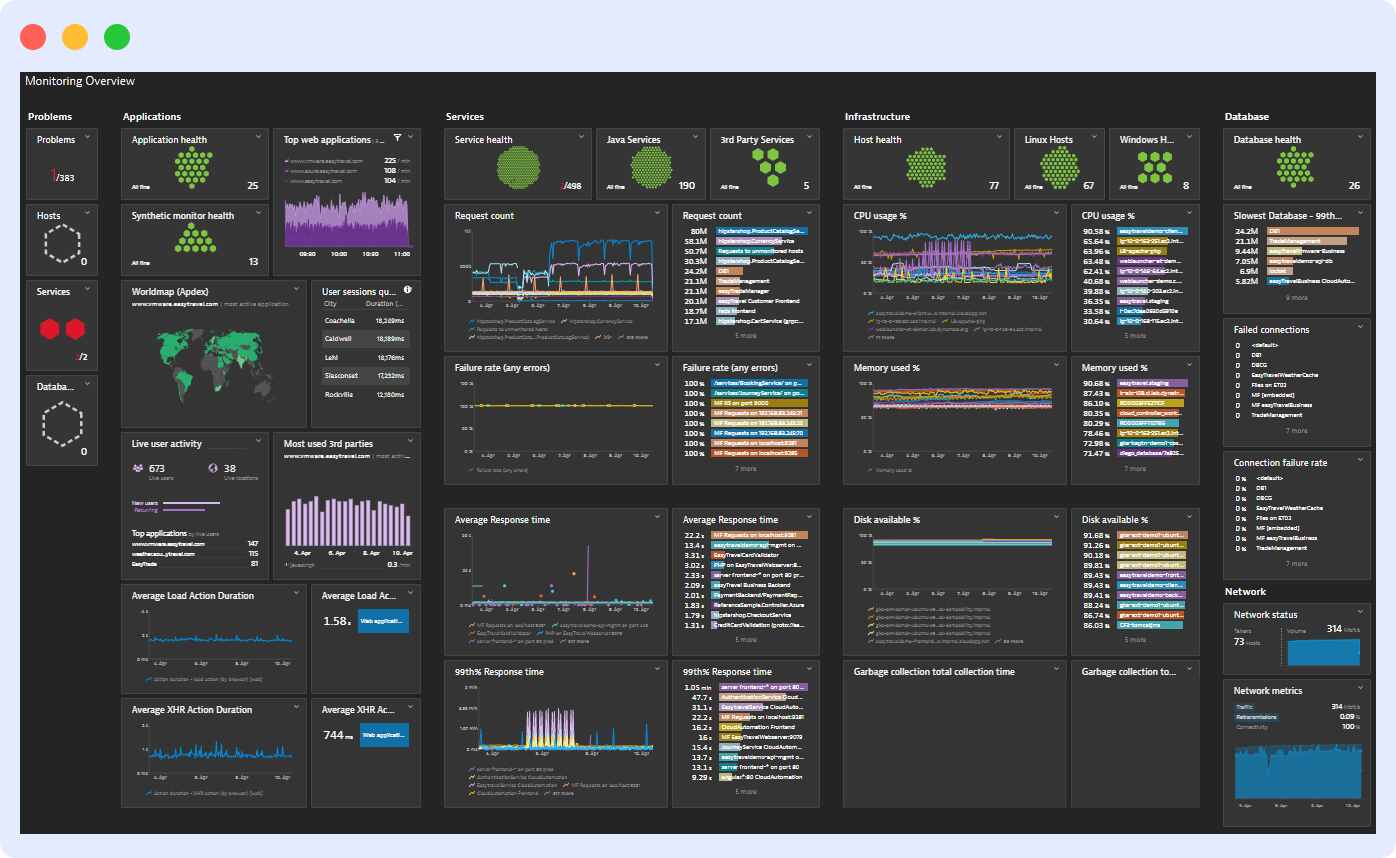
4. Splunk Observability Cloud
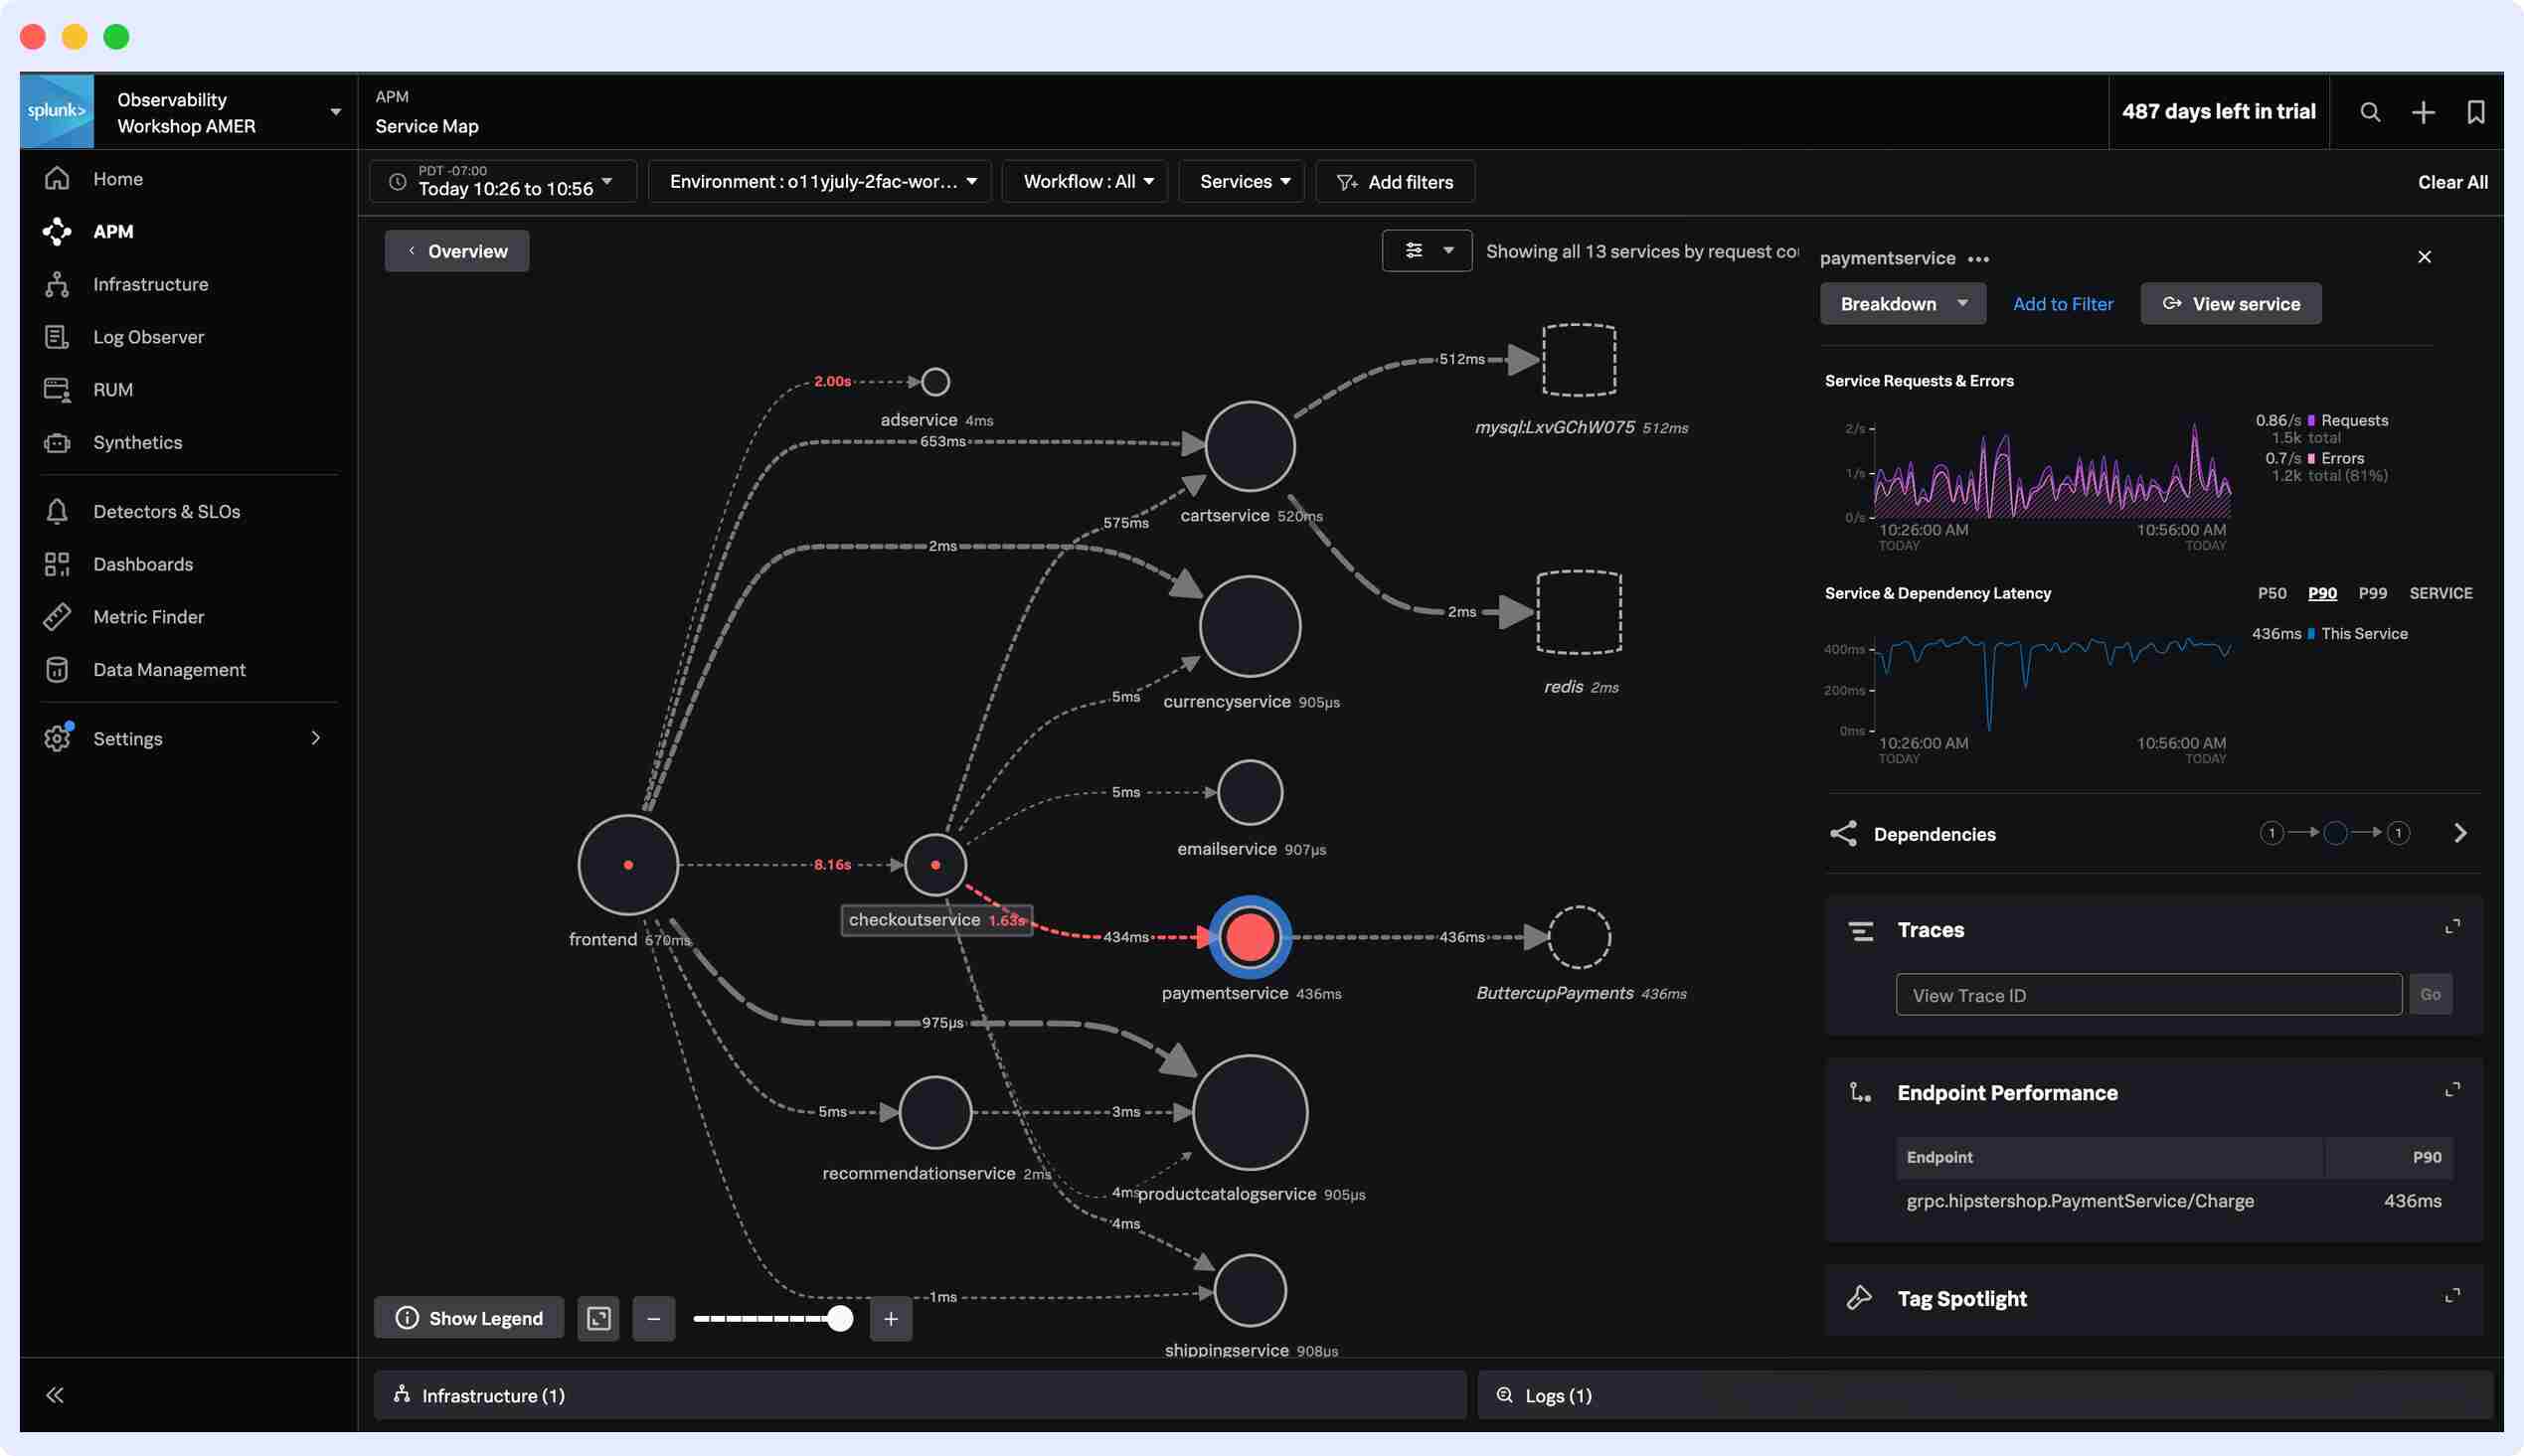
Splunk Observability Cloud has one distinctive feature that sets it apart: its NoSample technology. Unlike Sentry, which may miss rare errors, NoSample collects and analyzes 100% of your data. This ensures that nothing slips through the cracks.
Key Features of Splunk:
- Ecosystem and integration: If you are using Splunk, Splunk Enterprise to consume logs, or any of Splunk’s security tools (SIEM), then the Observability Cloud includes that in its ecosystem.
- NoSample tracing: Allows you to capture every single activity without missing a single bit of important information.
- Business impact analysis: It connects technical details to all the business metrics to have a clear understanding of what elements are positive and negative to the business.
- OpenTelemetry support: It is a vendor-neutral tool and integrates well with the OpenTelemetry framework.
Splunk Pricing:
- Infrastructure monitoring: $15 per host per month (billed annually), and this should be enough for basic metrics.
- Application monitoring: $60 per host per month (billed annually) and comes with full APM capabilities.
- Full-Stack Observability: $75 per host per month (billed annually) for complete monitoring, including user experience.
Who should use Splunk Observability Cloud?
The platform is designed for enterprise IT and DevOps teams who need a scalable, all-inclusive observability solution. If your organization already uses Splunk, transitioning to their Observability Cloud will help shorten the learning curve. It also makes it easier to integrate Splunk into existing processes. This makes it one of the best Sentry alternatives if you’re already in the Splunk ecosystem.
5. Bugsnag (SmartBear Insight Hub)
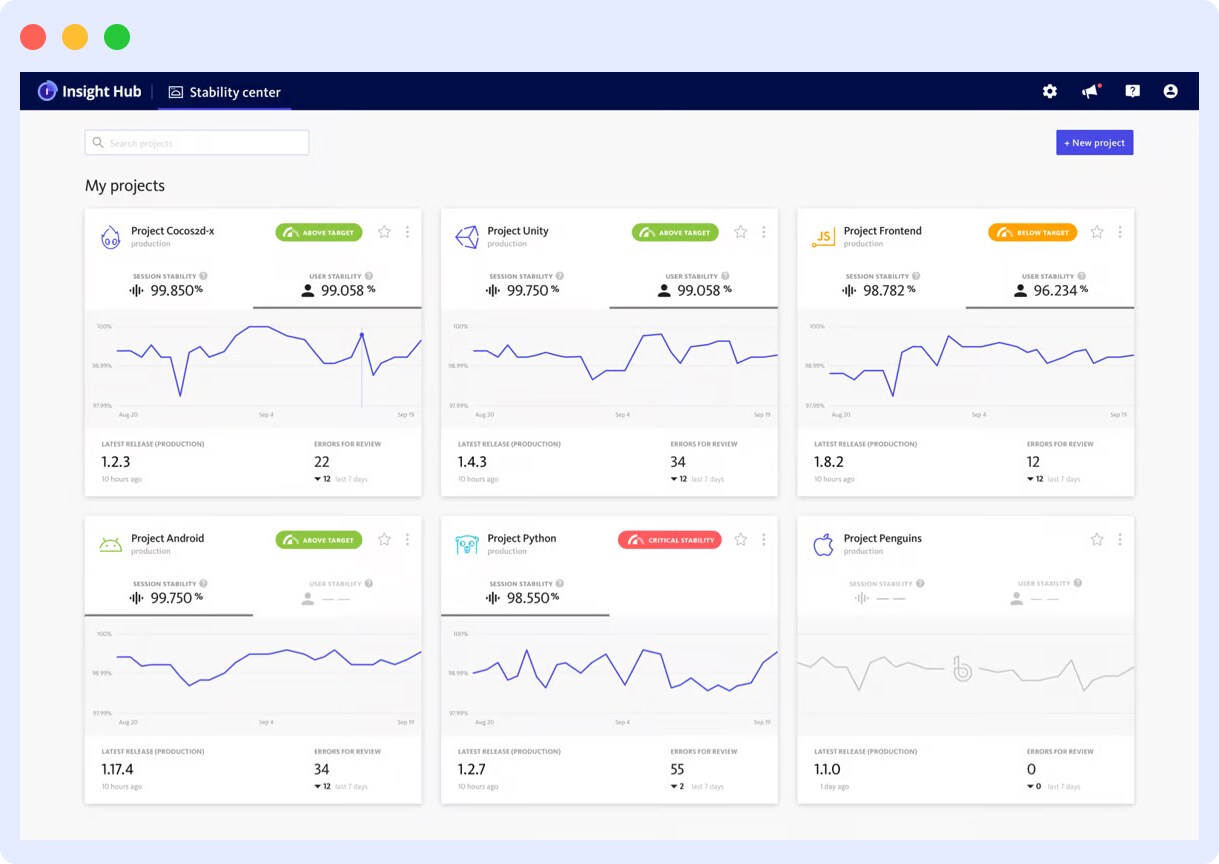
When you use Bugsnag for the first time, you’ll realize it was built by developers for a technical audience tired of irrelevant reports. While Sentry shows you errors, Bugsnag goes further by helping you understand which ones are worth considering. One key selling point is its ability to detect mobile-specific issues like ANRs (Application Not Responding) and OOM (Out Of Memory) errors, which can plague mobile apps.
Key Features of BugSnag:
- Release adoption: You can track how quickly users are upgrading to new versions.
- Mobile-specific monitoring: Catch ANR and OOM errors that other tools might miss.
- Multi-platform error monitoring: Bugsnag supports an extensive number of platforms and frameworks (JavaScript, Python, Ruby, Java, Android, iOS, Unity, Unreal, etc.).
- Stability center & user impact: Bugsnag provides the stability score (percent of crash-free sessions) with a visual that shows all the errors and which are affecting the most users.
- Error workflow & custom data: You can attach custom data to errors (user IDs, application state breadcrumbs, etc.) and set up workflow rules.
BugSnag Pricing:
- Free (Lite) Plan: $0 – 1 Users, 7500 errors/month, 7 days of data retention.
- Starter (Select) Plan: Starting at $20/month – up to 50k monthly events and 1M spans on a monthly basis.
- Preferred Plan: Starting at $33/month – up to 100k in monthly events and 1M spans on a monthly basis, automatic error prioritization, and stability benchmark capabilities.
Who should use Bugsnag?
Bugsnag is especially good for mobile app-focused teams and startups that are devoted to user experience, as the stability metrics are aligned to improving mobile app quality. The openness of having a free and fairly reasonable mid-tier pricing will give more teams access to this tool.
6. Elastic Stack (ELK Stack)
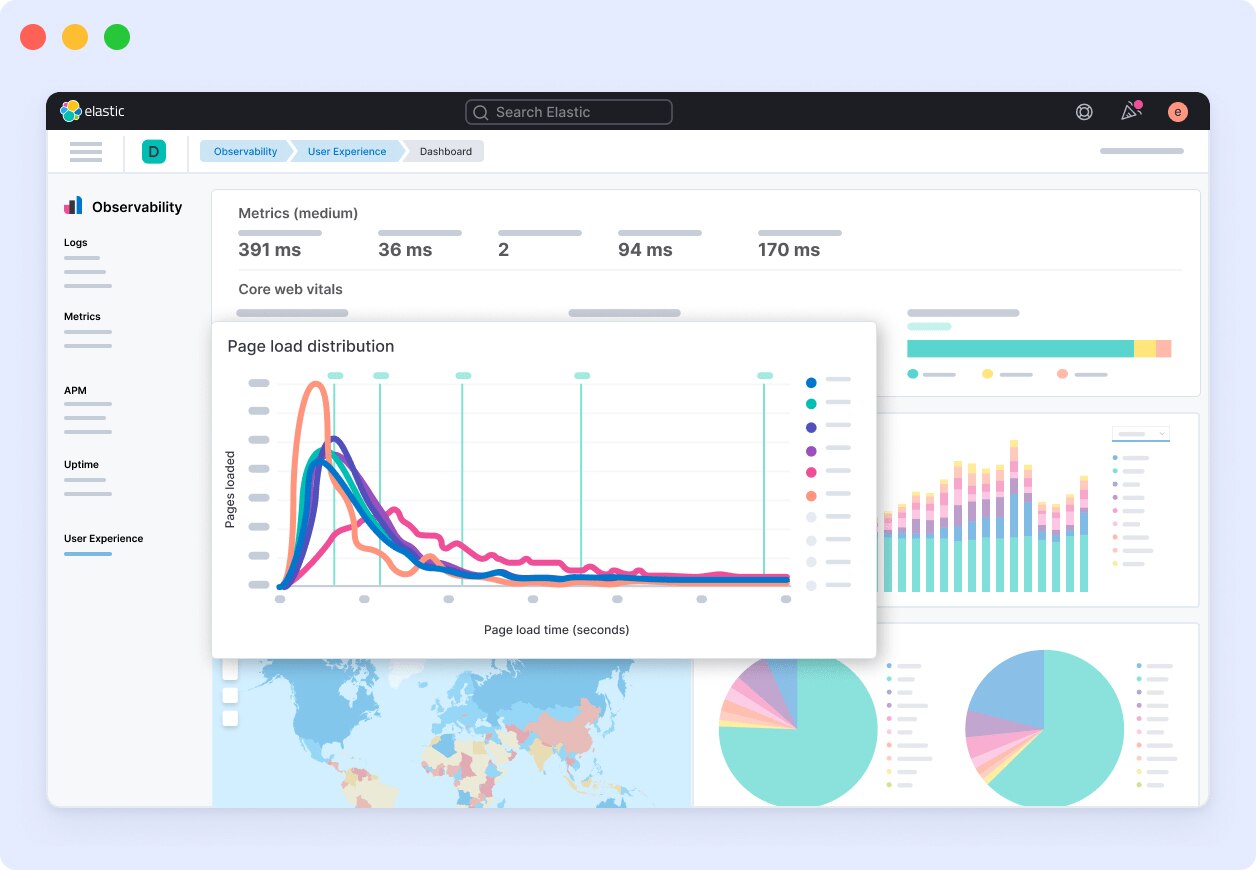
Elastic Stack’s major advantage is that it’s open source (with free core features) and very customizable. Unlike Sentry’s hosted solution, Elastic lets you run everything yourself with complete control over every aspect of your monitoring setup. This is a huge plus for small teams who can’t invest much into an error tracking platform and still want to have the necessary features without spending much (other than the infrastructure cost). This feature alone makes it one of the few open-source Sentry alternatives available in 2026.
Key Features of Elastic Stack:
- Log and metric integration: APM data (errors, spans, transactions) can be combined with logs and metrics ingested from Beats or Logstash, as it is part of Elastic Stack.
- OpenTelemetry support: Elastic APM can support OpenTelemetry, which is an open standard for instrumentation. For teams investing in open standards, Elastic can ingest OTLP data.
- Customization: You can use Kibana to develop visualizations, perform aggregations on your error data, and develop your own alert rules.
- Self-hosted option: Since you can run Elastic Stack on-premises, it’s a good solution for companies with strict data privacy needs, or air-gapped environments.
Elastic Stack Pricing:
- Self-managed (Open Source): If you run Elastic Stack completely independently on your own servers or cloud instances, the software is free to use under the Basic license.
- Elastic Cloud (Hosted SaaS): This is a model based on resources. For example, in the AWS us-east-1 region, the standard APM server on Elastic Cloud starts around $0.0431 per hour for a small instance. That’s around $31 ($31.08) a month for an APM instance.
Who should use Elastic Stack (ELK)?
Elastic Stack is a great choice and among the top Sentry alternatives for organizations that want flexibility and control instead of a turnkey experience. If you’re on a tight budget and are willing to trade time (managing servers) for licensing, the free self-hosted option can be very financially resourceful.
7. AppDynamics
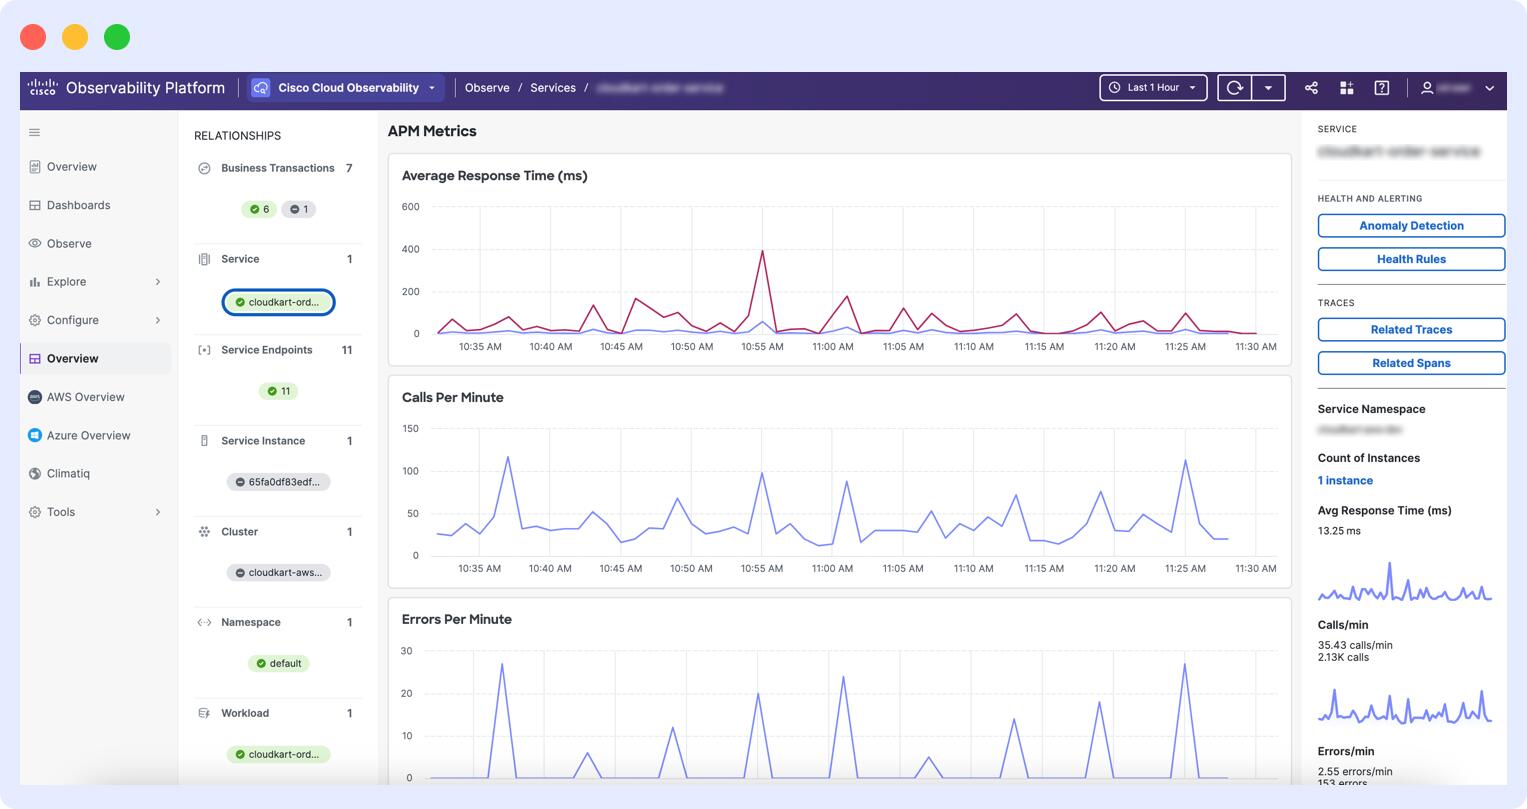
AppDynamics, now part of Cisco, is a prime example of a business-first tool. It connects technical hiccups to actual business outcomes, such as the revenue loss from an error on the checkout page. If your organization has already invested in the Cisco ecosystem, AppDynamics should be considered a top choice when looking for Sentry alternatives in the market.
Key Features of AppDynamics:
- Synthetic monitoring: AppDynamics can also run synthetic transactions to simulate users interacting with the system (like Dynatrace), to check functionality and performance before it influences real users.
- Business performance monitoring: You can configure a “business transaction” for a user checkout or fund transfer, and AppDynamics monitors how many succeeded, how many failed (errors), and the dollar value.
- End-to-end transaction visibility: Allows you to track user interactions across all services.
- JVM monitoring: Gives you deep insights into Java application performance.
AppDynamics Pricing:
- Infrastructure Monitoring Edition: Starting at $6 per CPU core per month ($72 per year/$6 per month) (billed annually).
- Premium (APM) edition: Starting at $33 per CPU core per month ($396 per year/$33 per month) (billed annually). This version includes the full APM Suite.
- Enterprise edition: Starting at $50 per CPU core per month ($600 per year/$50 per month) (billed annually). This version includes everything in APM Premium, but adds on Business Performance Monitoring and some advanced usage analytics.
Who Should Use AppDynamics?
AppDynamics can be considered among the best choices for Sentry alternatives, especially for enterprises that need to connect technical performance directly to business outcomes. So if your organization has complex Java-based applications, needs deep code-level diagnostics, or wants to demonstrate the ROI of technical investments to business stakeholders, AppDynamics is a good choice.
8. Raygun
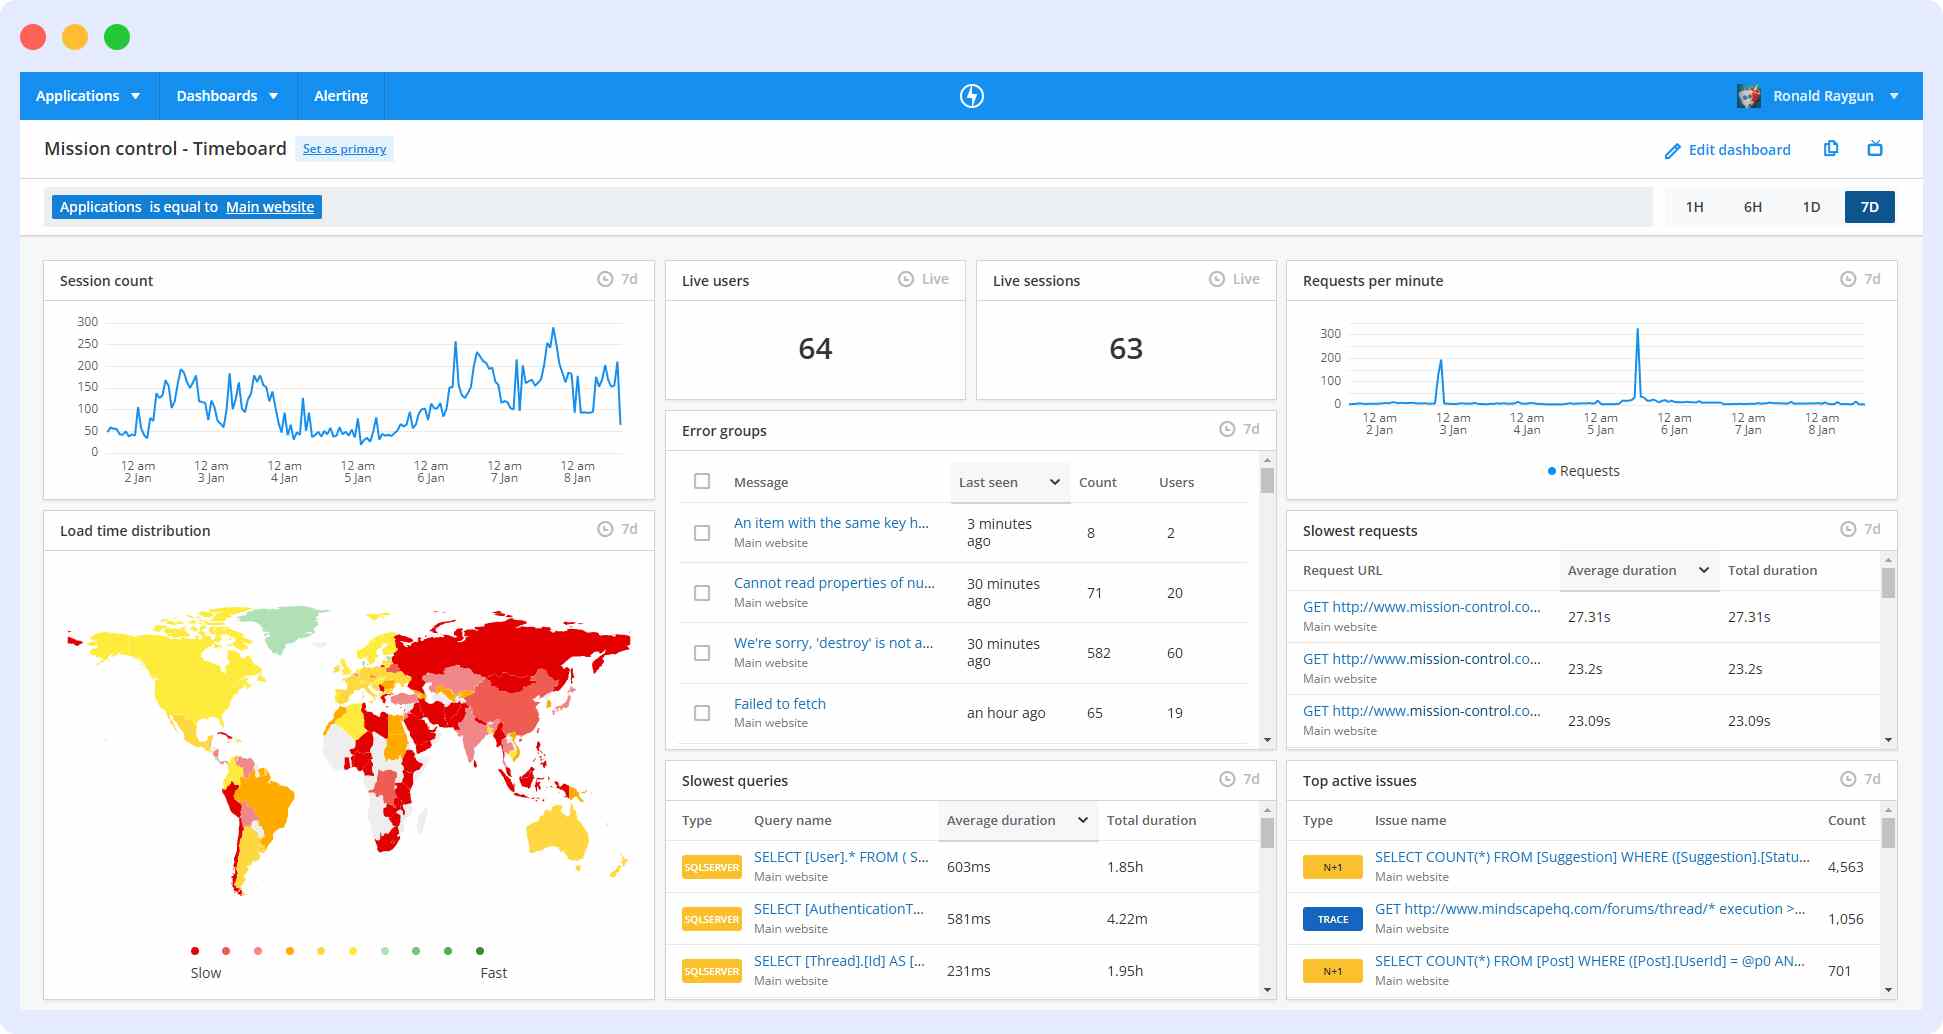
Raygun is directly comparable to Sentry and Bugsnag as it offers similar features for error tracking, marking its entry in our list of top Sentry alternatives. One spotlight feature of Raygun is the ability to track down what is bugging the user instead of giving hundreds of irrelevant logs. In simple terms, it excels at removing noise and only bringing out the relevant information.
Key Features of Raygun:
- Crash reporting: Raygun’s Crash Reporting works very similarly to Sentry at its core. It provides real-time error detection across multiple languages and frameworks.
- Real User Monitoring (RUM): Raygun’s RUM provides client-side performance data, including load times, speeds of asset downloads, how an SPA (single-page app) is behaving, etc.
- User tracking and insights: Raygun allows you to tie errors to specific user identities (if you can tie a user ID or email from your app). So you can look up the user John Doe and see that the user encountered 5 errors and 3 crashes.
- Integrations and workflow: Like Sentry, Raygun integrates with issue tracking tools (Jira, GitHub, etc.), chat ops (Slack, MS Teams), and other tools. It can auto-create issues or ping the team when a new error pattern is detected.
Raygun Pricing:
- Crash reporting (Basic plan): Starting around $60 a month for unlimited users, and typically up to 100,000 errors per month, with a default 180-day data retention period.
- Crash reporting (Team plan): Around $300 a month for that same plan, but up to about 500,000 errors per month, also 180-day retention.
- Crash reporting (Business plan): Roughly $600 a month for over 1,000,000 errors per month, with 180-day retention.
Who should use Raygun?
Raygun is a great choice when looking for Sentry alternatives, especially for teams that want an integrated view of errors and performance. It offers a polished developer experience, making it ideal for product companies and SaaS businesses. Raygun is particularly useful for those focused on delivering a seamless experience for end users, ensuring their web or mobile app functions well globally.
“Compared to other observability solutions, Middleware offered similar or even superior capabilities at a much lower cost, eliminating the need for expensive tiered pricing or additional charges for advanced features. This made Middleware a more accessible and scalable solution for a business like ours. In fact, we were able to reduce our costs by 75%.”
Krishna Charan BS, Information Security Head, MindOrigin
Sentry Alternatives: Which One Should You Choose?
| Tool | Best For | Key Strengths | When to Choose | Notable Limitations |
|---|---|---|---|---|
| Middleware | Teams needing full-stack observability at low cost | Unified metrics, logs, traces, RUM, synthetic checks, OpenTelemetry, cost control, generous free tier | When you want all-in-one observability, predictable pay-as-you-go pricing, and no context-switching | Newer to market |
| Datadog | DevOps teams, large orgs with complex, distributed systems | 450+ integrations, APM, infrastructure, logs, security, RUM | When you need broad monitoring across many systems and have budget for a premium solution | Can be expensive as usage scales |
| Dynatrace | Enterprises with large, complex, cloud-native environments | AI-powered insights, full-stack monitoring, automatic instrumentation, RUM | When you need intelligent analytics, auto-instrumentation, hands-off monitoring for large-scale systems | Overkill for small teams, higher cost |
| Splunk Observability | Enterprises already using Splunk, need 100% data capture | NoSample tracing (captures all data), business impact analysis, OpenTelemetry, strong integrations | When you need to capture every event, integrate with Splunk ecosystem, and perform business impact analysis | Expensive, best for existing Splunk users |
| Bugsnag | Mobile app teams, startups focused on user experience | Mobile error monitoring (ANR, OOM), stability metrics, multi-platform support, workflow customization | When you need deep mobile app monitoring and actionable error prioritization | Less suited for broad infrastructure needs |
| Elastic Stack (ELK) | Teams wanting open-source, highly customizable, self-hosted solutions | Open source, customizable, log/metric/APM integration, OpenTelemetry support, self-hosted option | When you need control, flexibility, and have resources to manage your own stack | Requires self-management, learning curve |
| AppDynamics | Enterprises needing business-performance linkage, deep Java diagnostics | Business transaction monitoring, synthetic checks, end-to-end visibility, business impact measurement | When you want to connect technical issues to business outcomes, especially for Java-heavy environments | Premium pricing, best for Cisco ecosystem |
| Raygun | SaaS/product teams wanting integrated error and performance monitoring | Crash/error reporting, RUM, APM, user insights, developer-friendly, integrations | When you want a polished developer experience and combined error/performance tracking for web/mobile apps | APM support limited to select platforms |
Conclusion
Whether you need an AI-powered tool or a tool that offers a more economical pricing model, we believe Middleware stands out in almost all scenarios. With its unified observability approach and transparent pricing model, it hits the perfect spot.
But if you are already a part of an ecosystem or have a specific requirement, then you can go with any of the suggested tools in this article.