



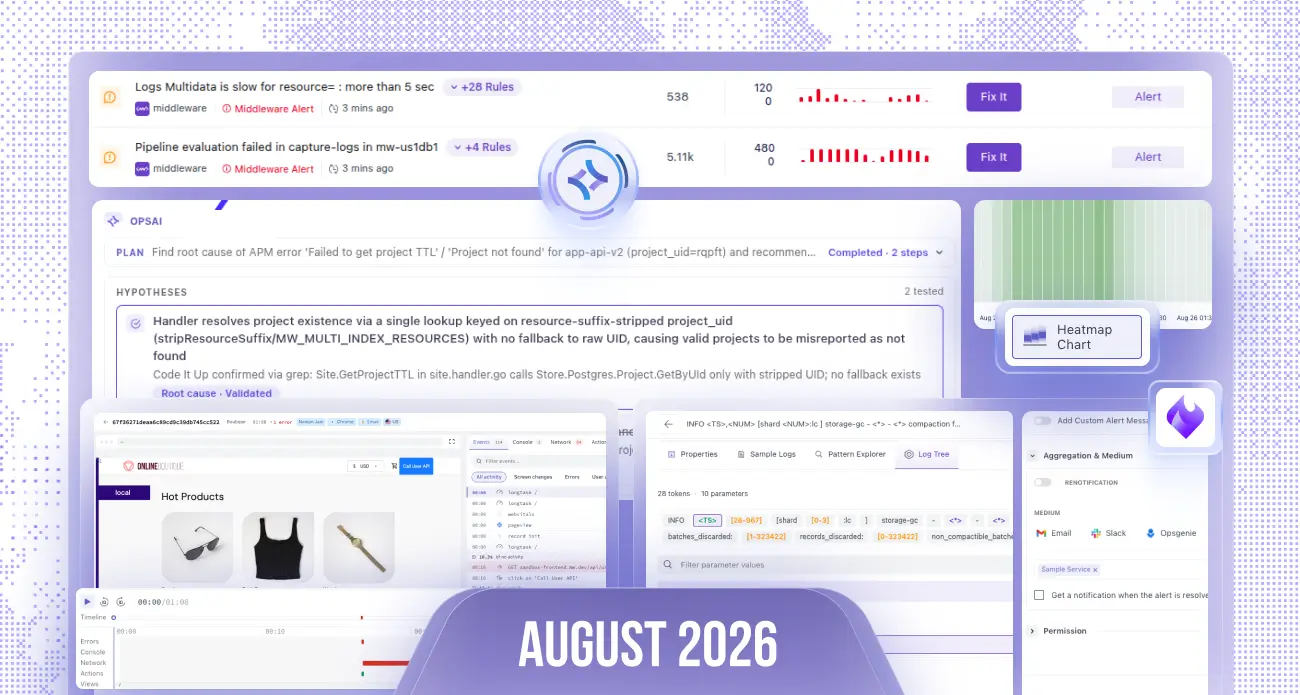
From smarter AI-powered investigations to deeper trace visibility and a more powerful log analysis experience, this release is packed with features that help developers investigate incidents faster, understand application behavior in more detail, and build better observability workflows.
Here’s everything new this month 👇
🤖 OpsAI – Smarter Investigations & Better Context
Grouping Similar Issues
OpsAI now groups similar issues and errors into a single issue to make investigations easier to navigate.
Issues from:
- Kubernetes ,APM ,Alerts are automatically grouped when they are related.
- You can expand a grouped issue to see individual occurrences across different: Services, Applications, Hosts, Clusters.
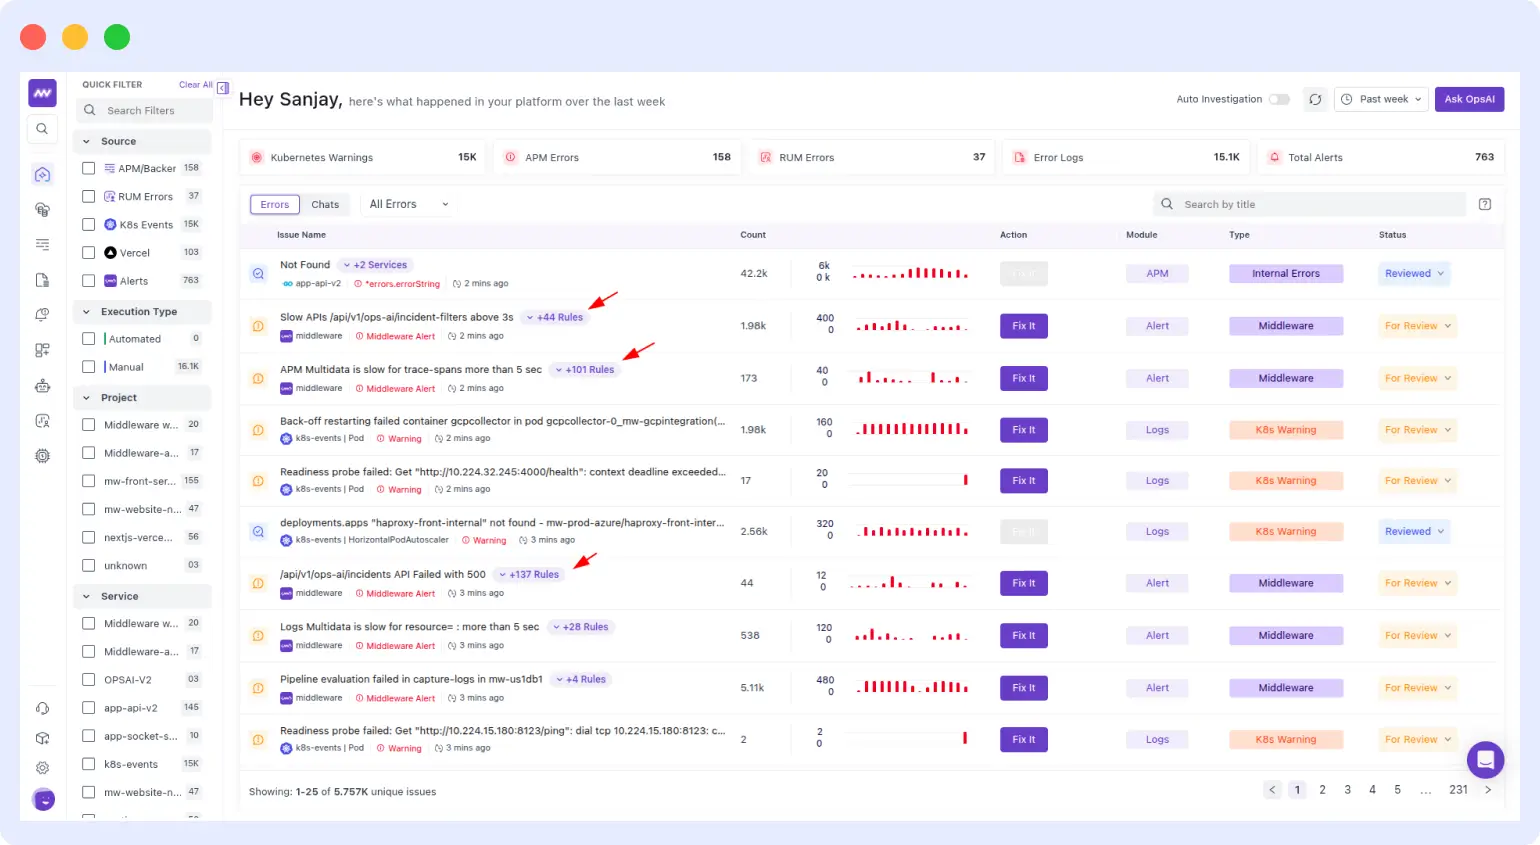
You can then investigate and fix individual issues directly from the grouped view.
Planning & Hypothesis Board
We’ve introduced a more structured investigation experience in OpsAI.
During an investigation, OpsAI now provides:
- Live plan checklist showing the investigation goal, steps, and progress
- Hypothesis board to track potential root causes
- Hypothesis status such as:
- Testing
- Validated
- Ruled out
- Inconclusive
- Root cause highlighted once validated
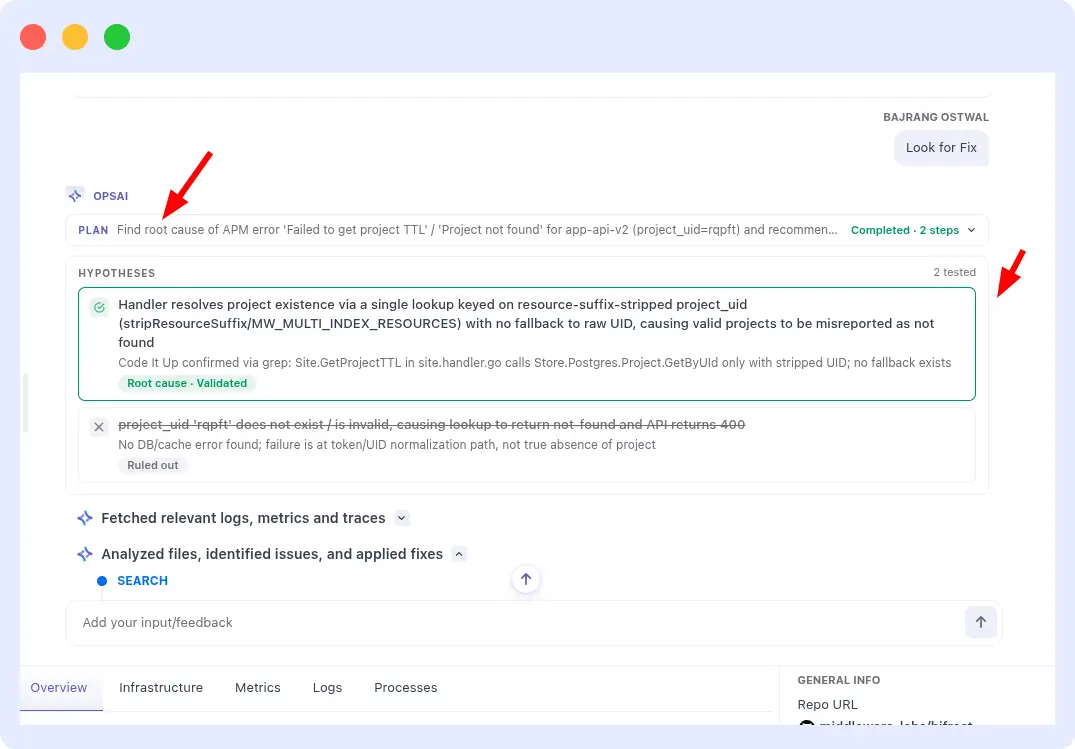
This gives developers better visibility into how OpsAI is reasoning through an incident.
Git Investigation Tools
OpsAI investigations now include additional VCS context with:
- Commit history
- Git blame
- Code diffs
This provides more context when investigating application issues and identifying the code changes that may have introduced them.
Analyze Images with OpsAI
You can now upload images directly into New Chat, Alert Creation, and Dashboard Creation.
OpsAI can analyze information from uploaded images and use it to:
- Understand the issue
- Provide RCA
- Suggest solutions
- Help create dashboards or alerts
Improved Stack Trace Analysis
When detailed stack trace information isn’t available, OpsAI can now use minified stack traces and infer additional stack details to improve investigation accuracy.
🔍 APM Trace Explorer – Revamped
We’ve revamped the APM Trace Explorer to make investigating traces and spans faster and more intuitive.
New Trace Views
The trace listing and detail experience now provides improved:
- Waterfall view
- Flame graph view
- Trace and span details
You can also see additional information such as:
- Error count
- Event count
- Span-level details
Explore Large Traces Faster
For traces with a large number of spans, you can now:
- Zoom in and out on specific spans
- Search by span name
- Load additional spans when needed
One-Click Filtering
Quickly filter spans based on:
- Errors
- Logs
- Events
This makes it easier to focus on the signals that matter during debugging.
For the complete Trace Explorer capabilities, check the Trace Explorer documentation.
🏢 SAP HANA Integration
SAP HANA is now available as a new integration under Database Monitoring.
You can monitor SAP HANA running on:
- Linux hosts
- Kubernetes clusters
Multiple SAP HANA instances can be configured on a single host or cluster, with Middleware collecting metrics from each instance.
Read Documentation to do integration.
🔌 Agent & Integration Improvements
MongoDB Atlas
- Removed the legacy form context from the integration UI for a cleaner setup experience.
Datadog & Grafana
- Improved integration UI with clearer auto-save states.
Prometheus on Kubernetes
- Improved the layout and overall UX of the Prometheus data-scraping configuration.
📜 Log Monitoring – Deeper Log Exploration
Log Tree
We’ve introduced a tree-based view for exploring parameter values and their occurrence counts.
Each parameter can be expanded hierarchically to see:
- Available values
- Frequency of each value
- Parameter relationships
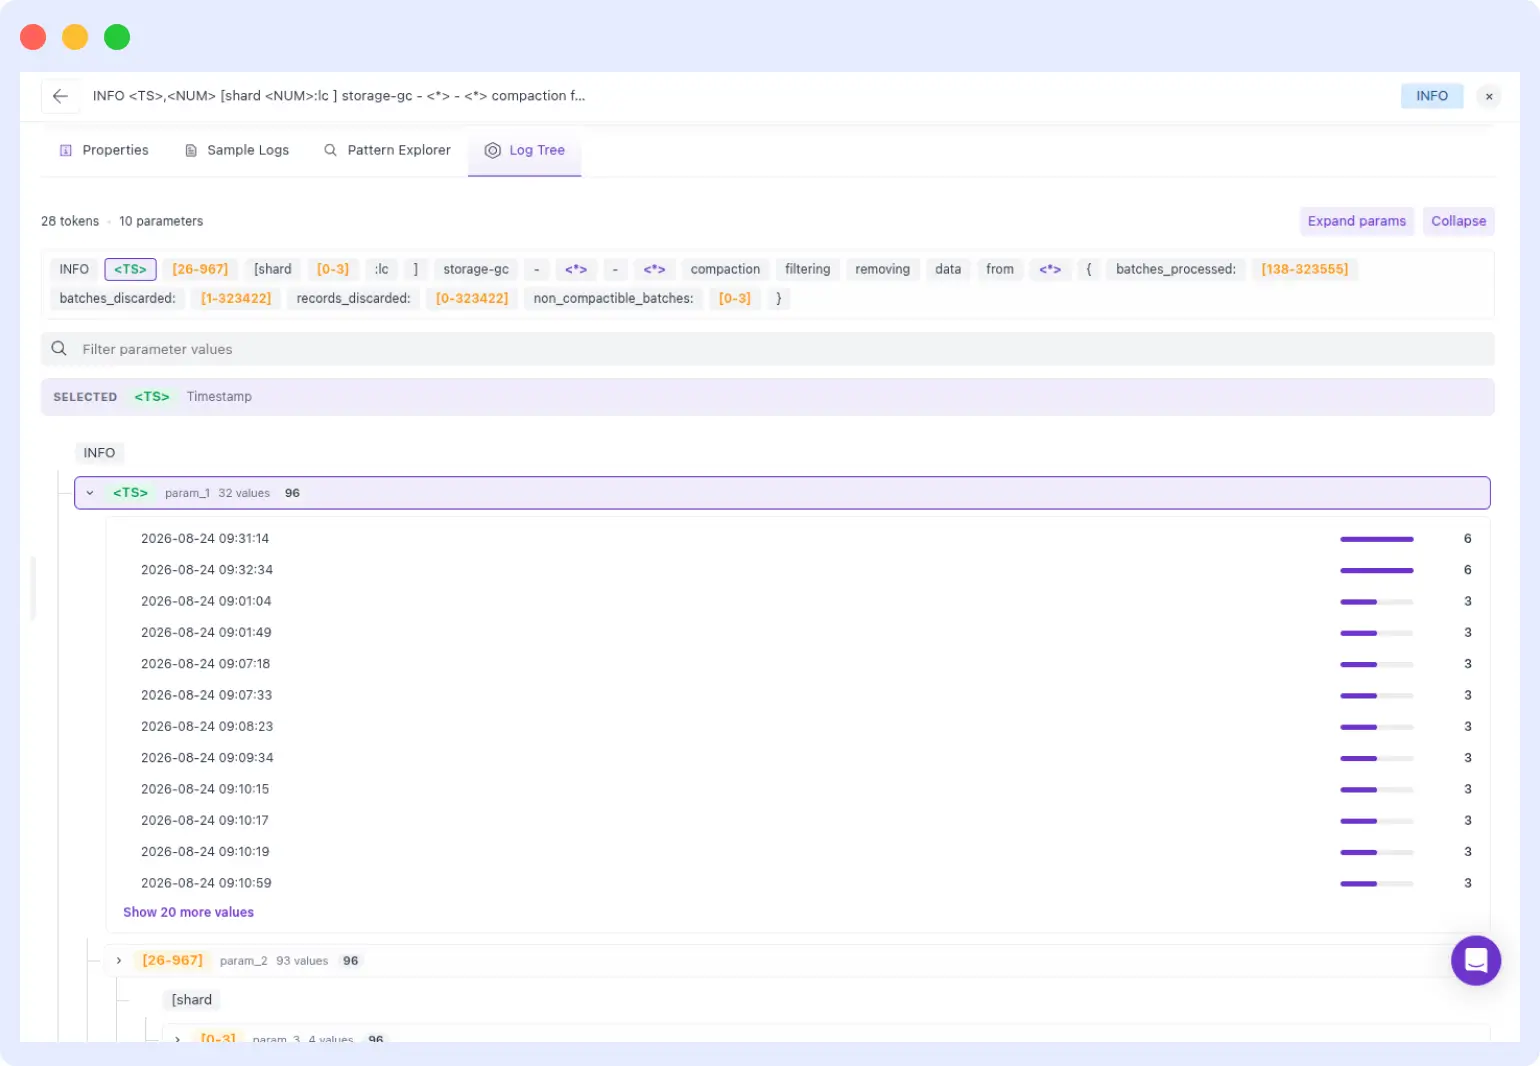
This makes it easier to understand the structure and distribution of log patterns.
Improved Log Detail Panel
We’ve made several improvements to the Log Detail experience:
- Log attributes are now sorted alphabetically by default.
- Log attributes and resource attributes are merged under the Log Property view.
- Fixed JSON parsing issues in certain scenarios.
- Added quick copy options for important attributes such as:
- OS
- Source
- File name
- Host
- Container
- Cluster
- Pod
- Deployment
- Updated log pattern filters to work together with body filters.
🚨 Zenduty Integration
Middleware now supports Zenduty as a notification channel for alerts.
Once integrated:
- Middleware alerts automatically create incidents in the selected Zenduty service.
- Alert severity is mapped to the corresponding incident priority.
- When an alert recovers in Middleware, the corresponding Zenduty incident is automatically resolved.
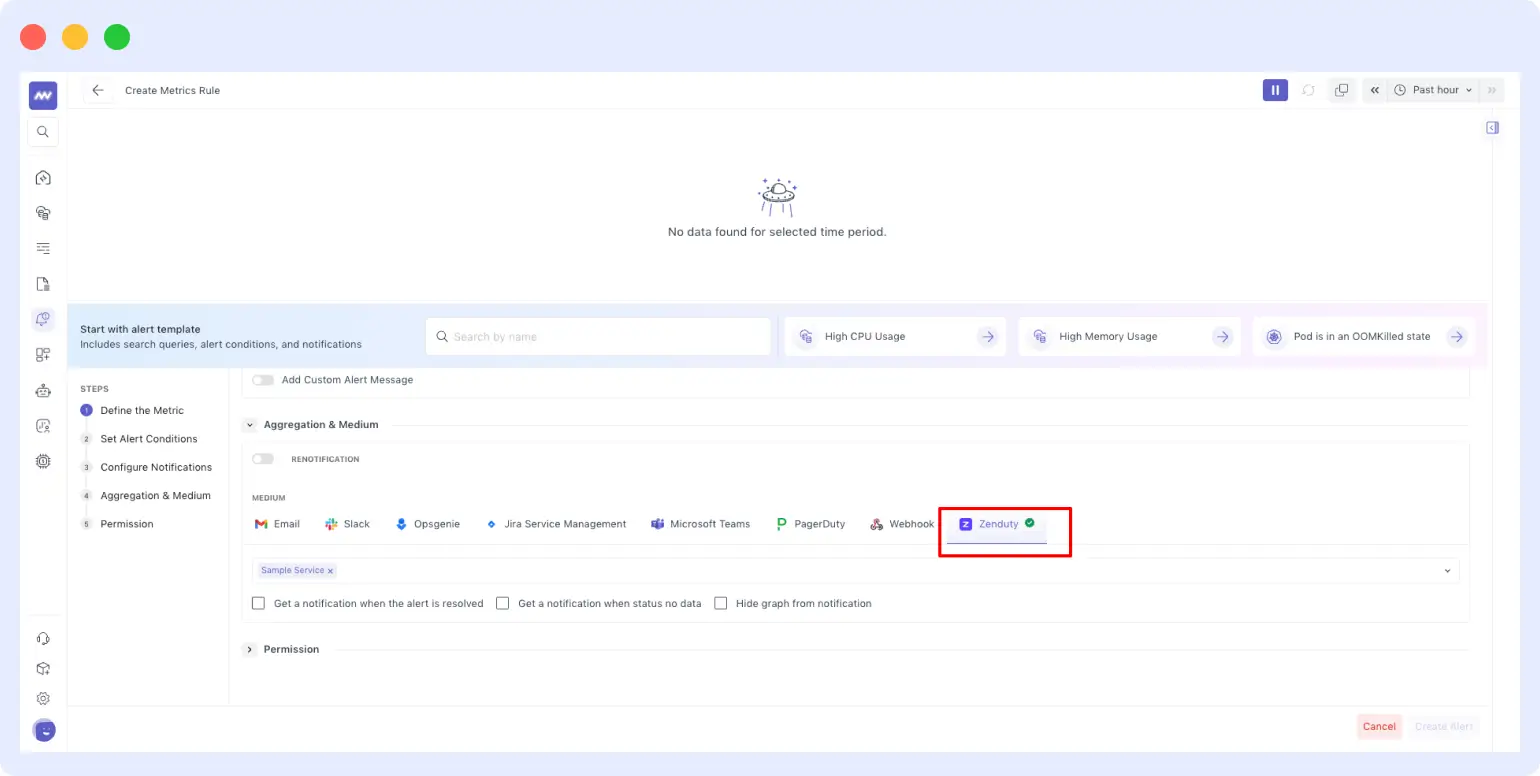
This keeps incident status synchronized across both platforms.
For setup details, check the Zenduty integration documentation.
🌐 RUM – Redesigned Session Replay
We’ve revamped the RUM Session Replay experience to make debugging frontend issues easier.
You can now:
- Jump directly to errors, network events, console events, or user actions in the timeline and replay.
- View screen changes, errors, user actions, network events, and Web Vitals together in one activity panel.
- Search and filter events by:
- Event type
- Severity
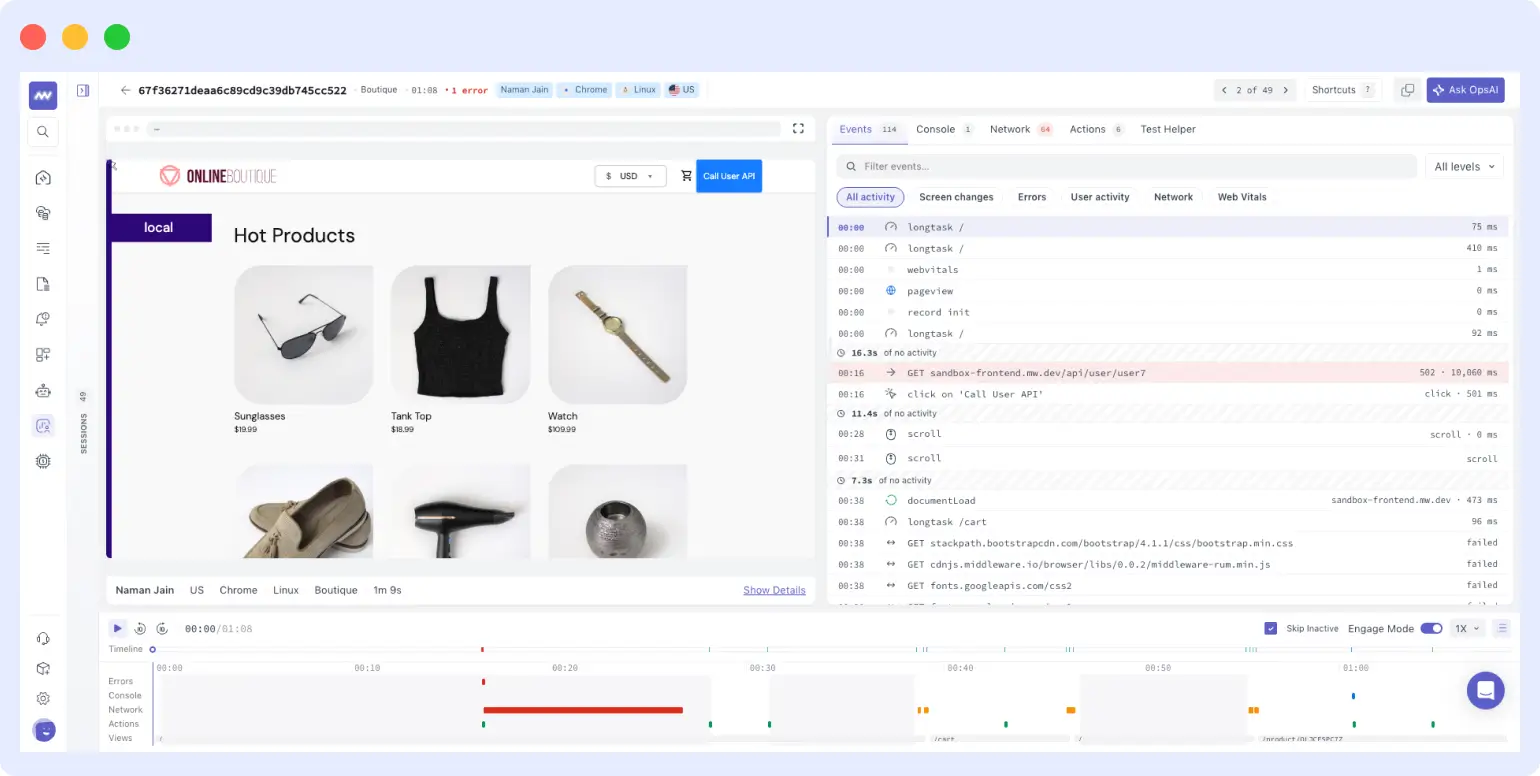
This makes it easier to connect what the user experienced with what happened inside the application.
View details about all new features in detailed documentation.
📊 Dashboard Builder Improvements
Split by Graph
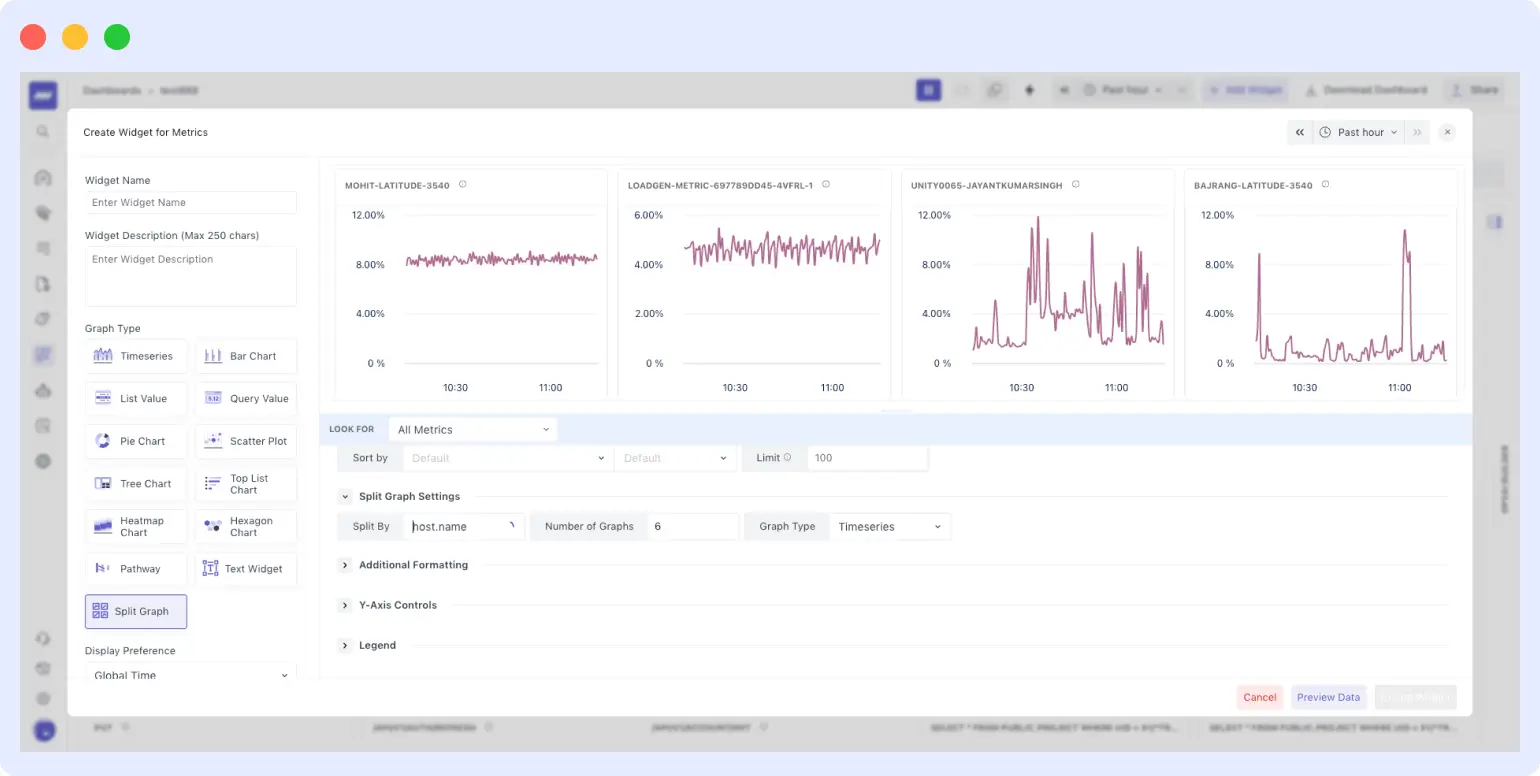
You can now create a single query and automatically split the results into separate graphs based on an attribute.
For example:
CPU utilization → Group by hostname
Middleware automatically generates individual widgets for each host.
Heatmap Graph
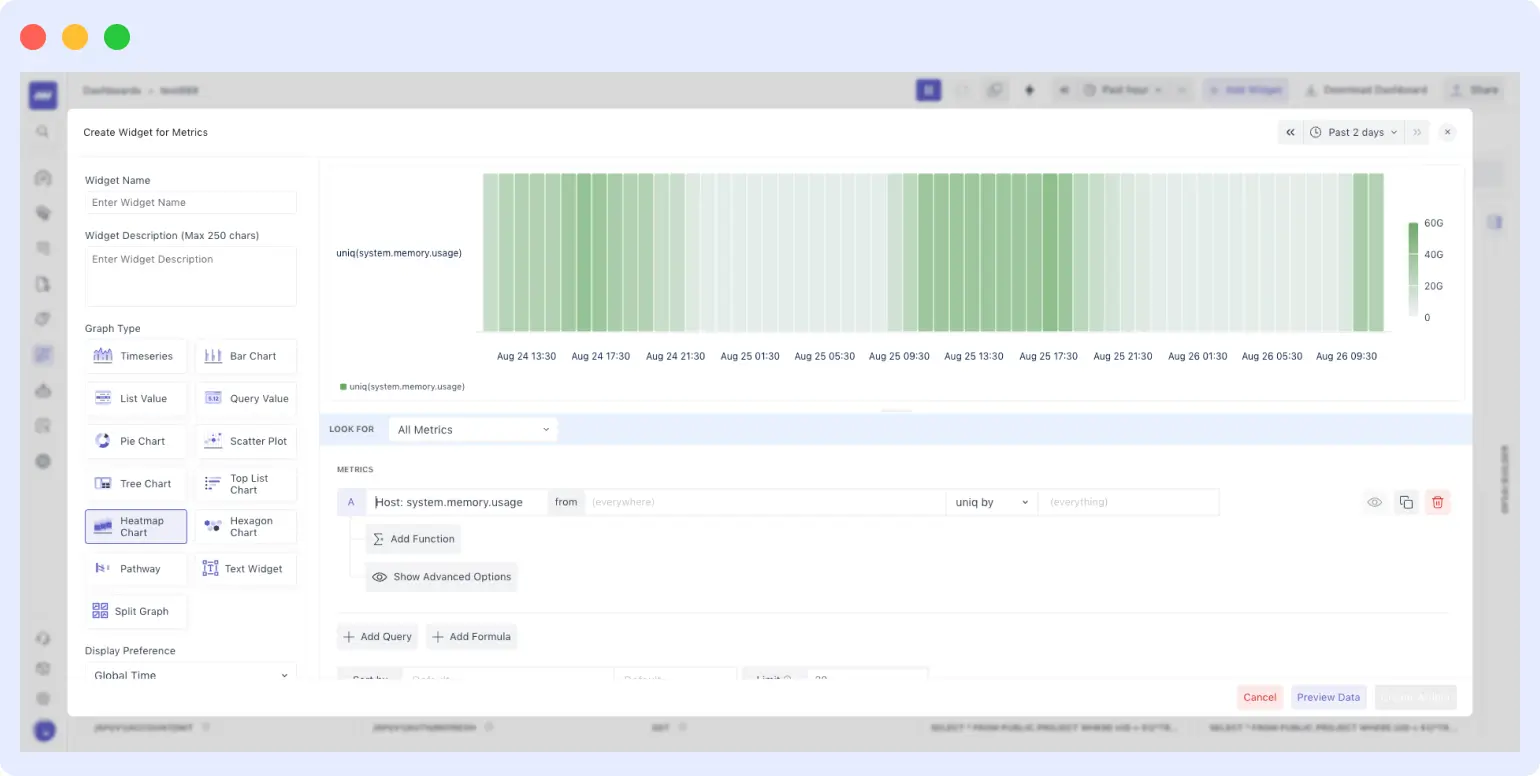
Added a new Heatmap Graph to visualize utilization spikes and hotspots across attributes.
This makes it easier to identify patterns and outliers across large datasets.
Apply All
When creating a widget, you can now apply configuration changes across all queries with a single click.
Apply:
- Filters
- Group By
- Roll-up settings
to all queries at once instead of configuring each query individually.
🎨 UI/UX Improvements
We’ve made several consistency and usability improvements across the platform.
Consistent Icons
Updated import, export, and download icons across the product to make actions more consistent and easier to understand.
Consistent Data Formatting
Standardized rounded values across screens and tables.
Data now follows a consistent x.xx format, for example:
1.25
This makes values easier to compare across different parts of the product.

