



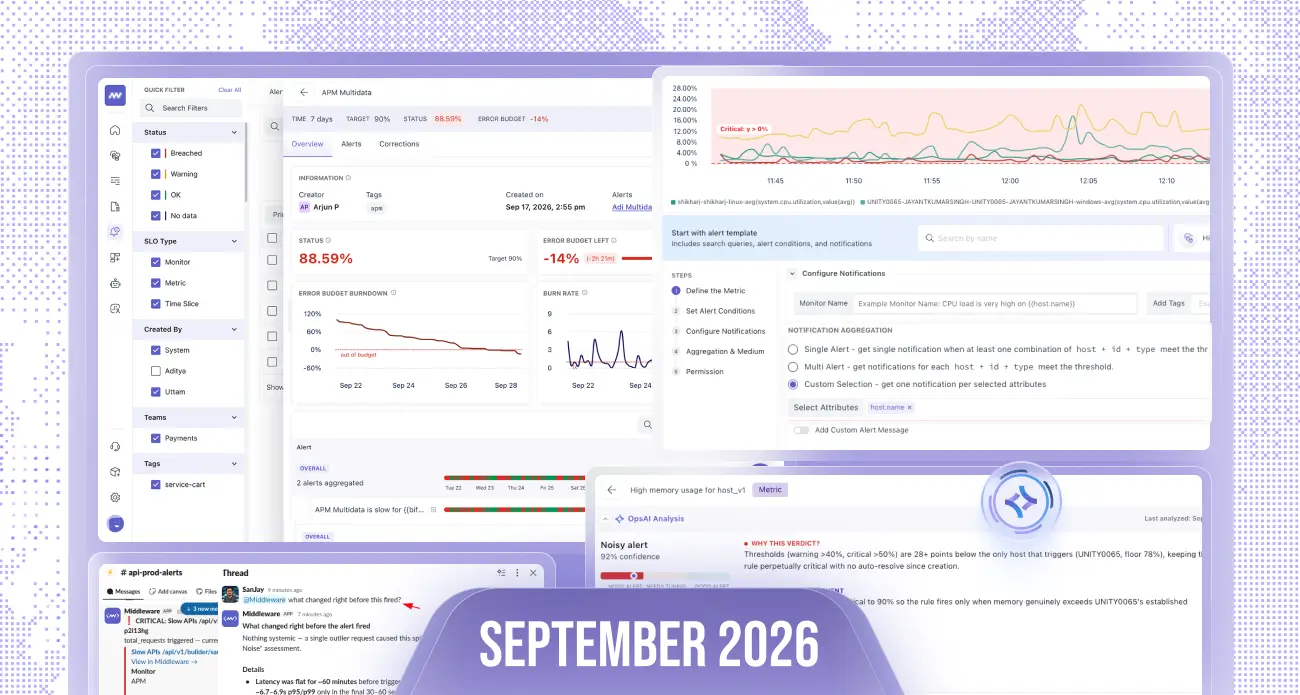
From Service Level Objectives and smarter alerting to improved log analysis and deeper OpsAI integrations, this release adds new ways for developers to monitor reliability, investigate issues, and act on observability data.
Here’s everything new this month 👇
💳 Free Forever Plan
We’ve introduced a Free Forever plan with monthly included usage across Middleware:
- 100 GB data ingestion
- 1,000 RUM sessions
- 20,000 synthetic checks
- 10 browser tests
- 2 million OpsAI tokens
A credit card is required to activate the Free Forever plan.
Free usage is excluded from billable usage, so you’re only charged when usage exceeds the included monthly limits.
📊 SLO – Service Level Objectives
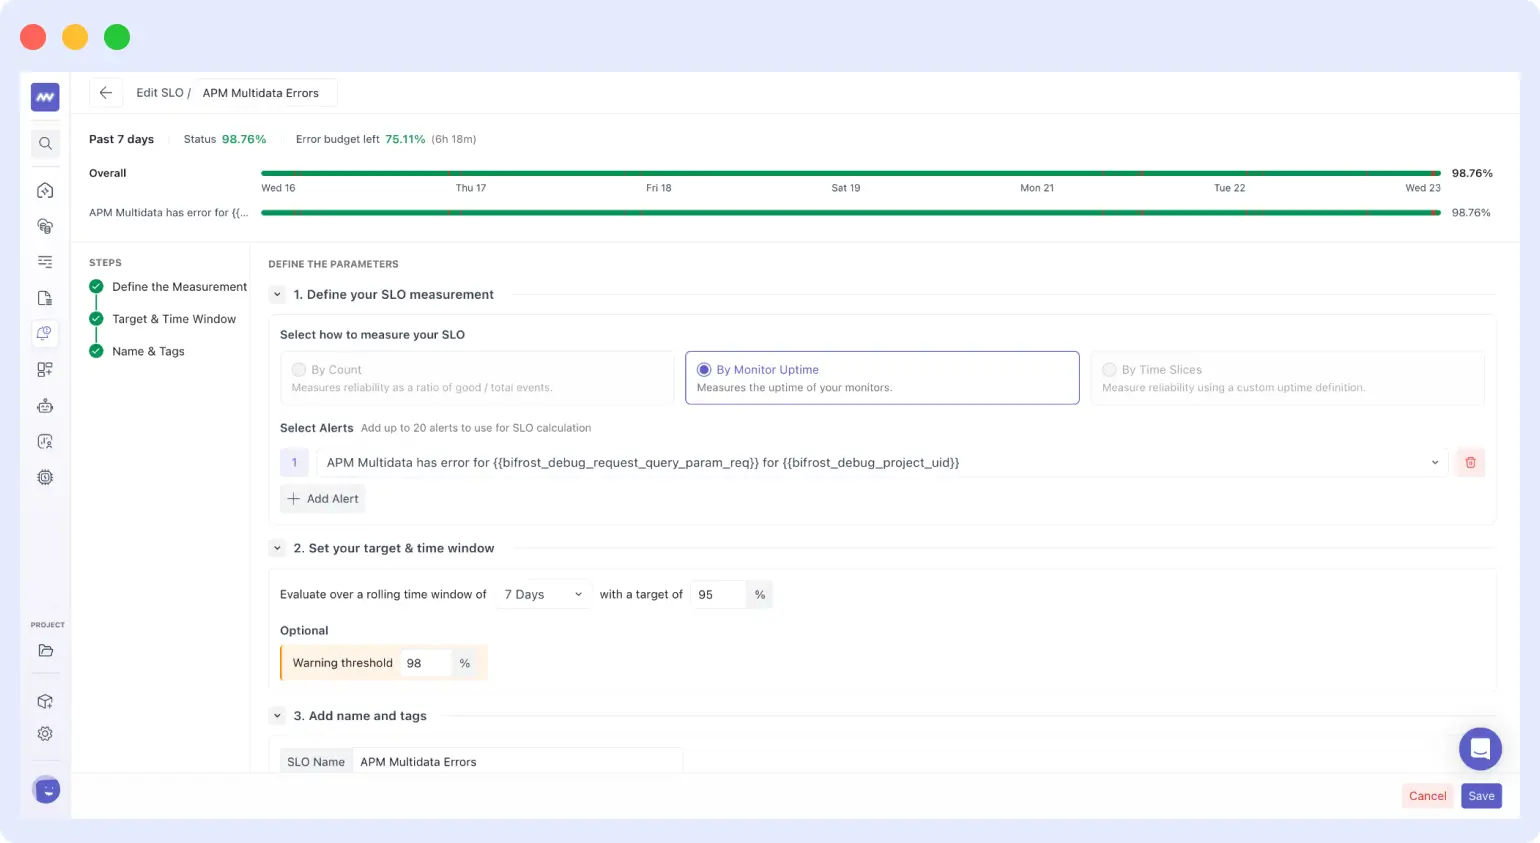
You can now create Service Level Objectives (SLOs) using your existing Middleware alerts.
To create an SLO:
- Select one or multiple alerts
- Set your target reliability
- Choose an evaluation window
- Define a warning threshold
Once created, you can monitor:
- Error budget – how much failure is still allowed before the SLO is breached
- Burn rate – how quickly the error budget is being consumed
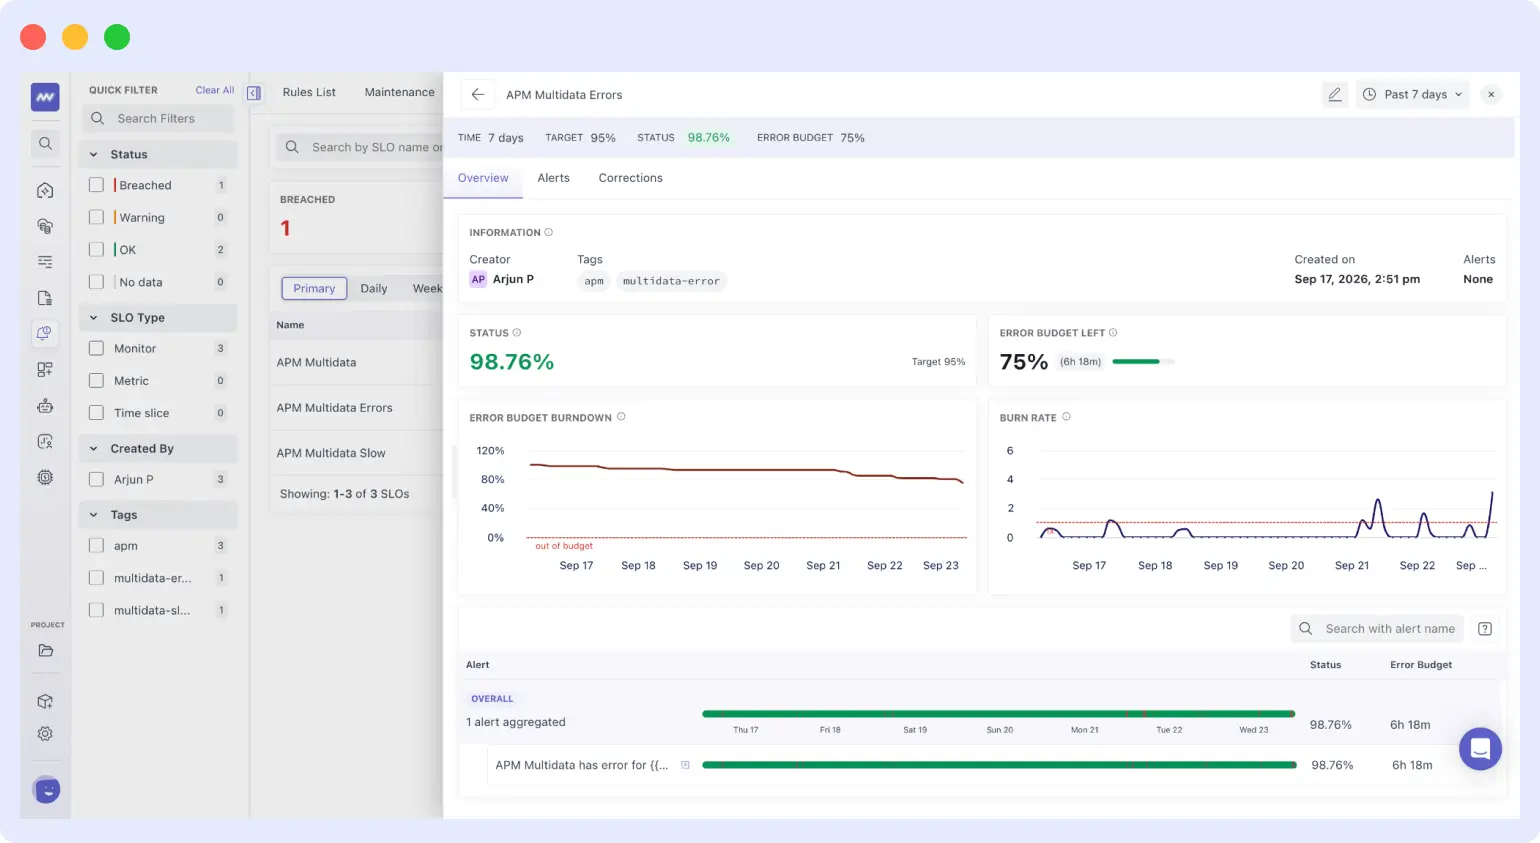
You can also create alerts for an SLO and get notified when it breaches the configured target.
🚨 Alerting Improvements
Default Stability Alerts
Middleware now provides default stability alerts for customer accounts to surface common reliability issues without requiring manual configuration.
Default alerts include:
- Slow database queries
- Kubernetes job failures
- Slow page loading
- API failures
- Slow API responses
Email notifications are enabled by default, so users are notified when one of these alerts is triggered.
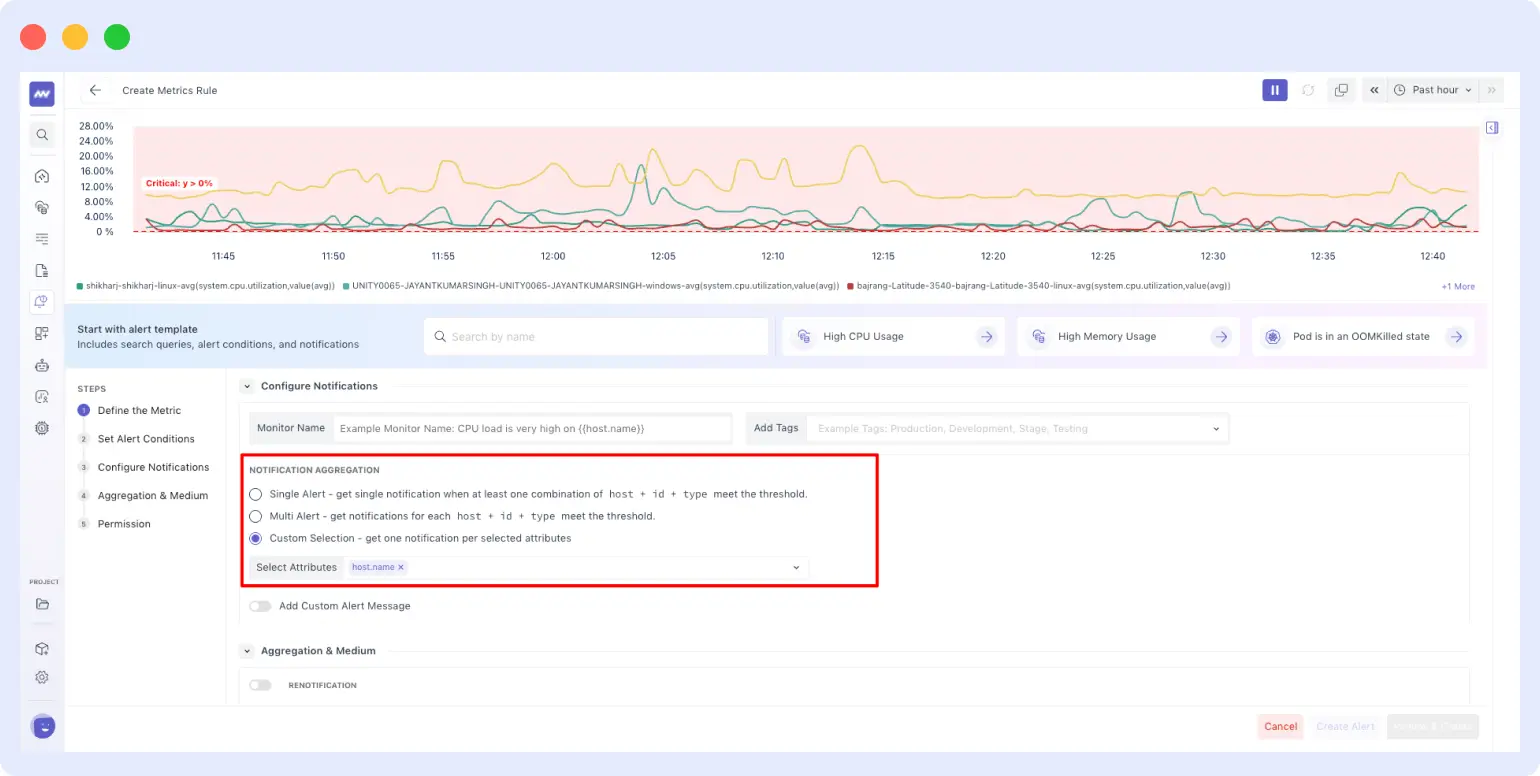
Notification Aggregation
You can now control how notifications are sent for alerts grouped by attributes.
Choose whether grouped alert triggers should:
- Be combined into a single notification
- Generate separate notifications based on the selected grouping attributes
This gives you more control over notification volume for alerts affecting multiple resources.
Alert Trigger History
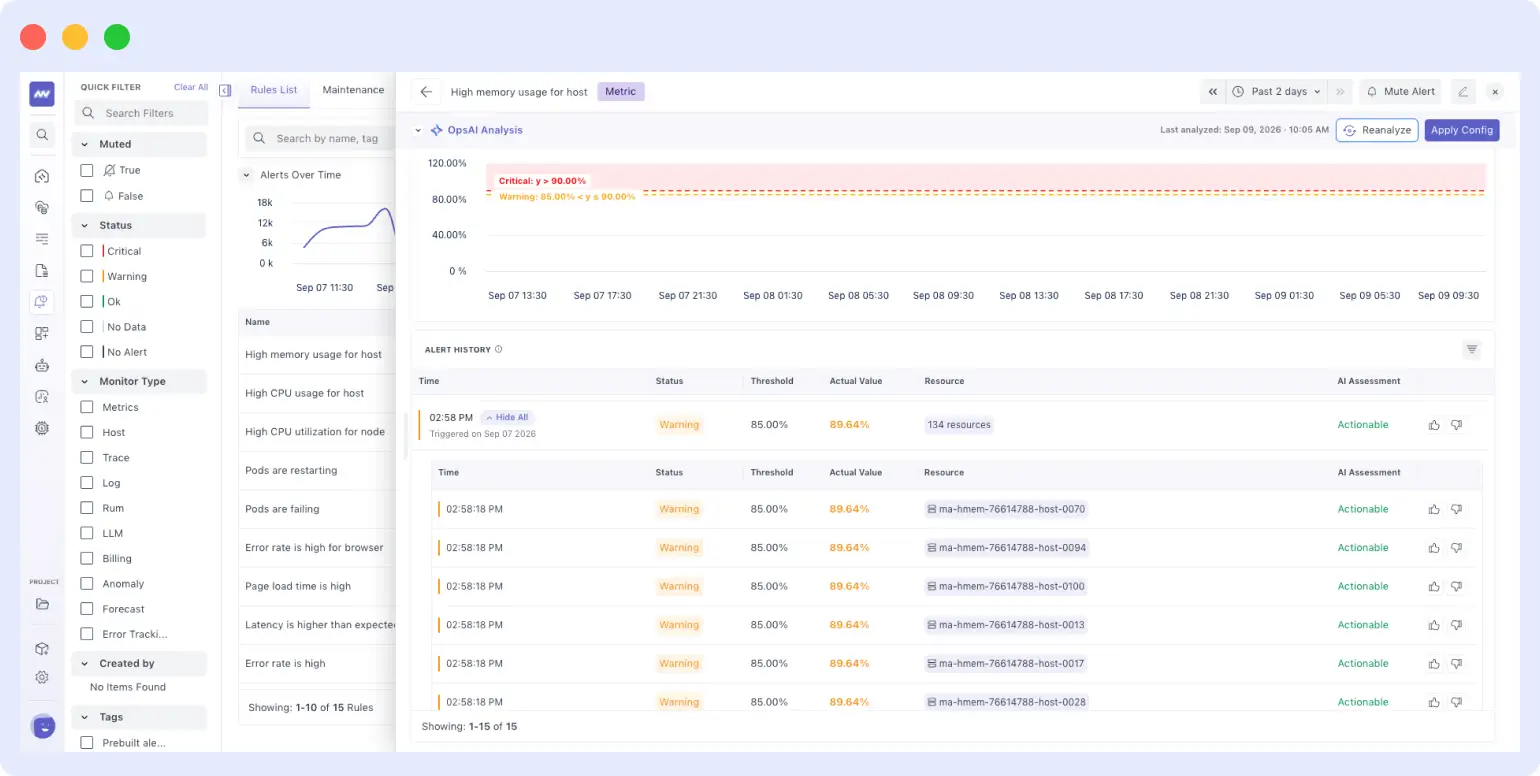
Alert trigger history now shows the status and resource name for each trigger when an alert is grouped by attributes.
This makes it easier to identify which individual resources were affected when the same alert triggers across multiple resources.
Analyze Alerts with OpsAI
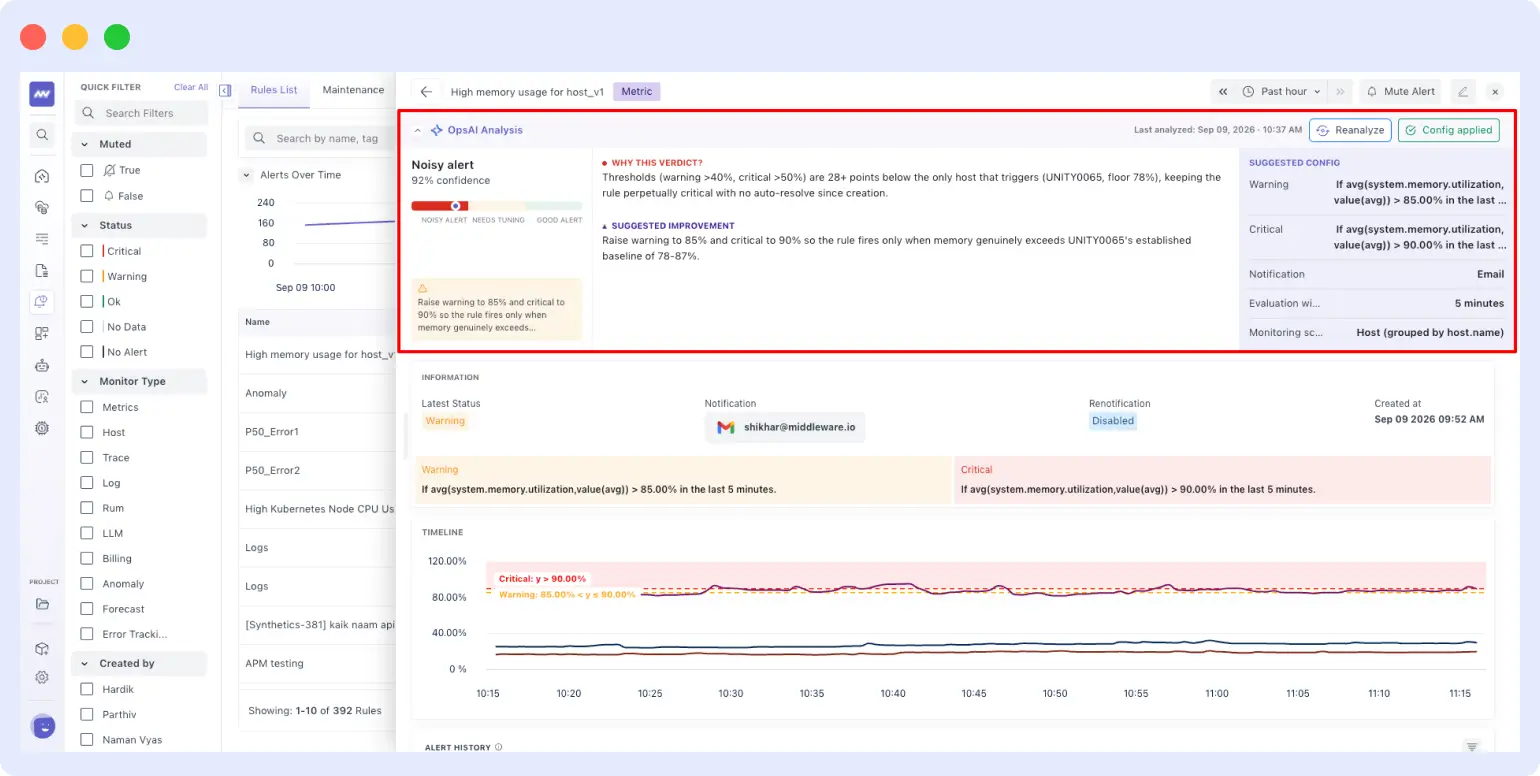
You can now use OpsAI to analyze an alert configuration.
OpsAI can identify potential configuration issues and recommend changes to:
- Alert thresholds
- Trigger conditions
- Other alert configuration
This helps tune alerts and reduce unnecessary or false triggers.
🤖 OpsAI – More Context & Issue Detection
New APM Issue Detection
OpsAI can now automatically detect four additional types of APM issues:
- Large HTTP payloads
- Slow database queries
- Error groups based on stack traces
- Uncompressed assets
These issue types are available by default across all supported APM languages.
Add Logs as Context
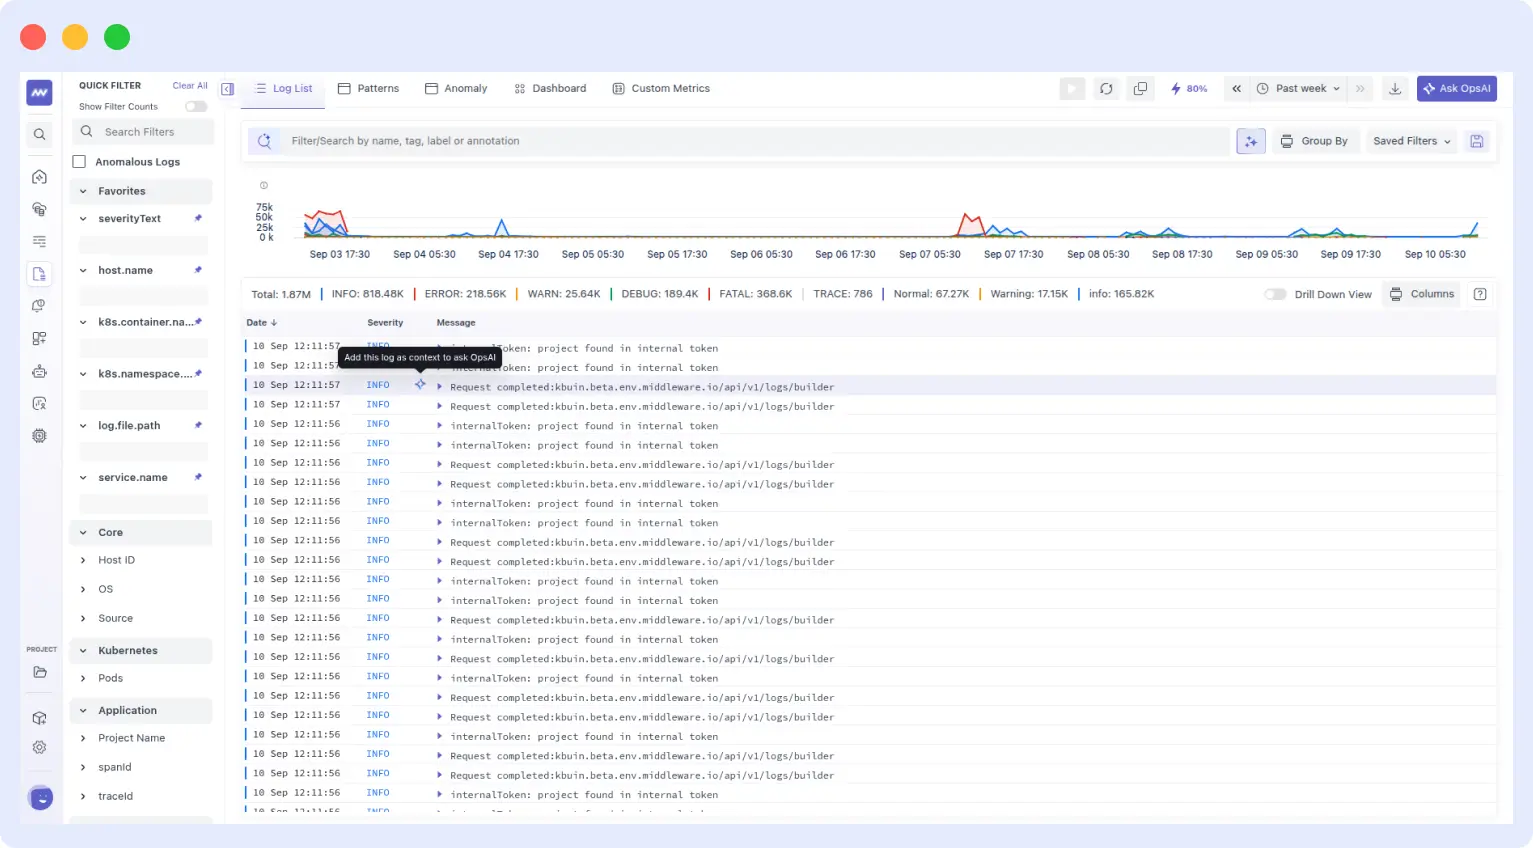
You can now select a specific log and add it directly as context when asking OpsAI a question.
OpsAI uses the selected log along with available observability data to provide more relevant answers during an investigation.
MCP & Performance Improvements
OpsAI also includes:
- Synthetic tools support in the MCP server
- Faster responses for APM, infrastructure, and log-related prompts
- Stability fixes for OpsAI responses
- Fixed blank responses after Look for Fix
- Fixed Alert Builder crashes when columns are empty
💬 RCA & Fixes Directly in Slack
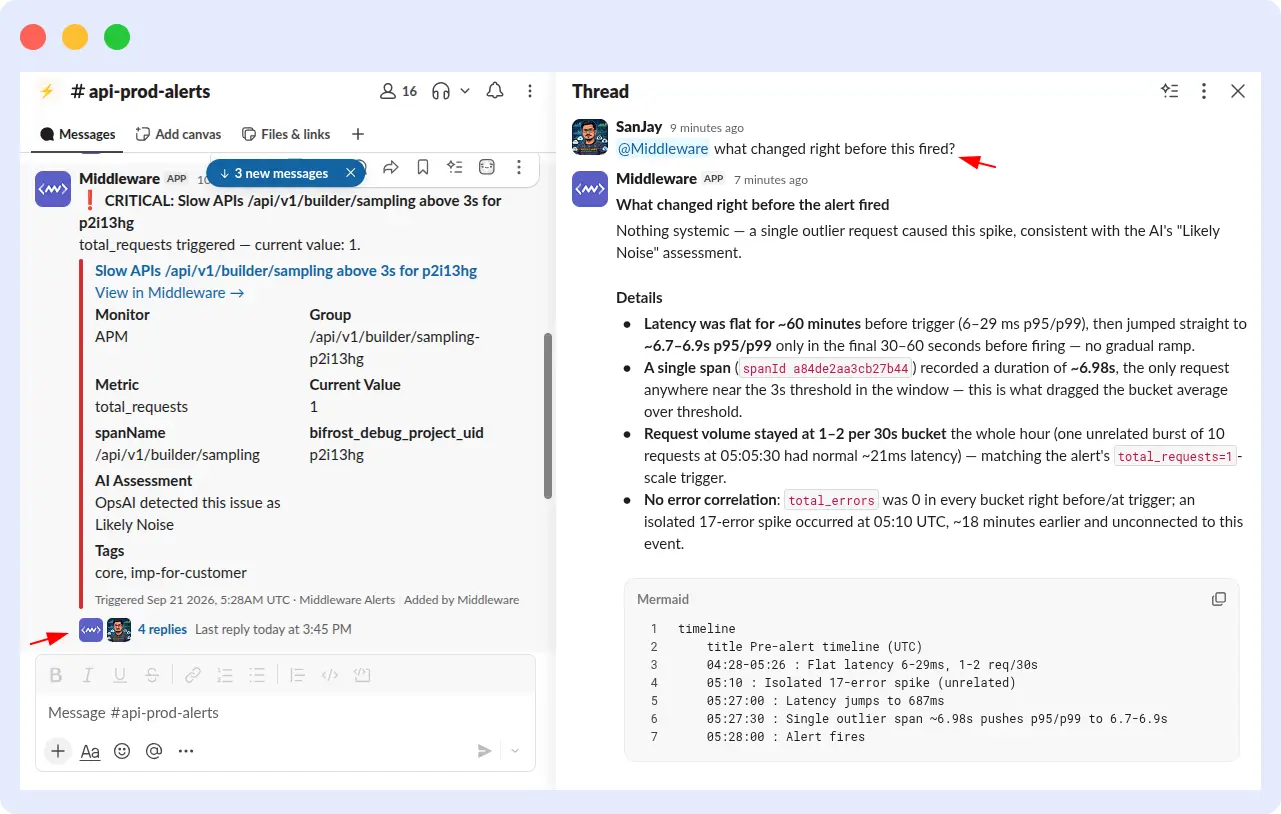
You can now investigate Middleware alerts directly from Slack.
When an alert is posted to Slack, ask questions in the same thread to:
- Investigate the alert
- Get root cause analysis
- Get a proposed solution
- Ask follow-up questions
- Request a PR for the proposed fix
Start OpsAI Chats from Slack
Tag @middleware in Slack to start a new OpsAI conversation and ask questions about your observability data.
Chats are synchronized between Slack and Middleware:
Slack → Middleware → OpsAI → New Chat
Any additional interaction from Middleware is reflected back in the Slack conversation, so the investigation can continue from either place.
📜 Log Monitoring Improvements
Log Anomaly
We’ve updated the Log Anomaly experience with new data and monitoring views across services.
You can now:
- View severity breakdowns
- Analyze anomalies by anomaly type
- View related logs
- Open detailed anomaly analysis
- Investigate the potential cause of an anomaly
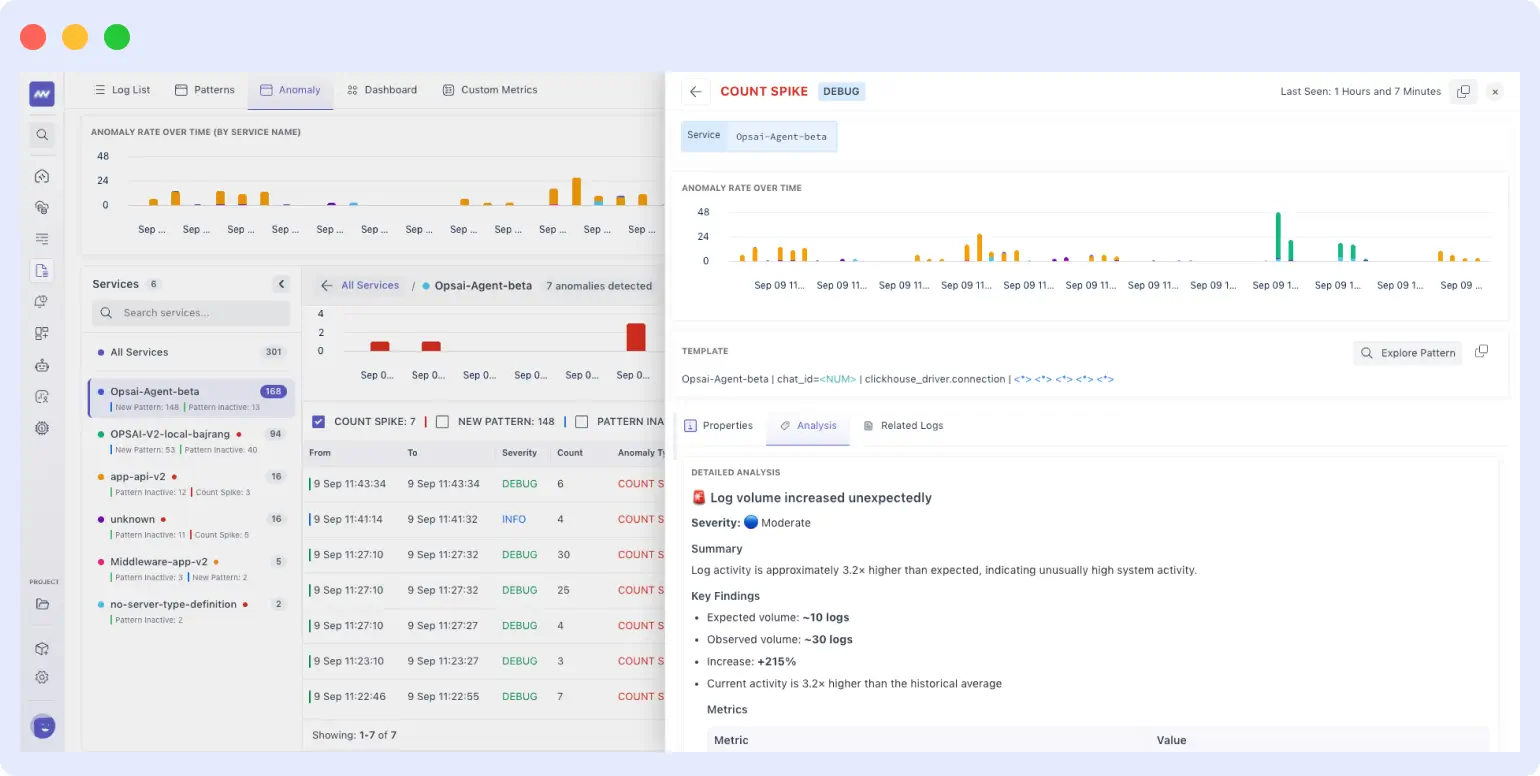
This provides more context around unusual log behavior without having to manually correlate anomalies with individual logs.
Log Patterns
We’ve redesigned the Log Patterns experience with an updated Pattern Explorer and additional context for each detected pattern.
You can now:
- Explore detected log patterns in the new Pattern Explorer
- Identify frequently occurring patterns more easily
- Open a pattern to investigate its details
- View related anomalies directly from the pattern detail view
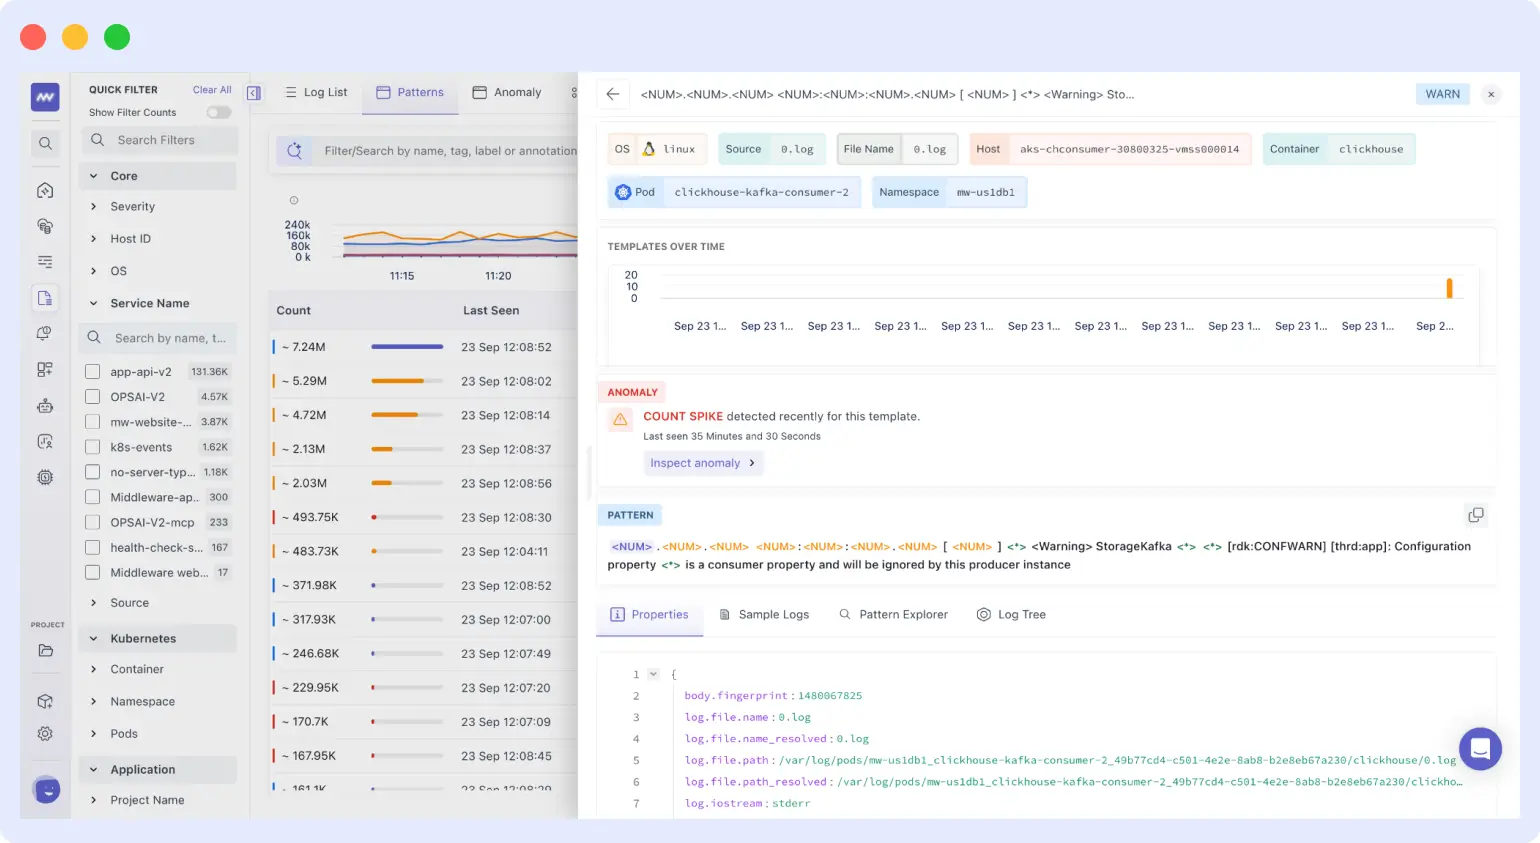
This makes it easier to move from identifying a recurring log pattern to investigating unusual behavior associated with it.
⚡ Node.js Auto-Instrumentation
We’ve expanded Node.js auto-instrumentation to automatically capture exception code across additional frameworks, including:
- Fastify
- Koa
- Hapi
- Other supported Node.js frameworks
Captured exceptions are available directly in the Errors tab within APM traces, providing more code-level context when debugging application errors.
🌐 RUM Improvements
We’ve updated the RUM SDKs to the latest package versions for improved performance and stability.
This release also includes:
- Pipeline code optimizations
- Additional pipeline validation
- General stability improvements
🎨 Navigation & UI Improvements
Redesigned Left Navigation
We’ve redesigned the left navigation to make projects and account-level settings easier to access.
Updates include:
- Restructured project listing
- Project search
- Clearer indication of the currently selected project
- Installation moved outside project navigation
- Settings moved outside project navigation
This provides a clearer separation between project-specific monitoring and account-level configuration.

