



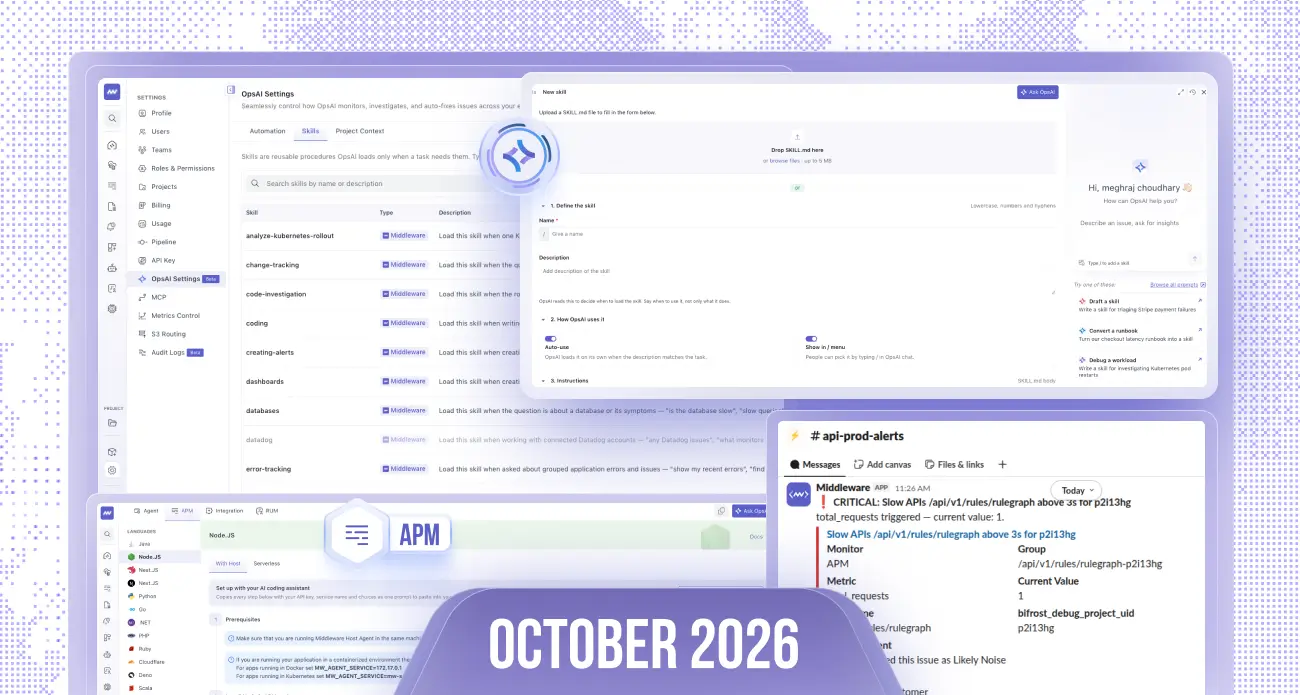
October’s updates include new OpsAI skills, Flutter web support, an Oracle Cloud Infrastructure integration, advanced search, and log field extraction. We’ve also updated the RUM and APM installation flows, expanded dashboard functions, and added controls for data ingestion.
OpsAI
Built-in and Custom Skills
OpsAI now includes built-in skills for incident investigation, error analysis, latency troubleshooting, infrastructure health, Kubernetes, logs, metrics, traces, RUM, synthetics, databases, LLM observability, dashboards, alert creation, and code investigation.
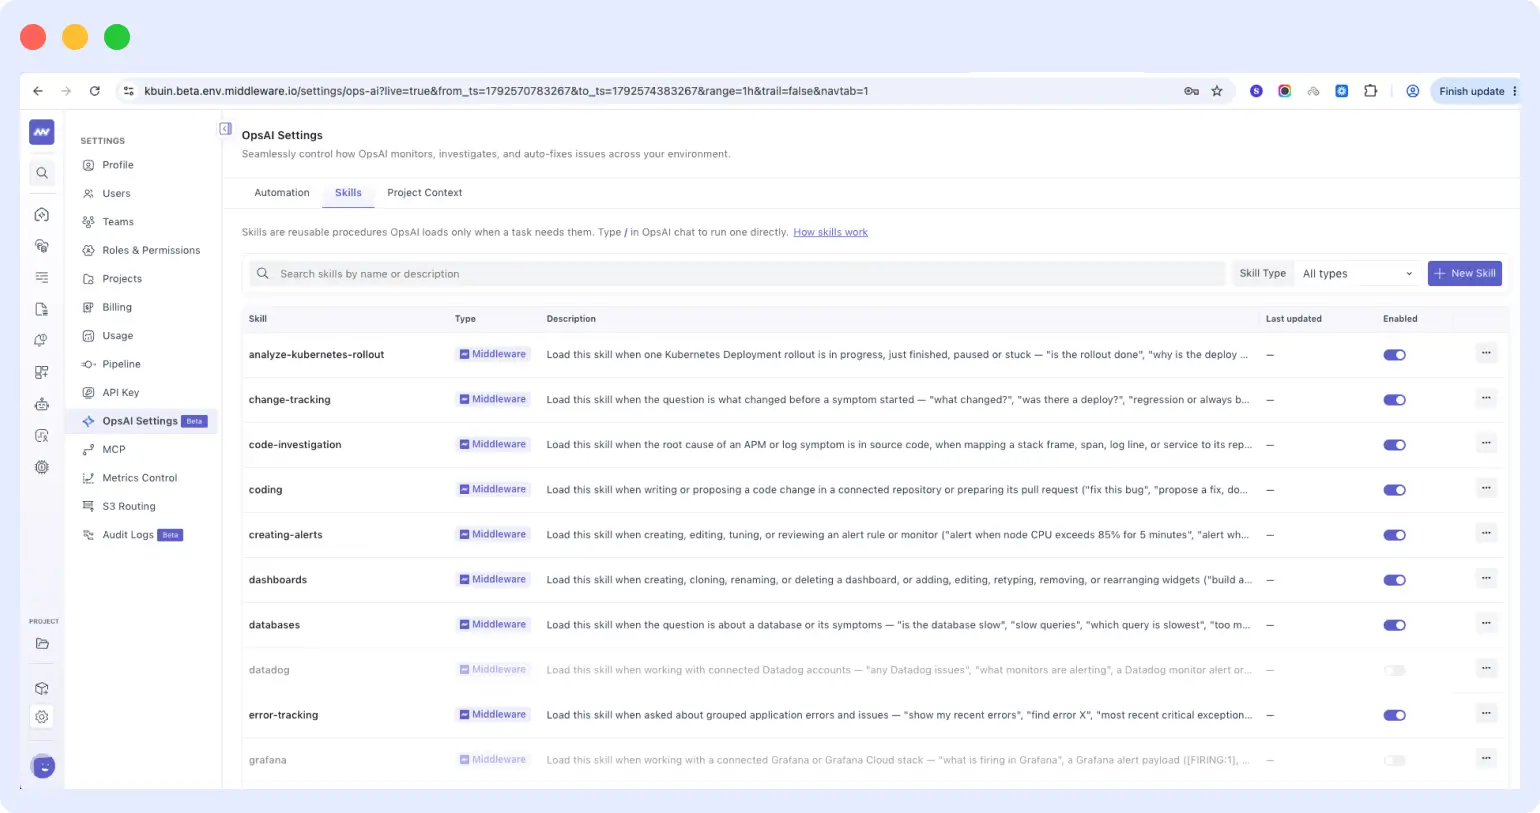
Skills provide instructions for specific tasks. You can:
- Type / in OpsAI chat to browse and run a skill.
- Import custom skills or create new ones by writing instructions.
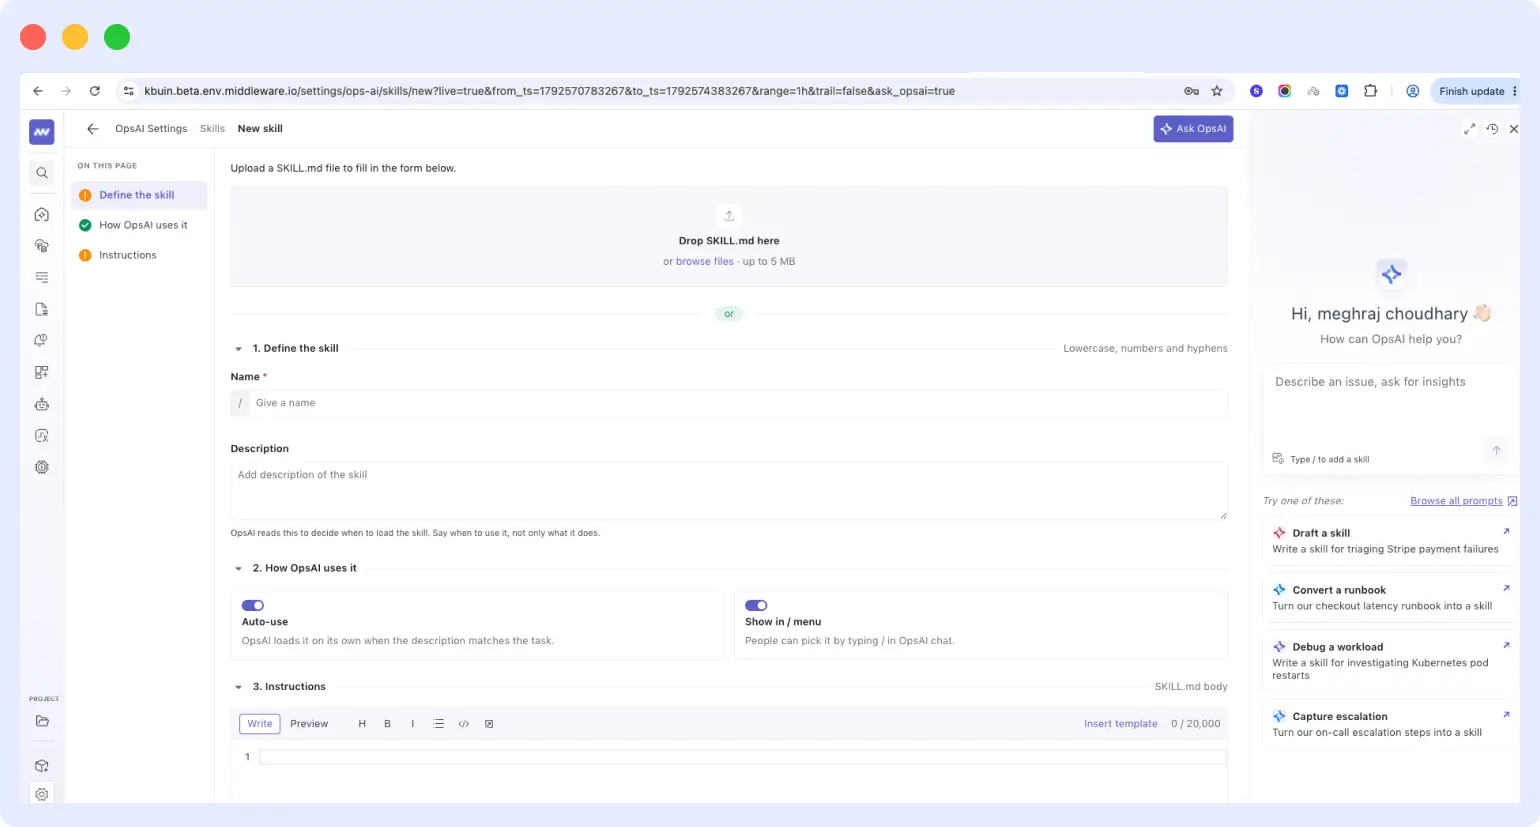
- Let OpsAI agents automatically select relevant skills based on the task.
Project Context
Add project-specific instructions about your application, infrastructure, and requirements. OpsAI automatically uses this context in every new chat and issue investigation to guide its analysis and suggested fixes.
Additional Performance Issue Detection
OpsAI now detects additional performance issue types in APM, helping identify sources of latency, repeated calls, and inefficient resource loading:
- Large HTTP payloads
- Slow database queries
- Uncompressed assets
- N+1 database queries
- Consecutive database queries
- Consecutive HTTP calls
- N+1 API calls
- HTTP overhead
- Large render-blocking assets
Start Fixes from Slack
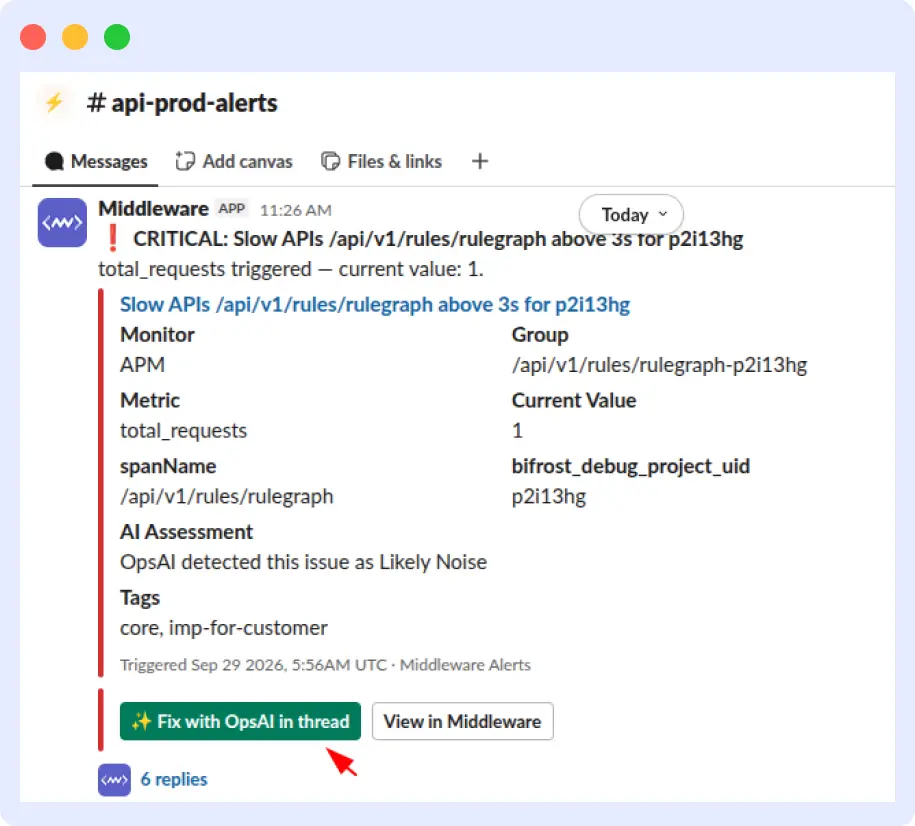
Slack issue notifications now include a Fix with OpsAI button. Use it to start the OpsAI fix workflow directly from the notification.
Investigation Improvements
- Fixed stability issues in the workflow from code changes to pull requests, agent delegation, and the incident panel.
- Issue detail tabs now update their data based on the issue type, showing context relevant to the investigation.
Real User Monitoring
Flutter Web Support
RUM now supports Flutter web applications. Instrument your Flutter app in the browser to collect the same events and attributes available for Flutter mobile apps.
Updated Installation Flow
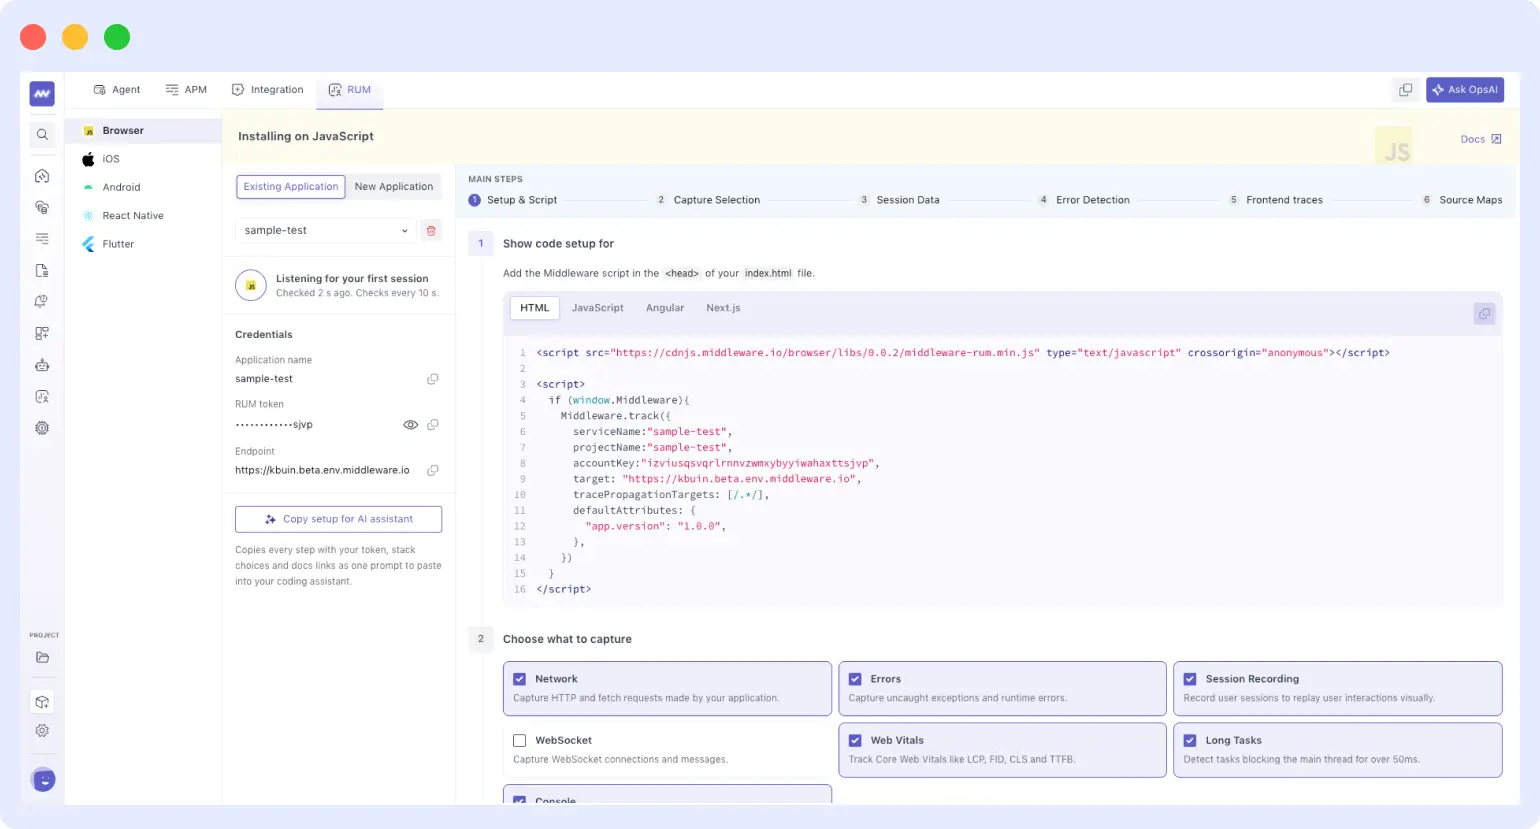
The RUM installation flow now includes setup through an AI assistant and a check to verify that data is being received.
To set up the SDK:
- Copy the installation prompt from the AI assistant setup option.
- Paste it into an AI assistant in your IDE. The prompt guides the assistant through running the required installation commands and updating the relevant application files.
- Check whether Middleware is receiving RUM data to verify the installation.
Network Capture and Session Recording
- Separate capture options: Configure headers and response bodies independently to control what network data is collected.
- Iframe recording: Added support for capturing iframe content in session recordings.
- SDK fixes: Fixed issues with capturing the cf-id and cf-cache-status headers.
Oracle Cloud Infrastructure Integration
Connect your Oracle Cloud Infrastructure (OCI) tenancy to collect performance metrics from supported services.
The integration includes:
- Support for 10+ OCI services.
- Collection of 180+ metrics.
- A default dashboard for each supported service to view its metrics.
The integration currently supports authentication through an API key.
APM Installation and Integration Updates
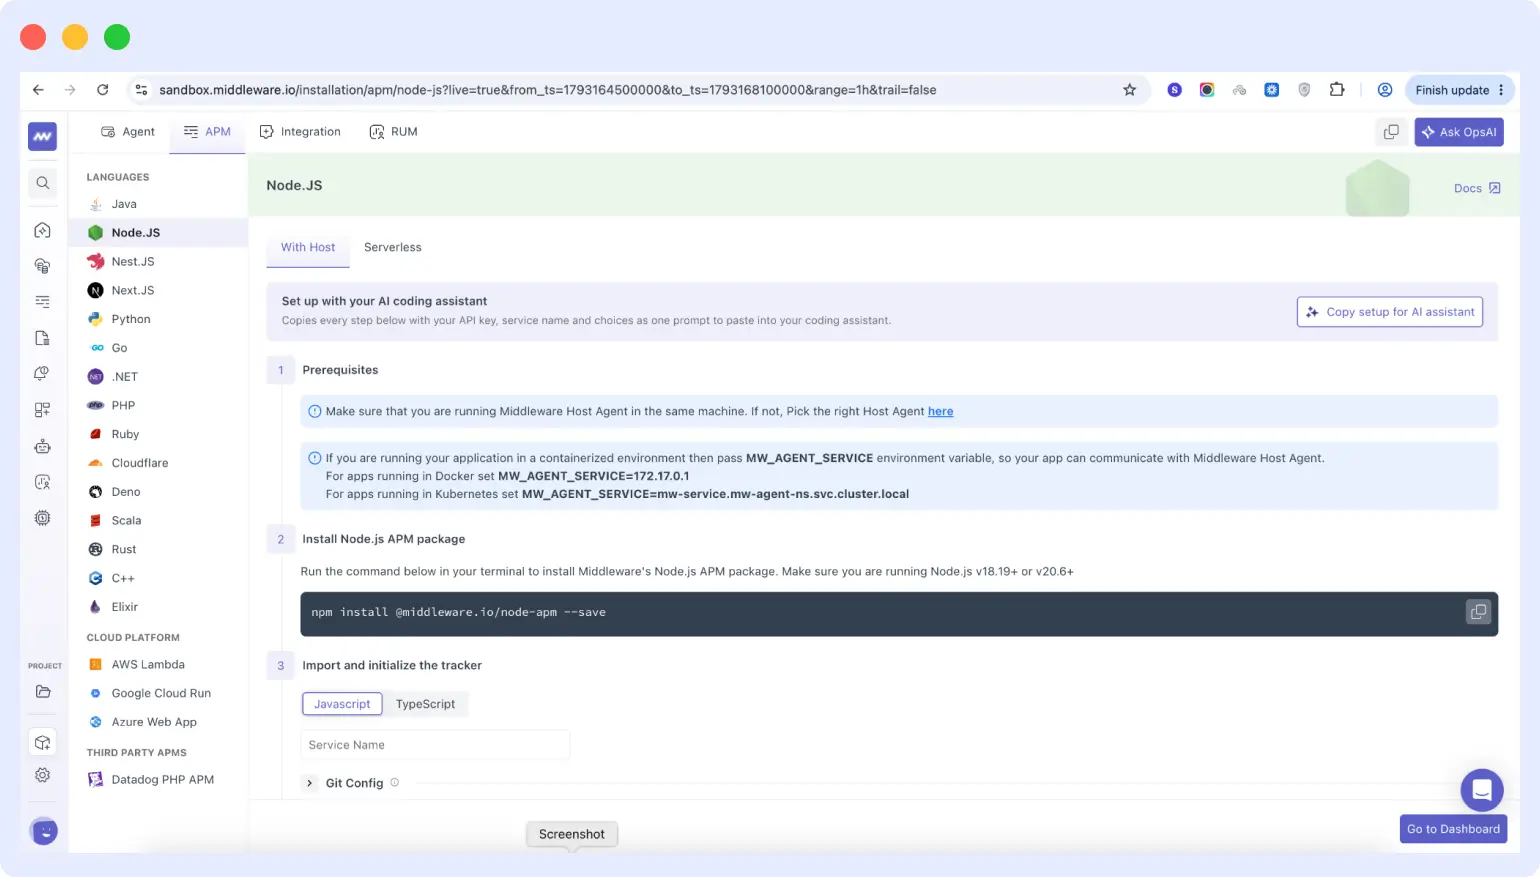
Setup with an AI Assistant
The Copy setup for AI assistant option is now available for most APM language installation guides. Copy the setup instructions into your AI assistant to help configure application instrumentation.
Instrumentation Updates
- .NET: Installation now detects the .NET version in your environment and selects the appropriate OpenTelemetry version.
- IIS: Fixed infrastructure-to-trace mapping for IIS applications.
- Rust, C++, and Elixir: Updated the OpenTelemetry installation instructions for APM instrumentation.
Search and Log Monitoring
Advanced Search
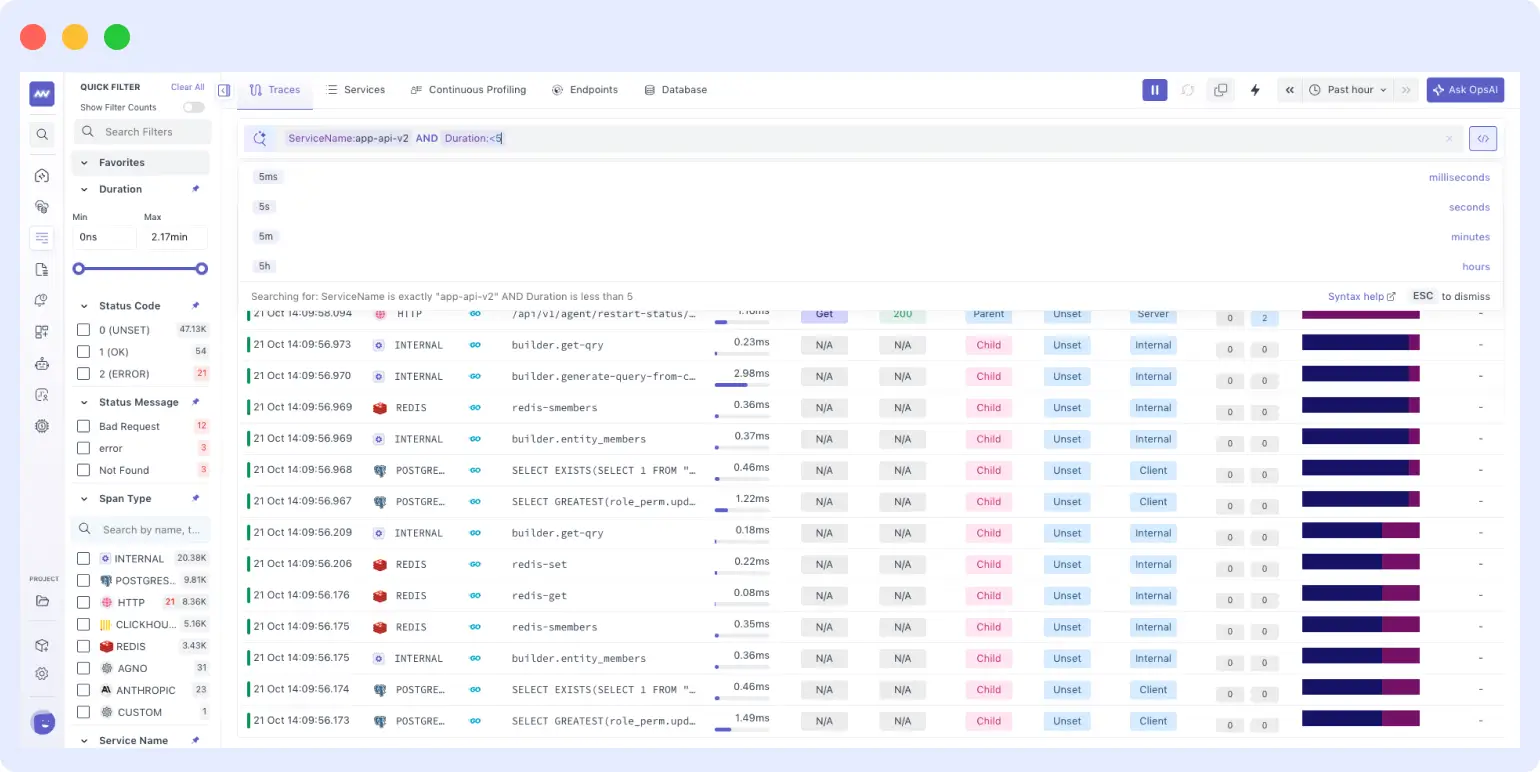
Search in APM and Logs now supports AND, OR, wildcards, and regular expressions, with query suggestions as you type.
Combine conditions to narrow down logs or traces, or use pattern matching when you need to search across multiple attribute values.
Advanced search is available in APM and Logs. Support for Infrastructure and RUM is coming soon.
Extract Fields from Log Messages
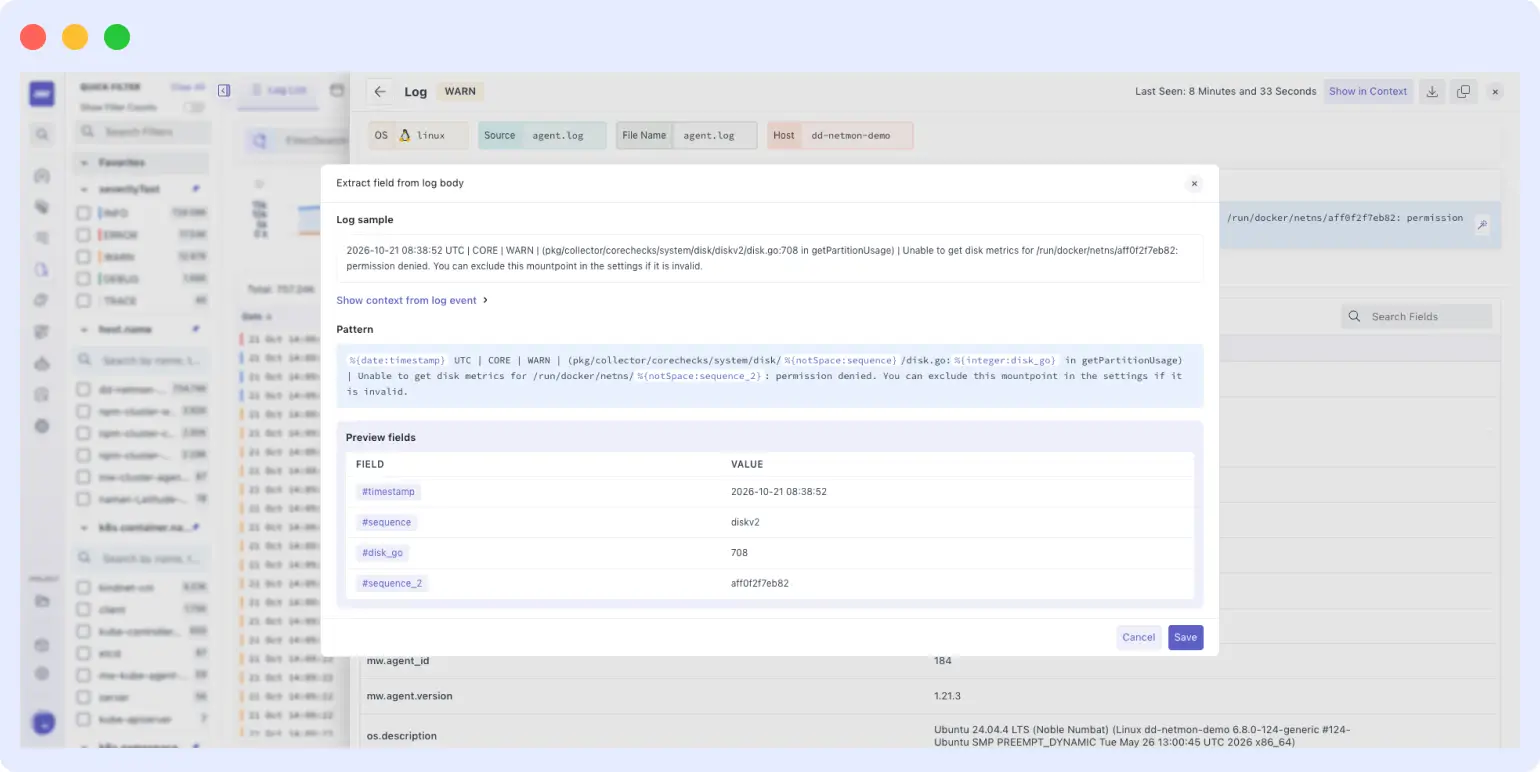
Extract fields from a log message and display them as columns in the log list.
To extract fields:
- Go to Logs → Log Details → Log Message.
- Click Log Extractor to automatically extract fields and their values.
- Review the extracted fields and save them.
Saved fields appear as columns in the log list, making their values easier to inspect across entries.
Log Processing and Interface Updates
- Improved log pattern processing and anomaly detection.
- Updated the related logs view under Infrastructure → Pods to use the new log interface.
Dashboard Builder
Additional Functions with the new metrics schema
The v3 schema adds more than 10 function categories, each containing 5–15 functions.
Dashboards across Infrastructure, APM, RUM, and Logs have been updated to use the v3 schema and support the new functions.
Support for most of the same functions as Datadog also improves compatibility when importing Datadog dashboards and alerts, helping maintain data consistency.
Data Ingestion Caps
Set limits for metrics, logs, and traces, as well as RUM sessions and synthetic or browser test executions.
- Data ingestion automatically stops when a configured limit is reached.
- If ingestion stops because of a limit, resume it with a single click.
Availability: Data ingestion caps are enabled on request.
Daily Digest
The Daily Digest now includes an updated layout and additional account health and performance metrics. The daily report brings these metrics together so you can review account health at a glance.
Platform Improvements
- Frontend performance: Updated frontend code to improve loading and overall interface performance.
- Integration audit events: Added audit events for adding and removing GitHub, Bitbucket, Vercel, Datadog, Grafana, AWS, GCP, Azure, and MongoDB integrations. View these events under Settings → Audit Logs.

