When your app slows down in production, it costs lots of money and even drives users away. The major problem is that most profiling tools only work during testing, so you miss the actual issues that only show up when real people are using your product.
Middleware’s continuous profiling runs automatically in production with low overhead. It displays real-time CPU and memory data, not just during testing. You can observe app behavior during deployments, traffic spikes, and scaling. All these are connected to your traces and logs, so you’re not jumping between tools.
What is Continuous Profiling?
Continuous profiling means constantly collecting data about your application while it’s running, especially in production. It helps developers identify which parts of the code consume more resources, detect performance issues early, and optimize the app.
It continuously collects data on CPU, memory, and resource usage, helping you spot issues as they develop rather than after they cause downtime. This means you can detect trends, fix problems early, and proactively optimize code rather than react to user complaints.
Why Continuous Profiling Matters
Performance issues don’t wait for the right time to come up. They hide in production, quietly degrading your app until everything suddenly goes wrong. You learn through angry users or midnight alerts, but it’s too late. Continuous profiling detects issues early.
Memory Leaks
Memory leaks slowly consume resources until your system crashes. With Middleware’s continuous profiling, you can track memory patterns in real time and flag unusual growth before it causes downtime. You will be able to correlate memory spikes with specific deployments to identify which release caused the leak.
For example, a Node.js service that allocates objects per request without garbage collection can gradually leak memory. Continuous profiling highlights allocation growth over time, allowing teams to fix leaks before OOM occurs.
💡 Stop Memory Leaks Before They Crash Your System. Continuous profiling monitors memory growth and alerts you to leaks as they start. Try Now
CPU Spikes
Sudden CPU spikes cause timeouts and slow performance, but without code-level visibility, you’re guessing at the cause. Continuous profiling shows exactly which functions consume excessive CPU. Middleware lets you click any CPU spike and instantly see the flame graph, showing where to optimize.
Performance Regressions
New code can accidentally introduce slowdowns. Middleware’s continuous profiling retains historical data, enabling you to compare performance before and after each deployment. You can compare the previous and latest releases to identify the cause of the increase in CPU usage.
📍Read how to catch deployment issues with Middleware.
High Cloud Costs
According to Flexera’s State of the Cloud report, 30% of cloud spend is wasted due to inefficient resource usage. Inefficient code that runs millions of times daily adds thousands to your cloud bill. Middleware’s continuous profiling identifies the service consuming the most resources, enabling you to optimize as needed.
How Does Continuous Profiling Work in Middleware?
Continuous profiling can seem complex, but Middleware makes it simple to implement and even easier to act on. Unlike traditional profiling tools that require you to juggle multiple platforms or stitch together fragmented data, Middleware provides production-ready profiling with unified observability so that you can see performance bottlenecks in context with your traces, logs, and metrics.
Here’s how Middleware’s continuous profiling works end-to-end and what makes it different.
Zero-Config Agent instrumentation
Most profiling tools require extensive configuration, custom sampling rules, or separate SDKs for different environments. Middleware’s approach is different. Our lightweight agent automatically instruments your application, with profiling enabled by default.
🤖Deploy the Middleware agent to get started with continuous profiling.
How It Works
Once installed, the Middleware agent runs inside your application and observes code execution with less CPU overhead. It automatically tracks:
- Which functions are running and how often they’re called
- CPU and memory consumption per function and service
- Execution duration down to the microsecond level.
👉To improve overall resource use and reduce cloud costs, read our detailed guide on efficient server utilization.
The agent is built to be production-safe from day one. You don’t need to toggle between “dev” and “prod” modes or worry about performance degradation during peak traffic.
Quick Setup for Node.js
This guide uses Node.js, but Middleware works with Python, Go, Java, and others. Setup instructions for other languages are in the documentation.
1. Install the Middleware APM package
2. Initialize profiling in your entry file (server.js, index.js, or app.js).
const tracker = require('@middleware.io/node-apm');
tracker.track({
  serviceName: "your-service-name",
  accessToken: "",
});
That’s it. Continuous profiling is now active. No additional config files, no manual sampling setup, no separate profiler SDK.
Pro tip: Track performance across deployments by adding version tagging.
This lets you compare file data before and after releases to catch performance regressions instantly.
3. Run your application
Middleware dashboard will collect real-time profiling data in seconds.
Why This Matters: Other tools, such as Datadog or New Relic, often require separate profiling installations or paid add-ons. Compare Middleware vs NewRelic to see why Middleware might be the right fit.
With Middleare, profiling, tracing, and logging are unified in a single agent, on a single platform, under a single bill.
⚖️Curious how Middleware compares to other APMs? Check out our Datadog Alternative comparison.
Intelligent Sampling
Many profilers use fixed-interval sampling, which can miss critical performance spikes or generate excessive noise. Middleware uses adaptive sampling that automatically adjusts based on your application’s behavior.
How It Works
Instead of blindly collecting data every time, Middleware’s profiler:
- Takes lightweight stack trace snapshots at optimized intervals
- Focuses sampling frequency on high-traffic functions and hotspots
- Reduces sampling during idle periods to minimize overhead.
This means you get detailed visibility where it matters without being overwhelmed by irrelevant data.
The best part? You don’t configure any of this. Middleware’s agent automatically handles sampling intelligence, balancing accuracy with performance impact.
What You Get
Each sample captures:
- Full call stack context (where the code was executing)
- Resource consumption at the moment (CPU, memory, allocations)
- Associated trace and span IDs
Over time, Middleware collects thousands of these samples to show you exactly where your app is spending its resources, no manual setup or complicated configuration needed.
Smart Aggregation Across Your Entire Stack
Most profiling tools show data at the per-instance or per-container level, leaving you to manually correlate performance across microservices.
Middleware automatically aggregates profiling data across all your services, clusters, and environments, and connects it to distributed traces.
Once samples are collected, Middleware’s backend:
- Groups similar stack traces to identify common execution patterns.
- Aggregates data by service, endpoint, and environment so you can see system-wide trends
- Links profiling data to distributed traces so you see the request behind every flame graph.
- Compare results from an hour ago, yesterday, or your recent release.
Everything updates in real time, so you’re continuously viewing new data.
Why This Is Different
You may notice that a function is slow with traditional profilers, but you won’t be able to identify which downstream services or user requests are causing it.
Middleware addresses this by automatically correlating profiles with traces. When you click on a slow trace in your APM view, you can instantly go to the profiling data for that exact request. No more guessing. No more switching between tools.
💡 Related: Monitor container performance in real time, track resource usage, and troubleshoot issues across clusters with Middleware’s unified observability platform.
Unified Visualization
As mentioned earlier, other platforms require you to switch between separate UIs for profiling, APM, and logging. Middleware consolidates everything into a single, unified dashboard with cross-correlated views that accelerate troubleshooting.
How It Works
Middleware turns your profiling data into interactive, production-grade visualizations:
- Flame Graphs: See exactly which functions consume the most CPU or memory.
- Time-series trends: Track CPU, memory, and allocation rates over time.
- Comparing service levels: Cross-check profiling data across services, versions, and environments.
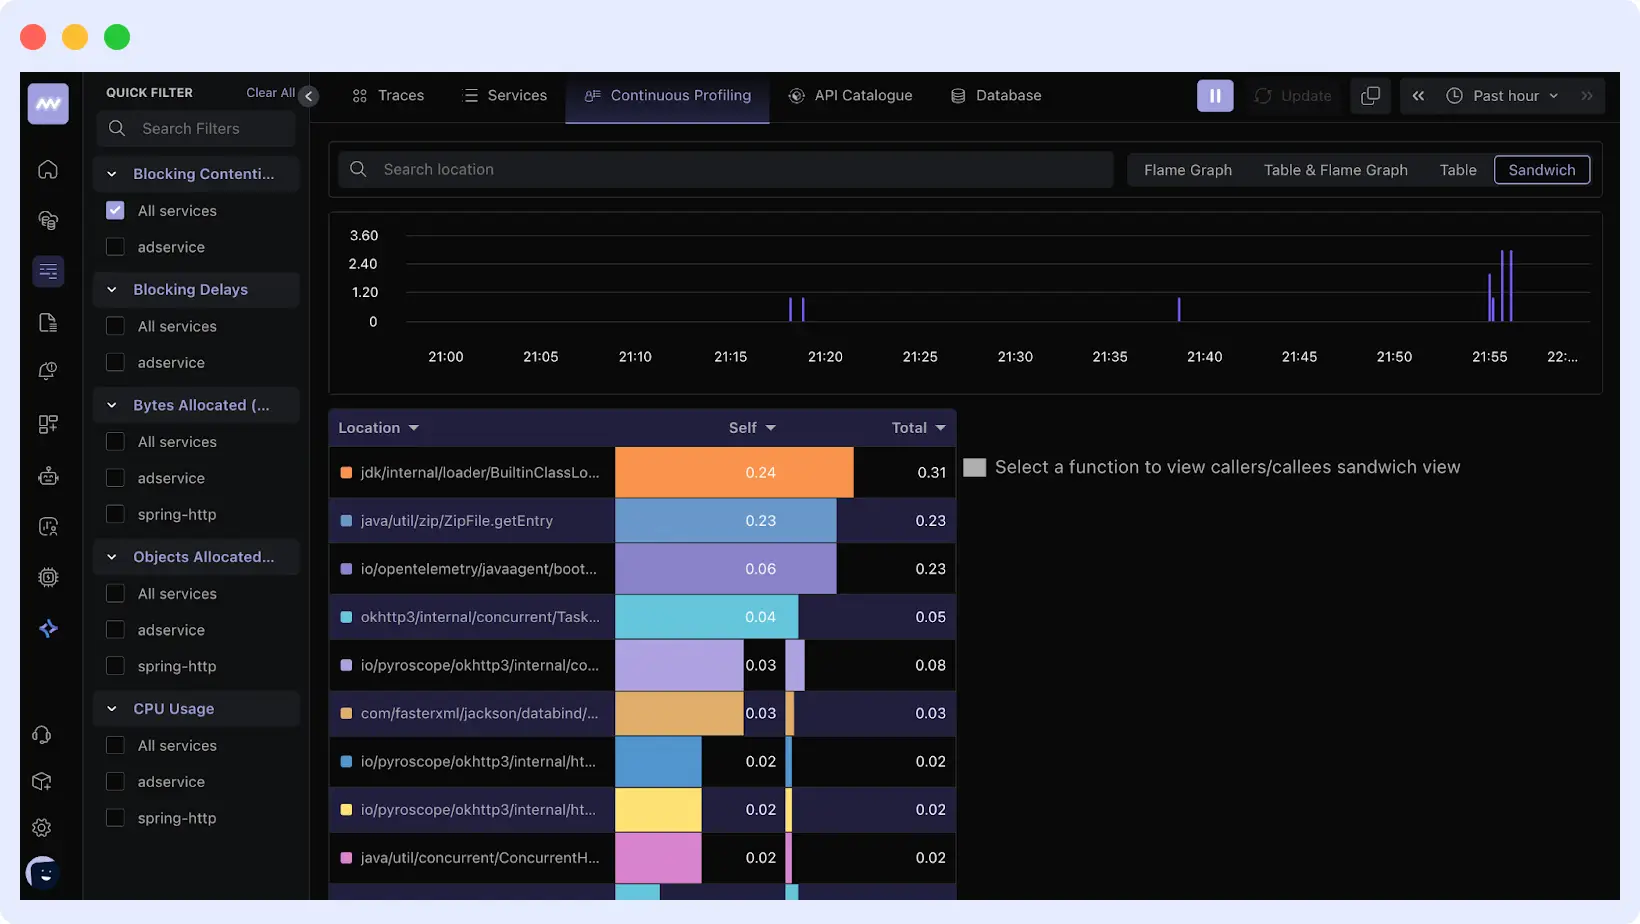
These visualizations let you quickly identify performance issues, compare data to trends, and link profiles to logs, traces, and metrics.
What Are The Common Use Cases of Continuous Profiling?
Beyond basic performance tracking, continuous profiling helps teams uncover hidden inefficiencies, optimize resource usage, and maintain app stability in production. Let’s look at a few key areas where it also helps:
Continuous profiling for CPU-intensive Applications
Some applications consume more processing power than others. Continuous profiling helps identify which parts of the code consume the most CPU time.
It runs in the background to collect data about function calls and CPU usage. This makes it easy to spot inefficient loops, computationally intensive operations, or unnecessary background tasks that slow the app.
With this data, developers can optimize these parts of the code, reduce CPU load, and improve performance.
Detecting Memory Leaks in Microservices
In a microservices setup, each service runs independently (inside its own container), but they often share the same infrastructure resources and node. A small memory leak in one service can gradually accumulate and destabilize the entire system.
Continuous profiling helps by constantly tracking how each microservice uses memory in real time. It identifies unusual patterns, such as memory usage that continues to grow even when the service isn’t doing much, a clear sign of a leak.
Post-deployment Performance Optimization
Even after you deploy an application, performance can still change based on real-world usage, such as high traffic, new data patterns, or infrastructure updates. Continuous profiling helps developers see precisely how the app behaves in production, not just in testing.
By monitoring CPU and memory usage, teams can identify functions or services that run longer than expected, consume excessive memory, or generate unnecessary background work.
This insight makes it easier to tune the code or configuration, like optimizing a slow query, caching heavy operations, or adjusting container resources, without waiting for user complaints or major slowdowns.
Cloud Cost Optimization with Profiling
In most cloud environments, you pay for the resources your application uses (CPU, memory, and storage). Without proper visibility, you might over-provision resources (wasting money) or under-provision them (causing slow performance).
Continuous profiling helps you understand how much compute and memory each service or component actually needs. By analyzing usage patterns, you can make informed scaling decisions.
This way, your application stays fast and responsive while keeping cloud costs under control.
Best Practices for Using Continuous Profiling
If you want to get the most out of continuous profiling, you have to use it correctly. Here are some best practices to follow:
- Profile in production, not just staging
Performance issues don’t always appear in staging environments. Real users, workloads, and traffic patterns behave differently in production. Profiling in production helps you capture what’s actually happening in your app with minimal overhead.
- Set retention and sampling rules properly
Continuous profiling runs continuously, so collecting too much data can become costly. Define clear retention periods and sampling intervals. This makes sure you get useful insights without overwhelming your system or storage.
- Correlate profiling data with metrics and logs
Profiling data is more valuable when viewed in context. Combine it with metrics, traces, and logs to see the full picture, from the code that caused the spike to the system resource it affected.
- Review profiles regularly
Don’t wait for incidents before you check your profiles. Regular reviews help you spot trends, detect slow performance early, and prevent regressions before they impact users.
Conclusion
Continuous profiling lets teams see how their programs use CPU and memory in production. It detects memory leaks and performance regressions before consumers notice.
Ready to identify your performance issues and quit guessing? Install the Middleware agent in less than 5 minutes and get:
- Production-safe continuous profiling
- Automatic correlation with traces and logs
- Real-time flame graphs and performance insights
- One unified platform with no tool-switching required.
Start profiling for free or see it in action with a demo. Start optimizing your applications today and experience better performance, lower costs, and faster troubleshooting with Middleware.
FAQs
How does continuous profiling differ from monitoring?
Regular monitoring shows system-level metrics like CPU or memory consumption, but continuous profiling shows which parts of your code use them and why.
What are the popular continuous profiling tools?
Popular continuous profiling tools include Middleware, Grafana Pyroscope, Parca, Google Cloud Profiler, and Datadog Profiler. These tools continuously collect CPU and memory profiling data from production systems to help teams identify performance bottlenecks.
Why do developers use continuous profiling?
Without waiting for production issues to arise, developers use it to detect performance bottlenecks, resolve memory leaks, and optimize resource consumption.
Can I use continuous profiling with cloud or containerized apps?
Yes. Continuous profiling works perfectly in cloud, containerized, and microservices environments where resources and workloads constantly change.
How does Middleware help with continuous profiling?
Middleware continuously profiles your apps in real time, correlating CPU and memory data with logs, traces, and metrics to help you quickly identify and resolve performance issues.
Does continuous profiling affect application performance?
No. Modern profilers like Middleware run with minimal overhead (typically under 2%) using adaptive sampling.
Is continuous profiling safe for production?
Yes. It’s designed specifically for production workloads and real user traffic.
What languages support continuous profiling?
Most modern profilers support Node.js, Python, Go, Java, and containerized workloads.


