
Summary: Database optimization is the practice of tuning queries, indexes, and infrastructure so your database returns results faster while using fewer resources. Most performance problems come from missing indexes, inefficient queries, or undersized resources, and most can be fixed without rebuilding your system. The biggest mistake teams make is optimizing before measuring, which wastes time and can make performance worse.
TL;DR
- Database optimization tunes queries, indexes, and infrastructure so your database returns results faster while using fewer resources.
- Most performance problems come from one of three layers: query execution, concurrency and connections, or infrastructure. Match the symptoms to the layer before you change anything.
- Start with indexing and query optimization. They fix the most problems for the least effort, and most teams solve their issues before reaching the harder options.
- Common index types include B-tree, hash, clustered, non-clustered, composite, and covering indexes. Most production indexes combine more than one.
- Common query anti-patterns to avoid: SELECT *, OFFSET pagination, N+1 queries, functions in WHERE clauses, and unbounded joins.
- Caching, read replicas, and partitioning can solve performance problems at scale, but they add complexity. Use them only after queries and indexes are clean. Avoid sharding until simpler scaling options are exhausted.
- Track p95 and p99 query response time, not averages. Averages hide the slow queries that hurt users most.
- Observability ties slow queries to the application code, deployments, and infrastructure metrics around them. Tools like Middleware’s Database Monitoring make that correlation possible in one place.
What is database optimization?
Database optimization is the practice of tuning queries, indexes, schema design, and infrastructure so your database returns results faster while using fewer resources. It covers everything from rewriting a single slow query to redesigning how your data is stored and distributed.
Most teams start thinking about optimization when queries that used to run in milliseconds start taking seconds, cloud costs increase, or users begin noticing slow pages. The cause is usually one of a few common problems, and most can be fixed without rebuilding your system. The hard part is identifying the real problem before you start making changes.
How to diagnose a database performance problem
To find the source of a database performance problem, match the symptom you’re seeing to the layer where it occurs, then use the right diagnostic tool to confirm the cause before making any changes.
1. Match the symptom to the likely cause
Before touching anything, identify which symptom you’re seeing. Each one points to a different root cause.
| Symptom | Likely cause | First thing to check |
|---|---|---|
| Slow page loads | Missing indexes or slow queries | Run EXPLAIN on the queries behind your slowest endpoints |
| High CPU usage | Full table scans or too many concurrent requests | Check slow query logs for queries not using indexes |
| Lock waits and deadlocks | Long-running transactions or wrong isolation level | Find transactions staying open longer than a few seconds |
| Connection pool exhaustion | Pool sized wrong or transactions holding connections | Check active vs idle connection count during peak traffic |
| Replication lag | Write-heavy primary or under-provisioned replicas | Compare write throughput on primary to replica apply rate |
Once you’ve matched the symptom to a likely cause, the next step is to understand which layer of your database the cause comes from.
2. Identify which layer the problem lives in
Database performance problems can show up at different layers of your system. Knowing which layer your problem comes from tells you which techniques to apply.
- Query execution layer: Your queries, indexes, and table statistics live here. Problems look like slow individual queries, full table scans, or the planner picking a bad execution path.
- Concurrency and connection layer: Connection pools, locks, and transaction isolation belong to this layer. Problems show up as lock waits, deadlocks, or connection pool exhaustion under load. The database itself may be healthy, but requests pile up because they’re fighting each other for connections or rows.
- Infrastructure and architecture layer: This layer covers your hardware, your replication setup, and how your data is spread across machines. You’ll see a primary database that can’t keep up with writes, replicas falling behind, or a single node maxing out on CPU or memory.
Once you know which layer your problem comes from, you need the right tools to confirm it.
3. Use the right tools to diagnose performance issues
The four tool categories below cover most database performance diagnosis. They are execution plan analyzers, slow query logs, database-native statistics views, and APM platforms.
EXPLAIN and EXPLAIN ANALYZE
These show the execution plan your database picks for a query, including which indexes it uses and how many rows it scans. Use EXPLAIN for a quick plan inspection. Use EXPLAIN ANALYZE in PostgreSQL when you need real timing numbers. Note: EXPLAIN ANALYZE actually executes the query, so never run it against INSERT, UPDATE, or DELETE in production.
Slow query logs
MySQL’s slow_query_log and PostgreSQL’s log_min_duration_statement capture any query running longer than a threshold you set. Start at 500ms or 1 second, and review the log regularly rather than waiting for users to complain.
pg_stat_statements and MySQL Performance Schema
These give you aggregate statistics across all queries. You see how often each query runs, total time spent, average time, and rows returned. Slow query logs show you the worst individual queries, but these views show you which queries cost you most overall.
APM and database monitoring tools.
Application performance monitoring tools trace slow queries back to the code that triggered them. Without this, you’re matching timestamps across separate dashboards and guessing. Middleware’s Database Monitoring connects query-level data with application traces and infrastructure metrics in a single view, so you find the cause instead of narrowing down suspects.
For a comparison of the major options, see this guide to database monitoring software.
What are the best database optimization techniques?
The best database optimization techniques are indexing, query optimization, connection pooling, caching, read replicas, partitioning and sharding, and routine maintenance. Start with indexing and query optimization, since most performance problems get solved there before you need the more complex options.
1. Indexing
An index lets the database skip rows it doesn’t need. Without one, the database scans the entire table. With the right index, it jumps straight to matching rows.
Index types fall into different categories: some describe how the index is built (B-tree, hash), some describe how it relates to the table (clustered, non-clustered), and some describe its design (composite, covering). A single index can fit more than one category, so most production indexes are a combination.
| Types | How it works | When to use |
| B-tree | Stores the column values in a sorted tree so the database can find a row or a range of rows fast. | The default for most workloads. |
| Hash | Maps each column value to its row using a hash, so the database can jump straight to it. Only works for exact matches. | Only when you need exact-match lookups and B-tree isn’t fitting the job. |
| Clustered | Stores the table rows in the order of the index, so a lookup goes straight to the row without an extra step. | Primary key lookups and range scans, and the default for MySQL with InnoDB. |
| Non-clustered | Keeps a separate structure that points back to the table row, which adds one extra read per match. | Any secondary index, and the default for PostgreSQL. |
| Composite | Indexes multiple columns together in a set order. | When queries filter, join, or sort on more than one column. Put the most selective column first. |
| Covering | Includes every column the query needs, so the database can answer from the index alone without reading the table. | Read-heavy queries on wide tables. |
Rule: Every index slows down inserts, updates, and deletes. Add only the indexes your queries actually use, and review them regularly. An unused index reduces write performance without improving reads.
The key tradeoff: Every index slows down inserts, updates, and deletes because the database must update the index too. Over-indexing a write-heavy table makes the whole system slower. Use pg_stat_user_indexes in PostgreSQL or sys.schema_unused_indexes in MySQL to find and drop indexes nothing is using.
-- Full table scan on a 10M-row table
SELECT id, email FROM users WHERE last_login_at > '2026-01-01';

-- Add an index on the filter column
CREATE INDEX idx_users_last_login_at ON users (last_login_at);

-- The query now uses an index range scan, often much faster
When to use this: Any time a query filters, joins, or sorts on an unindexed column, or when EXPLAIN shows a full table scan on a table larger than a few thousand rows.
2. Query optimization
Query optimization means rewriting queries so the database does less work to return the same result. Indexes help the database find rows faster, but a badly written query can still drag, even on a well-indexed table.
How to optimize slow SQL queries
To optimize a slow SQL query, run EXPLAIN to find what the planner is doing, then rewrite the query to avoid the expensive operations.
Common anti-patterns to avoid:
- SELECT *: Reads every column even when you only need a few, wastes I/O and memory, and blocks covering indexes from working.
- OFFSET pagination on large tables: OFFSET 100000 makes the database scan and discard 100,000 rows before returning the next page. Use keyset pagination instead.
- N+1 queries: Common with ORMs, where one parent query triggers a follow-up query for every row. Use eager loading or a single join.
- Functions in WHERE clauses: Wrapping an indexed column in a function (like WHERE LOWER(email) = …) prevents the index from being used.
- Unbounded joins: Queries that return millions of rows the application then filters in memory. Add WHERE and LIMIT to keep result sets small.
Rewrites that help
-- Before: correlated subquery, runs once per user
SELECT id, email,
  (SELECT COUNT(*) FROM orders WHERE user_id = users.id) AS order_count
FROM users;

-- After: single join, runs once total
SELECT u.id, u.email, COUNT(o.id) AS order_count
FROM users u
LEFT JOIN orders o ON o.user_id = u.id
GROUP BY u.id, u.email;
Other effective techniques: use EXISTS over IN for existence checks (it stops at the first match), batch multiple single-row updates into one query, and use window functions (ROW_NUMBER(), RANK()) instead of self-joins for ranking and running totals.
Techniques that help:
- JOIN optimization: Index the join columns, and prefer inner joins to left joins when you don’t need the unmatched rows.
- EXISTS over IN: For existence checks, EXISTS outperforms IN with a subquery, since it stops at the first match.
- Batching: One query that updates 1,000 rows is much faster than 1,000 queries that update one row each.
- CTE performance: In PostgreSQL 11 and earlier, the planner couldn’t optimize queries inside a CTE. Postgres 12 fixed that, so check your version.
- Window functions: ROW_NUMBER(), RANK(), and running totals are usually faster as window functions than as self-joins or subqueries.
How to read EXPLAIN output
EXPLAIN shows the plan your database picked for a query: which indexes it used, how many rows it scanned, and what operations it ran. Read the plan from the innermost step outward and look for the patterns in the table below.
Important: EXPLAIN ANALYZE actually runs the query. Never use it on INSERT, UPDATE, or DELETE statements in production unless you intend to execute them.
| What you see | What it means | What to do |
| Seq Scan (PostgreSQL) or type: ALL (MySQL) | Full table scan, the database read every row | Add an index on the filter columns, or rewrite the query to use an existing index |
| Index Scan | The database used an index, good sign | Nothing if the row count is reasonable. Check selectivity if the scan still reads many rows |
| Nested Loop with high row counts | The database joined two tables row-by-row, which is slow at scale | Index the join columns, or run ANALYZE to refresh statistics so the planner picks a hash join |
| Sort on millions of rows | The database sorted in memory or spilled to disk | Add an index that already covers the sort order, so the sort can be skipped |
| Rows: large estimate, actual: small (or vice versa) | The planner’s statistics are stale | Run ANALYZE to refresh statistics so the planner picks a better plan |
PostgreSQL and MySQL show different output formats, but the concepts are the same. PostgreSQL uses EXPLAIN (FORMAT TEXT) by default and EXPLAIN ANALYZE to see actual timing. MySQL uses EXPLAIN for query plans and EXPLAIN ANALYZE (added in version 8.0.18) to see actual timing in tree format.
When to use this: When EXPLAIN shows a query doing more work than necessary, or when a query is slow even with correct indexes in place.
3. Connection pooling
Connection pooling reuses a fixed set of open database connections across many requests, so your application doesn’t pay the cost of opening a new one every time.
Opening a database connection takes time. A TCP handshake, authentication, and session setup can add tens of milliseconds before the first query runs. Pooling avoids that by letting requests borrow a connection, run their queries, and return it. Tools like PgBouncer, ProxySQL, and HikariCP handle this for you. Most poolers offer transaction mode (release after each transaction) or session mode (hold for the whole session). Transaction mode gives you higher throughput but breaks features that rely on session state.
For PostgreSQL, start with a pool size close to the number of CPU cores on the database server, not the application server. If requests wait for a free connection under load, the cause is usually long-running transactions holding connections open, not an undersized pool.
When to use this: Any application that opens database connections per request, or any system where connection counts spike under load.
4. Caching
Caching stores the results of slow queries in fast memory, so repeat requests skip the database entirely.
The most common pattern is an in-memory cache like Redis or Memcached between your application and the database, where your app checks the cache first and only queries the database when the data isn’t there. This works best for read-heavy data that doesn’t change often, like product catalogs, user profiles, and configuration. For slow aggregations, materialized views let the database store precomputed results and refresh them on a schedule.
What are the common caching patterns?
The four common caching patterns are cache-aside, write-through, write-behind, and refresh-ahead. Each defines how data moves between your app, the cache, and the database.
- Cache-aside: The app checks the cache first, and if the data isn’t there, it reads from the database and saves the result into the cache for next time. This is the simplest pattern and the most widely used, but writes go straight to the database without updating the cache, so the cache can fall out of sync.
- Write-through: Every write goes to the cache first, and the cache writes it to the database before confirming. The cache and database always stay in sync, but writes take longer because they have to wait for both.
- Write-behind: Writes go to the cache first and the database update happens later in the background. This makes writes very fast, but you can lose data if the cache crashes before the database catches up.
- Refresh-ahead: The cache refreshes popular entries before they expire, so reads always hit a fresh copy. It works well for predictable traffic, but it’s harder to get right since you have to predict which entries are worth refreshing.
What are the common caching problems?
Caching solves performance problems but adds new ones. The three most common are stale data, cache stampedes, and hot keys.
- Stale data: The cache and database fall out of sync after a write, so the cache returns outdated results. Use TTL so entries expire on a schedule, or event-based invalidation so writes clear them. Avoid caching anything where stale results cause real problems, like account balances.
- Cache stampede: When a popular entry expires, many requests hit the database at once to refresh it. Fix it with a lock so only one request refreshes, staggered TTLs, or refresh-ahead.
- Hot keys: A small number of keys get most of the traffic and overload the cache node that holds them. Spread the load by sharding the cache or replicating those keys across nodes.
When to use this: When the same query runs repeatedly with the same result, or when a slow aggregation hits the database on every request.
5. Read replicas and read/write splitting
Read replicas are copies of your primary database that handle read traffic, so the primary can focus on writes.
In a typical setup, your primary takes all writes and one or more replicas take reads. Replicas stay in sync by copying changes from the primary, and reads scale horizontally as you add more of them. Replication can be asynchronous (faster, but replicas can fall behind) or synchronous (replicas stay current, but writes are slower because the primary waits for confirmation). Most teams pick async and accept a small lag.
To use replicas, send reads to them and writes to the primary. Some applications handle this in code, but a proxy like ProxySQL or Pgpool is cleaner since it routes queries based on whether they read or write. Watch replication lag closely. If a replica falls seconds or minutes behind, reads return stale data and users will notice.
When to use this: When read traffic is overloading your primary, or when you’ve already optimized queries and indexes and need to scale reads further.
6. Partitioning and sharding
Partitioning splits a large table into smaller pieces inside one database. Sharding spreads those pieces across separate database servers. Both reduce the work the database does on any single query, but they solve different problems at different scales.
Partitioning is the simpler option. The database treats the partitions as one logical table, so queries don’t change. The performance gain comes from only scanning the partitions that match the query. The common strategies:
| Strategy | How it splits data | Best for |
| Horizontal partitioning | Splits rows across partitions based on a column value (e.g., orders from 2025 in one partition, 2026 in another) | Tables where queries usually filter by the same column, like date or region |
| Vertical partitioning | Splits columns across partitions, keeping frequently accessed columns in one and rarely accessed ones in another | Wide tables where most queries only need a few columns |
| Range or hash partitioning | Range puts ordered values together (e.g., IDs 1–1M in one partition). Hash distributes rows evenly using a hash of the partition key | Range works for sequential queries. Hash works when you need an even spread |
Sharding takes this further by placing each partition on its own database server. The application or a proxy decides which shard to query based on the shard key. This spreads writes and storage across machines, which solves the problem that partitioning can’t: a single server running out of CPU, memory, or storage.
The problem is the operational cost. Sharding introduces cross-shard queries, distributed transactions, more complex backups, and rebalancing when shards grow unevenly. Do not shard if:
- Your database fits comfortably on one machine, even a large one
- Your write throughput is below what a single primary can handle
- You have not optimized queries and indexes yet
- You have not added read replicas for read traffic
- Your team does not have the operational capacity to manage multiple servers
Most applications scale much further with vertical upgrades, read replicas, and query optimization first.
When to use this: Partition when a single table grows large enough that queries scan more data than they need. Shard when one server can no longer handle your data size or write throughput, and you’ve exhausted the simpler scaling options.
7. Routine maintenance
Routine maintenance keeps your database running well over time by clearing out dead data, updating statistics, and rebuilding structures that drift out of shape.
In PostgreSQL, updates and deletes don’t immediately free space. They leave behind dead rows that VACUUM cleans up. Autovacuum handles this automatically in most cases, but heavy-write tables sometimes need tuning. Run ANALYZE regularly too, since it updates the table statistics the query planner relies on, and stale statistics lead to bad execution plans even when your indexes are correct.
Indexes drift over time too. They can grow fragmented or bloated on tables with heavy updates, and rebuilding them with REINDEX in PostgreSQL or OPTIMIZE TABLE in MySQL restores performance. Archive or purge old data that your application no longer needs. Smaller tables are faster to scan, index, and back up.
When to use this: On a regular schedule for any production database, and any time query performance degrades on a table that used to be fast.
Which database performance metrics should you monitor?
The database performance metrics worth monitoring are query response time, throughput, CPU and memory use, disk I/O, connection pool usage, replication lag, lock waits, and error rates. Track these continuously so you can spot problems early and prove an optimization actually worked.
Many of the thresholds below depend on whether you’re running OLTP (transactional workloads like e-commerce or banking) or OLAP (analytical workloads like reporting and BI).
| Metric | What it tells you | What to watch for |
|---|---|---|
| Query response time (p95/p99) | How long queries take to return | For OLTP, target p95 under 100ms on critical endpoints. Averages hide the tail. |
| Throughput (QPS/TPS) | How many queries or transactions per second | A sudden drop at steady traffic points to an application issue. A sudden spike may mean failed requests are being retried in a loop. |
| CPU utilization | How hard the database server is working | Sustained use above 70-80% leaves no room for spikes. High CPU with low disk I/O points to query inefficiency, not hardware. |
| Buffer cache hit ratio | How often data is served from memory vs disk | For OLTP, target above 99%. For OLAP, 90-95% is acceptable. |
| Disk I/O and IOPS | Read/write volume to storage | When disk I/O reaches storage limits, storage is the bottleneck. Identify whether reads or writes are the cause before scaling. |
| Connection pool utilization | How much of your pool is in use | Above 80% during normal traffic means no room for spikes. Exhaustion usually points to long-running transactions, not pool size. |
| Replication lag | How far behind replicas are | For OLTP with read/write splitting, keep lag under 1 second. |
| Lock waits and deadlocks | How often queries wait on locks or get rolled back | Steady increase usually means transactions staying open too long. Frequent deadlocks point to a schema or query design problem. |
| Error rates | How often queries fail | Track by error type. A failed connection means something different from a rejected insert. |
Important: Numbers only mean something against a baseline. Capture what your metrics look like during a normal week, and update that baseline after major changes. Without a baseline, you can’t tell whether something is broken or simply busier than usual.
OLTP vs OLAP: which metrics matter most for each workload
The same metrics apply to both workloads, but the priorities shift.
OLTP (transactional workloads like e-commerce or app backends): handles many small, fast transactions, such as checkouts, payments, and app backends. Watch p95 and p99 query response time, connection pool usage, lock waits, and replication lag. A 200ms regression on a hot endpoint is a real incident.
OLAP (analytical workloads like reporting and BI): handles fewer, larger queries against bigger datasets, like reporting and BI dashboards. Watch disk I/O, memory use, and query throughput. A 30-second query isn’t a problem if the workload is built around batch analysis.
If you run both, track each one against its own baseline.
How does observability support database optimization?
Observability supports database optimization by showing you how queries actually perform in production, connecting them back to the application code that ran them, and flagging when something changes. Instead of debugging after users complain, you see problems as they happen, including which deploy or which endpoint caused them.
What continuous monitoring gives you that one-time fixes don’t
Continuous monitoring matters because fixing a query once only solves the problem you have today. The next deployment, schema change, or increase in traffic can affect performance again. Monitoring helps you catch those changes early, rather than waiting for users to report them.
Here’s what continuous monitoring gives you that one-time fixes don’t:
- Confirmation that the fix worked: You can see whether a query stays fast over days and weeks, not just on the day you shipped the change.
- Early warning of regressions: If a deployment slows a query, you can spot it before users start reporting problems.
- Visibility into new issues: Queries that were healthy before can become slower as data grows. Monitoring helps you find them early.
- Proof that an optimization helped: Comparing performance before and after a change shows whether the optimization improved the system or simply moved the bottleneck somewhere else.
What does modern database observability look like?
Modern database observability connects database metrics with application activity, deployments, and infrastructure data. Instead of looking at each signal separately, you can see how they relate to each other and identify the cause of a slowdown faster.
Good database observability platforms provide these key capabilities:
- Trace-to-query correlation: Application traces show you which endpoint or service was slow. Observability ties each trace back to the exact query the database ran, so you don’t have to guess which query slowed a particular request.
- Query fingerprinting: Most production queries are parameterized, so the same query runs thousands of times with different values. Fingerprinting groups those variations under a single pattern, making it easier to see which queries consume the most time.
- Deployment correlation: Every deploy is tracked alongside your database metrics. When a query slows down right after a release, you can see which deployment lines up with the change and start your investigation there.
- Regression detection: A query that used to run in 30ms but now takes 300ms is a regression, even if 300ms is still under your alert threshold. Regression detection helps you spot these slowdowns before they affect users.
- Anomaly detection: When a metric moves outside its normal range, such as query volume, response time, or error rate, the system flags it automatically. This helps you catch unusual behavior that traditional alerts may miss.
How Middleware helps with database optimization
Diagnosing slow queries across multiple tools takes time. You check the database for slow queries, the application for slow endpoints, and infrastructure dashboards for resource spikes. Then you compare timestamps to figure out what changed and where the slowdown started.
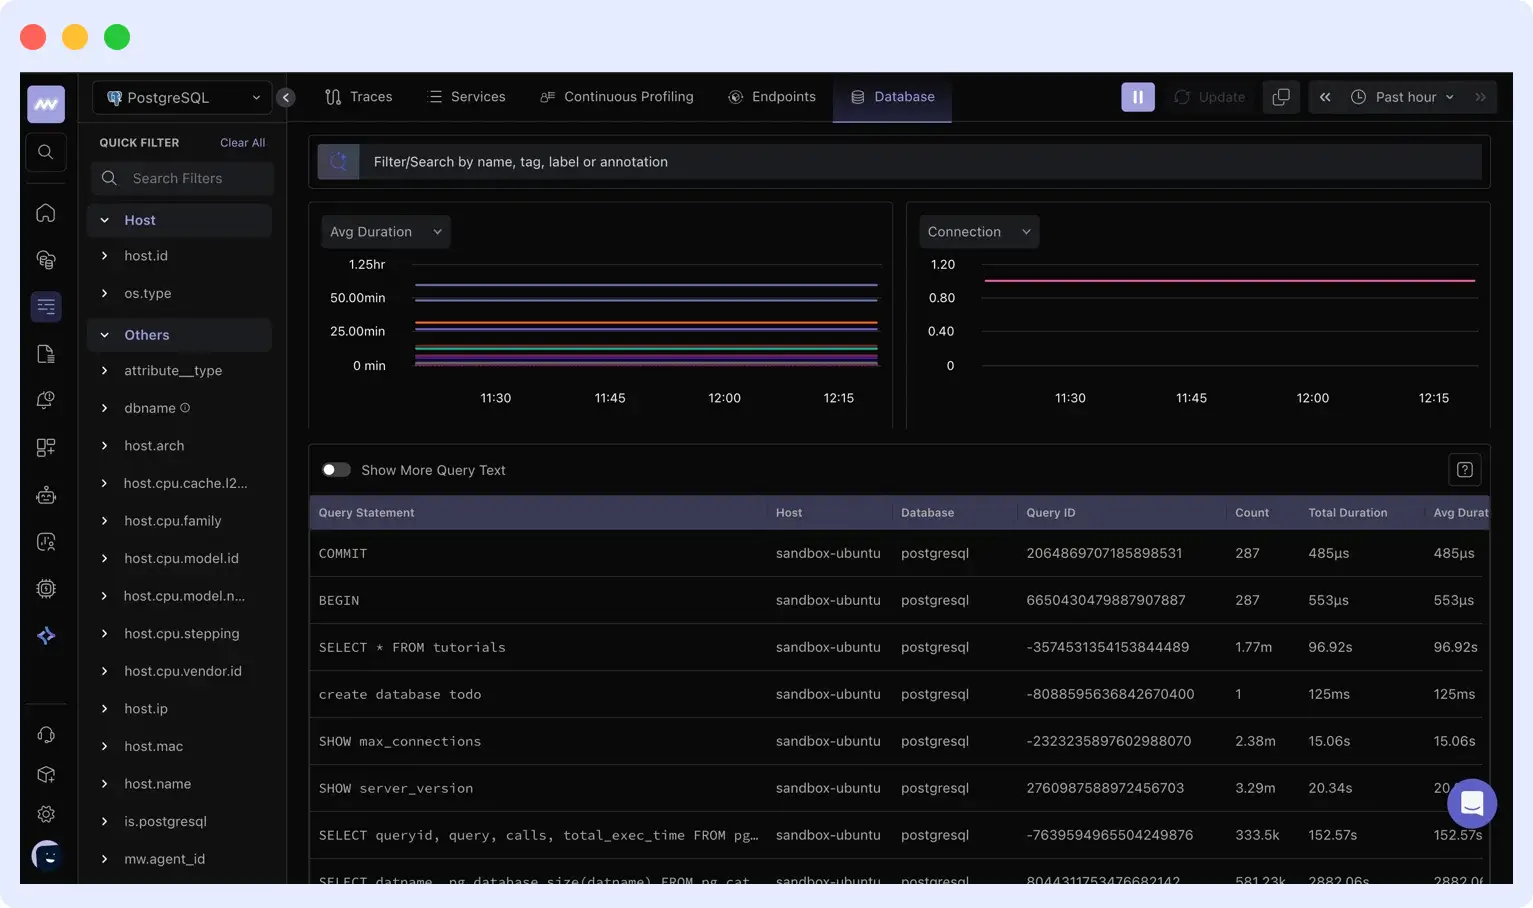
Middleware’s Database Monitoring brings query performance, application traces, infrastructure metrics, and deployment history into a single view.
What you get:
- Database monitoring across major engines: Monitor query performance across MySQL, PostgreSQL, MongoDB, Oracle, AWS Aurora, Google Cloud SQL, and Azure Database. Slow queries are linked to the endpoint or service that triggered them, with full request context.
- Correlation across traces, logs, and infrastructure metrics: View database activity alongside application traces, logs, and infrastructure metrics without switching between multiple tools.
- Deployment tracking: Compare database performance against recent deployments to quickly identify changes that introduced regressions.
- Anomaly and regression detection: Detect unusual behavior and performance regressions early, before they affect users.
- Pre-built dashboards and fast setup: Start monitoring quickly without building custom dashboards or adding complex instrumentation.
A practical example
Let’s say you receive an alert that the p95 latency of your checkout endpoint increased from 180ms to 1.2 seconds. Without observability, you might start investigating the database, network, downstream services, and recent deployments separately.
With Middleware, you open the trace for the affected endpoint and see that most of the delay comes from a query against the orders table. The query averaged 40ms last week and now averages 800ms. The deployment timeline shows a release from two hours earlier that added a new field without the index the query depends on, forcing a full table scan on every checkout request. CPU and memory remain normal, so infrastructure is not the cause.
The fix is to add the missing index. After deployment, the query returns to its previous response time and the endpoint returns to its normal baseline. Instead of spending hours comparing logs, metrics, and dashboards, you can identify the problem and verify the fix from a single place.
Middleware brings database metrics, queries, traces, and infrastructure data together in one place, making it easier to investigate performance problems, validate optimizations, and track the impact of changes over time.
If you want to catch slowdowns as they happen instead of after users report them, Middleware’s Database Monitoring gives you that visibility across MySQL, PostgreSQL, MongoDB, Oracle, and cloud databases.
What are the common database optimization mistakes to avoid?
The most common database optimization mistakes are optimizing before measuring, adding indexes without checking write impact, caching without an invalidation strategy, sharding too early, and relying on averages instead of p95 and p99. Most of these waste engineering time, and some make performance worse than where you started or cause real outages.
- Optimizing before measuring: Teams jump to fixes because they assume they know the problem, then spend hours fixing the wrong layer while the real issue keeps running. Always start with EXPLAIN, slow query logs, or your monitoring tool before you change anything.
- Adding indexes without checking write impact: Indexes speed up reads but slow down writes. Adding too many indexes to fix slow reads can make a heavy-write table slower overall. Keep the indexes your queries actually use, and drop the rest.
- Caching without an invalidation strategy: A cache that serves stale data quietly is often worse than a slow query, because nobody knows the data is wrong until something breaks. Pick an invalidation strategy (TTL or event-based) before you ship a cache, not after.
- Relying on averages instead of p95 and p99: An average response time hides your slowest queries. If your average is 50ms but your p99 is 3 seconds, one percent of your users are having a bad time, and you can’t see it. Track p95 and p99 so the slow tail doesn’t stay invisible.
- No data archival plan: Tables grow forever if you let them, and big tables are slower to scan, index, and back up. Decide early which data you can archive or delete, and run it on a schedule instead of waiting until queries slow down.
FAQs
What is database optimization?
Database optimization is the practice of tuning queries, indexes, schema design, and infrastructure so your database returns results faster while using fewer resources. The goal is lower query times, higher throughput, and lower cloud costs without rewriting your application.
How do I know if my database needs optimization?
Watch for slow page loads, high CPU usage on your database server, growing cloud bills, or queries timing out under load. Run EXPLAIN on your slowest queries and check your slow query log. If queries take longer than they used to, or you’re scaling up your instance just to keep up with traffic, your database needs optimization.
Which database optimization technique should I try first?
Start with indexing and query optimization. Most performance problems come from missing indexes or queries doing more work than they need to, and both fixes are cheap to apply. Caching, read replicas, and sharding solve real problems too, but they add complexity. Try them only after the basics are clean.
How does observability help with database optimization?
Observability turns one-time fixes into continuous improvement. It shows you which queries are slow in production, which deploys caused regressions, and how database performance ties back to application behavior. Tools like Middleware’s Database Monitoring connect those signals so you can find and fix slowdowns before they reach users.
What causes slow SQL queries?
Slow SQL queries usually come from missing indexes, queries that scan more rows than they need, or poorly written joins and subqueries. Run EXPLAIN on a slow query to see whether it’s doing a full table scan or using an index.
How do indexes improve performance?
Indexes let the database find rows without scanning the whole table. Instead of reading every row to find a match, the database uses a sorted structure (usually a B-tree) to jump straight to the rows it needs, which turns a query that reads millions of rows into one that reads only a few.
What causes replication lag?
Replication lag happens when a replica can’t keep up with the write volume on the primary. Common causes are a write-heavy primary, under-provisioned replicas, long-running transactions, or network limits between the two.
What is the difference between database partitioning and sharding?
Partitioning splits a large table into smaller pieces within a single database, while sharding spreads data across multiple separate database servers. Partitioning helps one server manage large tables, while sharding scales beyond what a single server can handle.