Summary: When Kubernetes workloads misbehave, identifying the root cause requires correlating metrics, events, and logs. Learn how observability reduces investigation time from hours to minutes.
When a Kubernetes workload starts misbehaving, requests fail, pods restart more often than usual, and resource usage climbs higher than it should. Kubernetes tells you something is wrong, but not why. Was it a memory leak? A dependency timeout causing request queuing? A misconfigured resource limit?
Engineers must manually correlate metrics, events, and logs across multiple tools to understand what happened, a process that turns a 5-minute fix into a 45-minute investigation.
This is a big observability gap in Kubernetes. This article explains how engineers reason from symptoms to root causes and how observability platforms accelerate that process.
If you’re new to Kubernetes observability and monitoring fundamentals, read our complete guide on Kubernetes observability and Kubernetes monitoring to understand the difference.
Key Takeaways
- Kubernetes exposes symptoms, not root causes.
- Manual Kubernetes troubleshooting increases MTTR.
- Pattern recognition is critical for diagnosing workload behavior.
- Correlating metrics, events, and logs accelerates root cause analysis.
- Unified observability reduces troubleshooting time from hours to minutes.
What Kubernetes Provides vs. What Engineers Need
Kubernetes exposes workload health through metrics (CPU, memory, network), events (pod lifecycle changes, scheduling decisions), and resource status (ready replicas, restart counts). But these are discrete signals, not explanations.
Metrics show resource usage at termination. Events indicate whether the failure was OOMKilled, CrashLoopBackOff, or ImagePullBackOff. But connecting these signals requires manual correlation. You need to have answers to questions such as: Did the CPU spike before the crash? Was memory climbing steadily, or did it jump suddenly? Were there network errors preceding the failure?
For a detailed breakdown of common Kubernetes errors and how to fix them, see our guide on Kubernetes common errors and fixes.
The gap exists because Kubernetes surfaces symptoms rather than diagnostics. A pod restart count of 47 in the past hour is a symptom. The root cause of the repeated restarts requires correlating restart timing with network latency metrics and examining recent configuration changes.
Why Manual Correlation is Time-Consuming
Engineers typically check multiple sources for investigations. Like `kubectl get events` for Kubernetes-level context, Prometheus or metrics-server for resource trends, application logs for error messages, and deployment history for recent changes. Many teams rely on manual kubectl commands and troubleshooting techniques to reconstruct incidents.
Each source provides a fragment of what’s going on. Reconstructing everything, including what happened first and what triggered what, requires mental correlation across these fragmented views.
When workloads span multiple nodes, namespaces, or depend on external services, this correlation becomes more difficult. A database connection pool exhaustion might manifest as API pod restarts, but the root cause lies in the database tier. Without correlated observability, engineers chase symptoms in the wrong layer.
How Engineers Infer Abnormal Workload Behavior
Engineers don’t just read metrics; they interpret patterns to understand what’s failing and why. A CPU spike means different things depending on whether it’s sustained or intermittent, whether memory is also climbing, and whether pod restarts correlate with the spike. The reasoning connects those signals to identify root causes.
Scenario 1: API pods showing 95% CPU utilization
An engineer sees CPU at 95% for an API deployment. The immediate question isn’t “Is 95% bad?” but “What pattern does this follow?”
- If the CPU stays at 95% constantly, regardless of traffic, the workload is likely under-provisioned. The container needs more CPU than allocated, so it’s perpetually resource-starved. You can fix this by increasing CPU limits.
- If the CPU spikes to 95% only during traffic peaks and drops to 30% during off-hours, the workload is handling load correctly. It’s using available CPU when needed. The question becomes: should we add autoscaling to handle peaks, or are current resources adequate for peak performance requirements?
- If CPU jumps to 95% suddenly, stays there for minutes, then the pod restarts, something triggered runaway behavior, perhaps an infinite loop, a request causing excessive computation, or garbage collection thrashing as memory fills. The pattern suggests investigating application-level issues, not just resource limits.
Understanding which Kubernetes metrics truly matter is critical during these investigations. The metric (95%) is identical in all three cases. The reasoning differs based on pattern, timing, and correlation with other signals.
Scenario 2: Frontend deployment stuck with 0/3 ready replicas
Metrics show zero CPU and memory usage for the frontend deployment. The pods exist but aren’t consuming resources. Kubernetes events provide context.
- If events show `ImagePullBackOff`, the container runtime can’t fetch the image: either the registry is unreachable, authentication failed, or the image tag doesn’t exist. This isn’t an application failure; the workload never started. The engineer verifies registry credentials, checks if the image exists, and examines network connectivity to the registry.
- If events show `FailedScheduling` with “Insufficient memory” or “Insufficient CPU,” no node in the cluster has resources to run the pods. The workload is queued, not failed. Metrics show zero usage because the pods aren’t running. The fix involves adding nodes, freeing resources by scaling down other workloads, or adjusting resource requests.
- If events show failing readiness probes, the pods are running (hence CPU/memory usage would be visible) but failing health checks. Kubernetes won’t route traffic to unhealthy pods. If liveness probes are failing, Kubernetes will restart the pods. The engineer checks probe timeout settings, examines application startup times, and investigates whether the workload is genuinely unhealthy or just slow to initialize.
Events explain what Kubernetes observed and how it responded. Without events, an engineer might assume the application is broken when the issue is actually infrastructure-level (scheduling, networking, or registry access).
Connecting Signals to Diagnosis
This reasoning process (interpreting resource patterns, understanding restart causes, and using events for context) is how engineers move from “something is wrong” to “here’s why and how to fix it.”
It’s not about reading individual metrics; it’s about understanding how they relate, what patterns they form, and what those patterns reveal about the underlying failure mode. Choosing the right Kubernetes monitoring tools determines how quickly you can correlate these signals.
Observability platforms like Middleware accelerate this by surfacing correlated signals in a unified view, but the reasoning remains the same: pattern recognition, correlation, and deduction from symptoms to root cause.
How Middleware Provides Investigation-Ready Context
Middleware reduces the time from symptom detection to root cause identification by correlating signals that engineers would otherwise examine separately. Here’s how it works and why it matters for investigations.
Setting Up Middleware for Your Cluster
Before diving into the investigation workflow, you need the Middleware agent running in your cluster. The agent deploys as a DaemonSet and automatically begins collecting metrics, events, and workload data.
If you haven’t installed the agent yet, follow the Kubernetes installation guide in Middleware’s documentation. The setup takes a few minutes. For more detailed troubleshooting scenarios, check out this guide on Kubernetes workload troubleshooting.
If you’re running on Amazon EKS, see our dedicated EKS monitoring guide for best practices.
Once installed, the agent starts streaming data to your Middleware account.
Why the Agent Collects More Than Just Metrics
The Middleware agent runs a DaemonSet on each node and collects three types of data simultaneously: resource metrics (CPU, memory, network), Kubernetes events (pod state changes, scheduling decisions, probe failures), and workload metadata (labels, namespaces, deployment relationships).
This matters because investigations require context, not just numbers. When a pod restarts, you need to know whether memory was climbing before the restart (resource exhaustion), whether the readiness probe was failing (application unhealthy), or whether the node experienced pressure (infrastructure issue).
Collecting these three signal types together means you don’t have to manually reconstruct the timeline from separate tools.
How the Cluster Dashboard Correlates Signals
The dashboard displays node health, pod distribution, and resource consumption in a unified timeline. This isn’t aggregated metrics; it’s pre-correlated data.
Here’s why this accelerates investigations: when you see a deployment with frequent restarts, you can quickly check whether those restarts align with CPU spikes, memory growth, or network errors.
You’re not switching between Prometheus for metrics, `kubectl get events` for state changes, and application logs for errors. The correlation is already done.
Why Default Dashboards Save Investigation Time
Middleware automatically creates dashboards for each namespace and deployment. These aren’t generic templates; they’re populated with the specific metrics Kubernetes generates for your workloads.
When investigating a specific workload, you don’t build queries from scratch. The relevant dashboard already exists with historical data. You can scrub back through the timeline to see when behavior changed.
For example, if an API deployment started showing high API latency yesterday, the dashboard shows whether that coincided with increased traffic, resource saturation, or deployment changes.
🔥Install the Middleware Kubernetes agent in under 5 minutes and start diagnosing workload issues faster today.
Setting Up Alerts That Catch Problems Early
Alerts turn passive monitoring into active detection. Instead of discovering a problem when users complain, you catch it when the pattern emerges. For instance, an alert on steadily climbing memory usage fires before the pod hits OOMKilled. This gives you time to proactively investigate and fix issues rather than react.
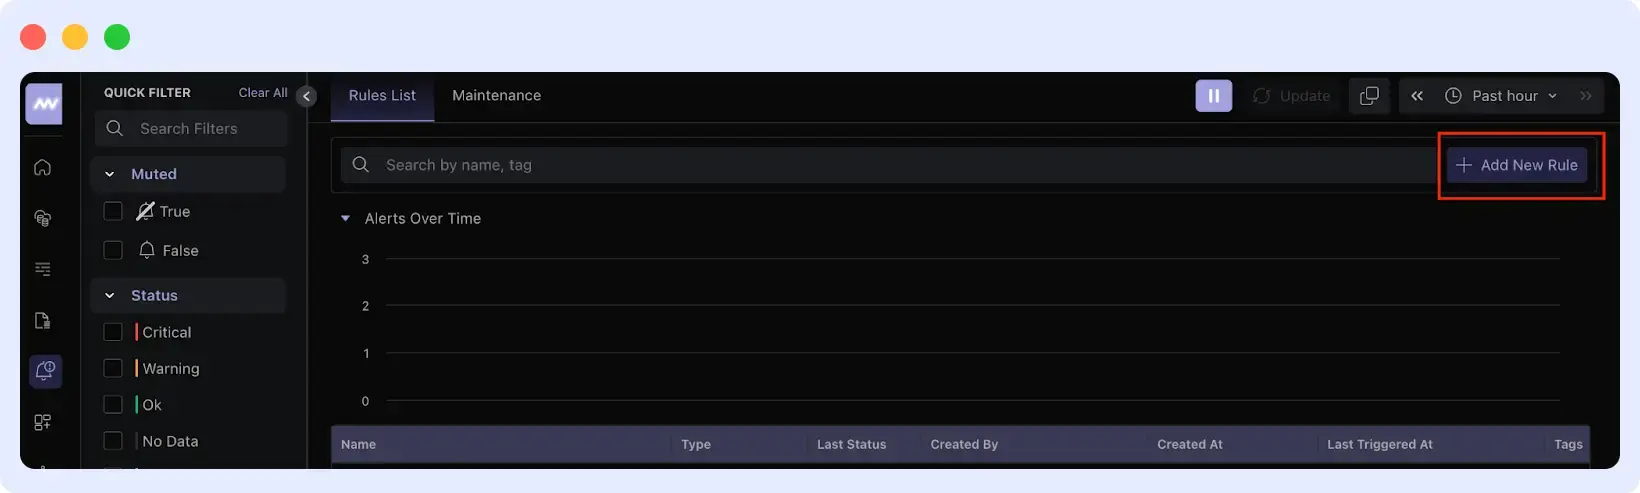
Go to Alerts > Add New Rule. You define the condition, the severity, and the notification channel.
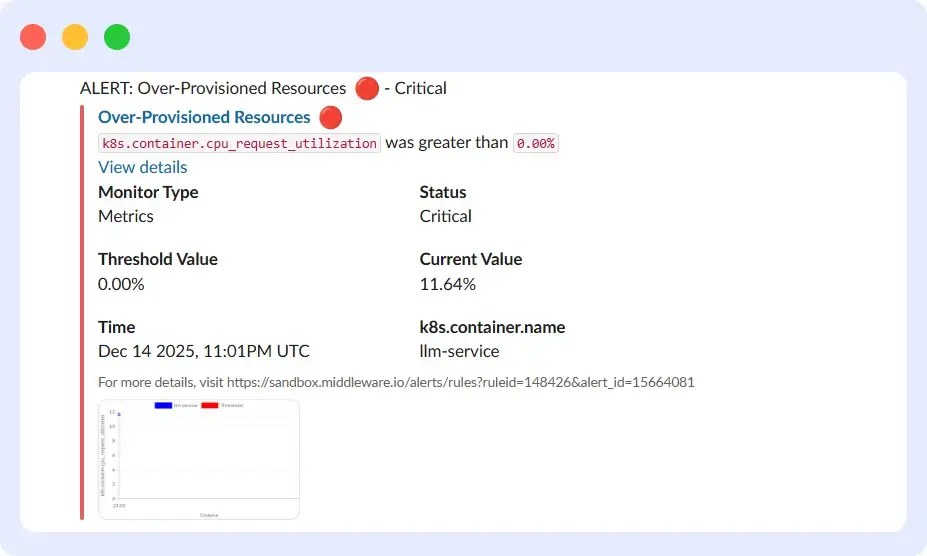
One specific alert type worth configuring is over-provisioned resources. This fires when a workload’s actual resource usage is significantly lower than its requested allocation.
Here’s why:
Overprovisioning wastes cluster capacity and reduces scheduling efficiency. If a service is using 11.6% of its requested CPU, those unused resources are still reserved and unavailable to other workloads. This wastes cluster capacity and reduces scheduling efficiency.
The alert identifies these patterns so you can right-size resource requests; reducing the CPU request to match actual usage frees up node capacity and improves overall cluster utilization.
A Summary of the Investigation Flow
Here’s how Middleware changes the investigation workflow:
Without Middleware:
- Notice application errors in production
- Run `kubectl get pods` to find unhealthy pods
- Run `kubectl describe pod` to check events
- Query Prometheus for resource metrics around the failure time
- Check application logs separately
- Manually correlate timestamps across all sources
- Form a hypothesis about the root cause
- This will take up to 30 minutes to 1 hour.
With Middleware:
- Receive alert (via Slack, Email, Teams, etc) with problem description and dashboard link
- Click the link to see correlated metrics, events, and logs on one timeline
- Identify Log pattern (e.g., memory leak causing restarts)
- Form a hypothesis and validate with historical data
- This will take up to 5-10 minutes max.
The difference isn’t just speed; it’s cognitive load. You’re not mentally reconstructing timelines or switching contexts between tools. The platform has already done the correlation work, so you focus on reasoning about the problem, not gathering data.
Start Diagnosing Workload Issues Faster
Stop jumping between metrics, events, and logs across multiple tools. Middleware integrates everything into a single view, so you can identify root causes in minutes.
FAQs
Can I use kubectl and Prometheus instead of an observability platform?
Yes, but you’ll manually correlate data across tools. Observability platforms do this automatically, saving investigation time.
Does adding observability slow down my cluster?
No. Agents use less than 2% CPU and minimal memory per node. The performance impact is negligible.
Do I need observability if my cluster is small?
Yes. Even small clusters have complex failures requiring correlation across metrics, events, and logs to diagnose efficiently.
How far back can I investigate past issues?
Most platforms retain detailed metrics for 15-30 days and aggregated data longer. This covers recent incidents and historical trends.


