Imagine a media streaming platform hosting a highly anticipated sporting event on Google Cloud Platform (GCP). As millions of viewers tune in simultaneously, the cloud infrastructure faces an immense challenge: scaling dynamically to handle unpredictable traffic spikes. Even a slight delay, interruption, or performance bottleneck can result in viewer frustration, loss of trust, and significant revenue impact.
Handling such high-stakes scenarios requires more than just powerful infrastructure; it demands precise resource scaling, easy service integration, and proactive performance monitoring. Challenges like managing distributed dependencies across Compute Engine, Google Kubernetes Engine (GKE), CloudSQL, and Cloud Functions, along with detecting issues before they escalate, make efficient monitoring necessary.
This article delves into how GCP’s native monitoring tools, complemented by Middleware’s advanced observability platform, can equip teams to tackle these challenges head-on, ensuring reliability, scalability, and flawless performance during critical moments.
GCP monitoring and observability: Laying the foundation
What is GCP monitoring?
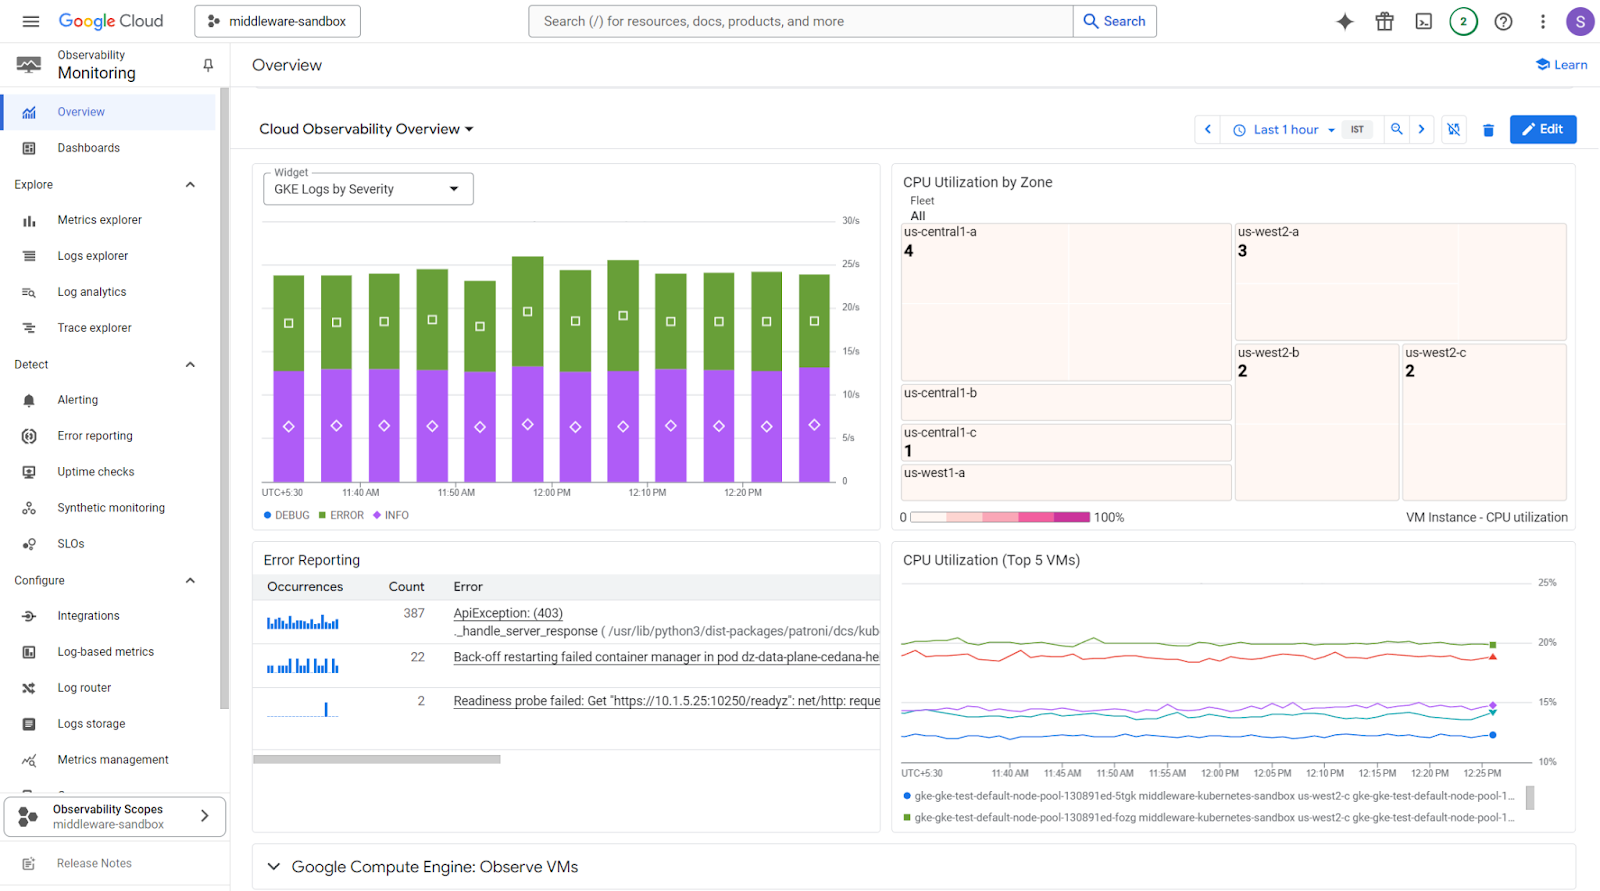
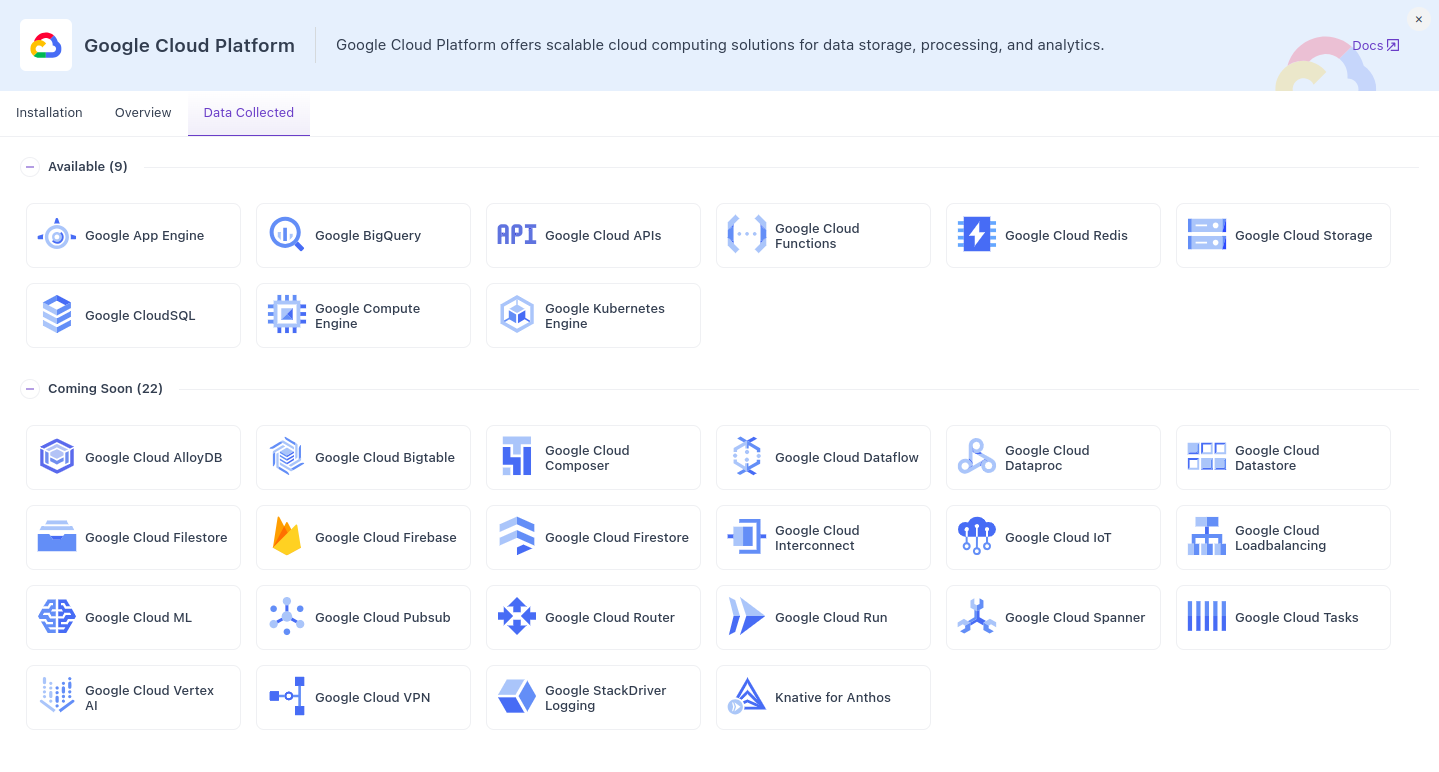
GCP Monitoring focuses on collecting, analyzing, and acting on telemetry data, such as metrics, logs, and traces, from Google Cloud resources. These insights are critical for ensuring consistent performance and reliability across services like App Engine, Compute Engine, Google Kubernetes Engine (GKE), BigQuery, Redis, Storage, and Cloud Functions, as well as managing log data effectively.
Metrics like CPU usage, memory utilization, and latency provide necessary visibility into resource health, while logs and traces offer deeper insights into application behavior and bottlenecks.
Key tools for GCP cloud monitoring:
- Google cloud monitoring: A central hub for collecting and visualizing metrics, helping teams monitor the health and performance of resources like GKE, Compute Engine, and Cloud Functions. Google Cloud Monitoring lets users control their usage and spending with free data usage allotments and detailed metrics.
- Cloud logging: Aggregates logs from all GCP services, allowing teams to generate log-based metrics for troubleshooting and deeper analysis.
- Google cloud storage: A flexible option for log exports, essential for storage, archival, and detailed analysis.
- Cloud trace: Tracks latency across distributed systems to identify bottlenecks and optimize application performance.
Difference between monitoring and observability in GCP
Monitoring
GCP Monitoring focuses on tracking system health by collecting and analyzing metrics and logs. Cloud Audit Logs track administrative activities, providing insights into both human and machine user actions within the GCP environment. For example, Cloud Monitoring provides insights into resource usage, such as CPU utilization and memory consumption, while Cloud Logging aggregates application and system logs for troubleshooting and analysis. Monitoring helps teams identify what is happening in the system.
Observability
Observability in GCP extends beyond monitoring to explain why a system behaves a certain way. Tools like Cloud Trace enable distributed tracing, helping teams analyze latency across microservices, while Cloud Profiler identifies performance bottlenecks in running applications. By correlating metrics, logs, and traces, observability enables root-cause analysis and a deeper understanding of system behavior.
Editor’s Choice: Observability vs. Monitoring
Middleware’s role in GCP cloud monitoring

Middleware is a powerful observability platform designed to complement GCP’s native monitoring tools by offering deeper insights, real time analytics, and proactive solutions. It enables teams to address critical challenges in monitoring distributed systems, ensuring smooth operations and reliable performance.
Here’s how Middleware elevates GCP monitoring:
- Customizable dashboards for key metrics: Middleware consolidates metrics from GCP tools like Cloud Monitoring, Logging, and Trace into a single, actionable interface. For example, it centralizes metrics for GKE nodes, BigQuery usage, Cloud SQL performance, and Pub/Sub throughput, making it easier to monitor diverse workloads in one place.
- AI-Driven anomaly detection: Middleware applies AI-powered analytics to detect unusual patterns in metrics such as latency spikes, CPU usage anomalies, or unexpected database query performance issues. These insights help teams address potential problems before they impact users.
- Proactive scaling recommendations: Middleware provides real time scaling suggestions based on metrics like resource utilization and traffic trends. For example, it can suggest adding GKE nodes or scaling up Cloud SQL replicas during traffic surges, ensuring optimal performance without overprovisioning.
- Real time alerts for critical metrics: Middleware improves GCP’s native alerting by offering customizable thresholds and notification channels. For example, teams can set alerts for API response times, database query latencies, or GKE pod resource usage, ensuring faster incident response.
Editor’s Choice: LLM observability and the future of tech: A podcast with Middleware’s visionary CEO
Practical example:
Imagine a sudden traffic surge during a promotional event. Middleware aggregates metrics from Cloud Monitoring, Logging, and Trace into a unified dashboard. It highlights API latency spikes in GKE clusters and rising query times in Cloud SQL. AI-driven anomaly detection identifies these patterns early and flags them as potential bottlenecks.
Middleware then provides scaling recommendations, such as increasing GKE node counts and Cloud SQL replicas, while sending real time alerts to the team. This ensures stable performance and a smooth user experience without overprovisioning.
Tackling challenges with centralized monitoring in GCP
Monitoring plays a necessary role in maintaining performance and reliability in dynamic and distributed environments like GCP. Middleware, when integrated with GCP’s native tools, tackles critical challenges by enhancing insights, optimizing performance, and detecting issues before they escalate.
Scaling dynamically across services
GCP provides auto-scaling for services like Compute Engine and Cloud Functions, enabling resources within the Google Cloud infrastructure to adjust dynamically to traffic demands. However, native tools may fall short in optimizing scaling thresholds, potentially leading to resource overuse or under-provisioning. Middleware addresses this by analyzing real time usage trends and providing actionable recommendations for scaling.
Example: During high-traffic periods, such as a major product launch or promotional event, Middleware analyzes usage patterns. It suggests scaling adjustments for Compute Engine instances or Cloud Functions. These recommendations help prevent performance degradation while avoiding unnecessary costs.
Editor’s Choice: How Hotplate Transformed Their Customer Experience with Middleware
Managing distributed architectures
In distributed systems, uninterrupted coordination between components such as GKE workloads, serverless functions, and APIs is critical to maintaining reliability. Middleware centralizes key metrics, such as latency, resource utilization, and inter-service dependencies, into a unified dashboard. This visibility allows teams to quickly identify and resolve bottlenecks.
Example: Middleware can pinpoint latency issues between GKE pods and an API gateway, highlighting the specific services causing the delay. This enables teams to make targeted optimizations and ensure smooth communication across services.
Detecting issues proactively
Proactively detecting anomalies is key to preventing disruptions in user experience. Middleware complements GCP tools like Cloud Monitoring by leveraging AI-driven analytics to identify irregular patterns in metrics such as CPU usage, memory consumption, and network latency.
Example: Middleware flags unusual spikes in CPU usage on a GKE node during a traffic surge and correlates the issue with an underperforming database query. This triggers an alert and provides actionable insights to resolve the issue before users are affected.
Enhancing GCP Monitoring with Middleware
Middleware bridges gaps in GCP’s native monitoring tools by enhancing observability, providing predictive insights, and enabling proactive incident management.
Here’s how Middleware elevates GCP Monitoring:
Comprehensive observability across distributed systems
Middleware integrates data from GCP tools like Cloud Monitoring, Cloud Logging, and Cloud Trace into a unified platform. This integration provides a holistic view of distributed systems, enabling teams to analyze key metrics across services like GKE, Compute Engine, Cloud SQL, and Pub/Sub. With centralized insights, teams can better understand service interactions, pinpoint bottlenecks, and optimize performance across their infrastructure.
AI-driven anomaly detection for predictive issue resolution
Using advanced AI algorithms, Middleware detects irregular trends in metrics such as API latency, CPU utilization, and database performance. By identifying anomalies early, it triggers alerts, enabling teams to address potential issues before they disrupt user experience or escalate into critical incidents.
Custom dashboards for unified metrics
Middleware consolidates metrics from GCP services into tailored dashboards that display actionable insights in real time. These dashboards simplify monitoring by providing a single interface for GKE pod health, BigQuery query performance, Cloud SQL resource utilization, and Pub/Sub throughput. This ensures that teams have the right data to act quickly and efficiently.
Real time alerts for proactive incident management
Middleware improves native GCP alerting by offering customizable thresholds and multiple notification channels. For example, teams can configure alerts for API response times, database query latencies, or GKE resource usage, ensuring rapid detection and resolution of critical issues.
Unified GCP Monitoring Dashboard with Middleware
Middleware extends GCP’s capabilities by providing cross-cloud observability, scaling recommendations, and improved incident management.
Bridging monitoring gaps across environments
Middleware goes beyond GCP by integrating telemetry data from hybrid or multi-cloud setups, including AWS and Azure. This unified visibility enables teams to monitor all cloud environments effortlessly, ensuring operational consistency and reducing complexity.
Scaling recommendations based on real time data
Middleware analyzes telemetry data in real time to offer tailored scaling suggestions for GKE nodes, Cloud SQL instances, or Compute Engine VMs. For example, when faced with a spike in traffic, Middleware can recommend adding GKE nodes or scaling up Cloud SQL replicas to maintain stability without overprovisioning.
Reducing incident resolution times
Middleware correlates logs, metrics, and traces across distributed systems to provide deeper root-cause analysis. This helps teams quickly identify the source of an issue, reducing incident resolution times and minimizing downtime.
Editor’s Choice: How to reduce MTTR?
Optimized performance in multi-cloud setups
By unifying telemetry from multiple cloud providers, Middleware enables teams to identify inefficiencies, ensure performance consistency, and manage resources effectively across diverse environments.
Exploring GCP monitoring tools for cloud efficiency
GCP offers a comprehensive suite of monitoring tools to track system performance, detect issues, and optimize operations. Middleware complements these tools by adding advanced analytics, integration, and actionable insights.
Google Cloud Monitoring
Cloud Monitoring provides important metrics for system health, usage patterns, and resource performance across Google Cloud services. Middleware builds on this by consolidating these metrics into unified dashboards, allowing teams to correlate trends and analyze real time data from GKE clusters, Compute Engine, and Cloud SQL. This ensures a centralized, actionable view of infrastructure health.
Cloud logging
Cloud Logging aggregates and indexes logs, generating log-based metrics for deeper insights into system behavior and facilitating exports to cloud storage. Middleware integrates these log-based metrics with real time performance data, offering advanced log-based anomaly detection. For example, Middleware can highlight unusual error patterns or API failures across distributed systems, enabling faster troubleshooting and root-cause analysis.
Cloud trace
Cloud Trace tracks latency across distributed systems, helping teams identify bottlenecks and optimize service interactions. Middleware improves this by overlaying trace data with critical metrics like query times, latency trends, and node health. This unified view allows teams to pinpoint performance issues and dependencies, improving response times and operational efficiency.
How’s Middleware different?
Middleware’s integration with GCP tools provides:
- Unified dashboards: Centralizes telemetry data from Cloud Monitoring, Logging, and Trace onto a single screen, providing teams with a unified, cross-platform view of metrics and logs.
- Log-based anomaly detection: Uses AI models to detect anomalies in logs and metrics, offering insights into irregular patterns or potential issues.
- Custom metrics: Enables the creation of tailored metrics for specific use cases, such as monitoring API health, database query performance, or latency across microservices.
- End-to-End visibility: Combines data from GCP tools to provide a complete picture of latency, resource utilization, and system dependencies across GKE workloads, BigQuery, and Cloud SQL.
Middleware’s support for GCP monitoring services and databases
Middleware improves GCP’s native database monitoring capabilities, providing deeper insights and proactive management for a wide range of managed database services.
Key databases supported
Middleware integrates easily with the following GCP managed databases:
- Cloud SQL: Includes Metrics for MySQL, PostgreSQL, and SQL Server.
- BigQuery: Optimized for large-scale analytics workloads.
- Firestore: A serverless NoSQL document database.
- Bigtable: Ideal for low-latency, high-throughput scenarios.
- Cloud Redis: Managed in-memory database for caching and real time data processing.
Metrics Middleware tracks
Middleware goes beyond basic metrics, offering advanced tracking capabilities to help teams optimize database performance:
- Query latency: Monitors slow queries in Cloud SQL and BigQuery, ensuring efficient query execution.
- Resource utilization: Tracks CPU, memory, and connection usage across databases.
- Scaling needs: Provides proactive alerts when databases approach resource limits, such as high memory consumption or storage thresholds.
- Cost trends: Analyzes BigQuery storage and compute costs, helping teams optimize database usage.
- Replica performance: Tracks replica lag and connection health for distributed databases, such as MySQL and PostgreSQL.
Custom dashboards for real time insights
Middleware unifies database and application metrics into customizable dashboards. These dashboards allow teams to monitor query performance, resource utilization, and system health in real time, making troubleshooting and performance optimization easier.
Strengthening security and compliance in GCP cloud monitoring
Middleware enhancements for security and compliance
Middleware extends GCP’s native security tools, offering better capabilities for tracking vulnerabilities and ensuring compliance with regulatory standards:
- Unified security dashboards: Middleware consolidates logs from GCP Security Command Center (SCC) with system-wide metrics to create a holistic view of vulnerabilities across GCP services like BigQuery, Cloud SQL, and Compute Engine.
- Compliance metric tracking: Middleware helps organizations adhere to standards such as GDPR, HIPAA, and PCI-DSS by continuously tracking compliance metrics. Actionable insights and real time alerts for policy violations enable teams to mitigate risks promptly.
- Correlated security insights: Middleware correlates sensitive data flows, user activity, and resource usage across distributed services like BigQuery and Cloud SQL, making it easier to identify potential breaches or misconfigurations.
Simplified regulatory reporting
Middleware facilitates compliance reporting by:
- Generating comprehensive reports that detail sensitive data interactions across services.
- Highlighting areas of non-compliance for faster resolution.
- Automating recurring audits to reduce manual effort and ensure consistent adherence to regulatory requirements.
Integration best practices
Middleware’s integration capabilities ensure a flawless observability experience for GCP environments. Key practices include:
- CI/CD pipelines: Embed Middleware into your CI/CD workflows to monitor security metrics and compliance during deployments.
- Third-Party tools: Integrate Middleware with external logging frameworks and incident management systems to unify security insights across tools.
- Custom logging frameworks: Use Middleware to correlate GCP logs with application-specific logs for deeper visibility into distributed systems.
Middleware and GCP monitoring: Use cases and benefits
Scaling GCP services during traffic peaks
Middleware makes use of GCP’s native telemetry data, such as resource usage metrics from Cloud Monitoring, to recommend scaling adjustments during high-demand periods.
For example, during peak traffic, Middleware can suggest scaling actions for GKE clusters, such as adding nodes to handle increased workloads or adjusting Cloud Functions’ concurrency limits to manage bursts of user activity. These real time recommendations prevent performance degradation while avoiding over-provisioning.
Incident analysis with centralized dashboards
By correlating telemetry from Cloud Trace, Cloud Logging, and application logs, Middleware helps teams quickly identify the root causes of performance issues.
Middleware’s dashboards centralize latency patterns, API failure logs, and query performance metrics, enabling faster root-cause analysis of incidents in GKE workloads or database queries. This reduces downtime and accelerates resolution times, guaranteeing a smooth user experience.
Multi-Cloud observability
Middleware provides a unified view by integrating GCP metrics with telemetry data from other cloud providers, such as AWS and Azure.
This cross-platform visibility simplifies monitoring for hybrid or multi-cloud architectures, allowing teams to identify inefficiencies, optimize performance, and reduce silos across diverse environments. For example, Middleware can track latency across GCP APIs while correlating this with AWS service usage, ensuring consistent operations across platforms.
GCP monitoring best practices
- Centralized log and metrics management
Middleware combines Cloud Logging data with metrics from Cloud Monitoring into a unified dashboard. This makes it easier to monitor and manage GCP resources by centralizing data from GKE, Compute Engine, and Cloud SQL. With a single platform, teams can gain a complete view of system health and performance without toggling between multiple tools.
- Automate scaling
Cloud Monitoring alerts, combined with Middleware’s AI-driven recommendations, enable dynamic scaling of GKE clusters and Cloud Functions. Middleware analyzes resource usage trends to help teams prevent overprovisioning during low demand and ensure adequate resources during high-traffic periods.
- Use custom metrics for granular insights
Middleware allows teams to create and monitor custom metrics tailored to their specific application needs. For example, teams can track database query latencies or API response times to identify performance issues and take proactive measures for optimization.
- Pinpoint bottlenecks with distributed tracing
By integrating with Cloud Trace, Middleware helps correlate key metrics, such as GKE workload performance and API latency, to identify inefficiencies. Distributed tracing simplifies root-cause analysis, allowing teams to resolve issues faster and guarantee smooth service-to-service interactions.
- Optimize resources continuously
Middleware monitors resource utilization metrics like CPU, memory, and network usage to identify optimization opportunities. These insights allow teams to balance cost and performance effectively, ensuring efficient resource allocation without compromising reliability.
Common issues in GCP monitoring and solutions
Alert fatigue: GCP’s native tools often produce an overwhelming number of alerts, making it challenging for teams to differentiate between critical and non-urgent issues. Middleware addresses this by applying AI-based filtering to refine noisy alerts. Teams receive only actionable notifications, allowing them to focus on resolving high-priority incidents effectively.
Siloed monitoring: Fragmented monitoring across multiple tools can lead to inefficiencies and missed insights. Middleware centralizes observability by integrating GCP tools like Cloud Monitoring, Logging, and Trace into a unified platform. It also incorporates external telemetry from third-party tools or multi-cloud environments, providing teams with a single, comprehensive dashboard to track and manage system performance.
Implementing Middleware for GCP monitoring services
Integrating Middleware with GCP’s monitoring tools improves observability, allowing you to manage performance, resource allocation, and scaling more effectively. Follow these steps for a smooth integration:
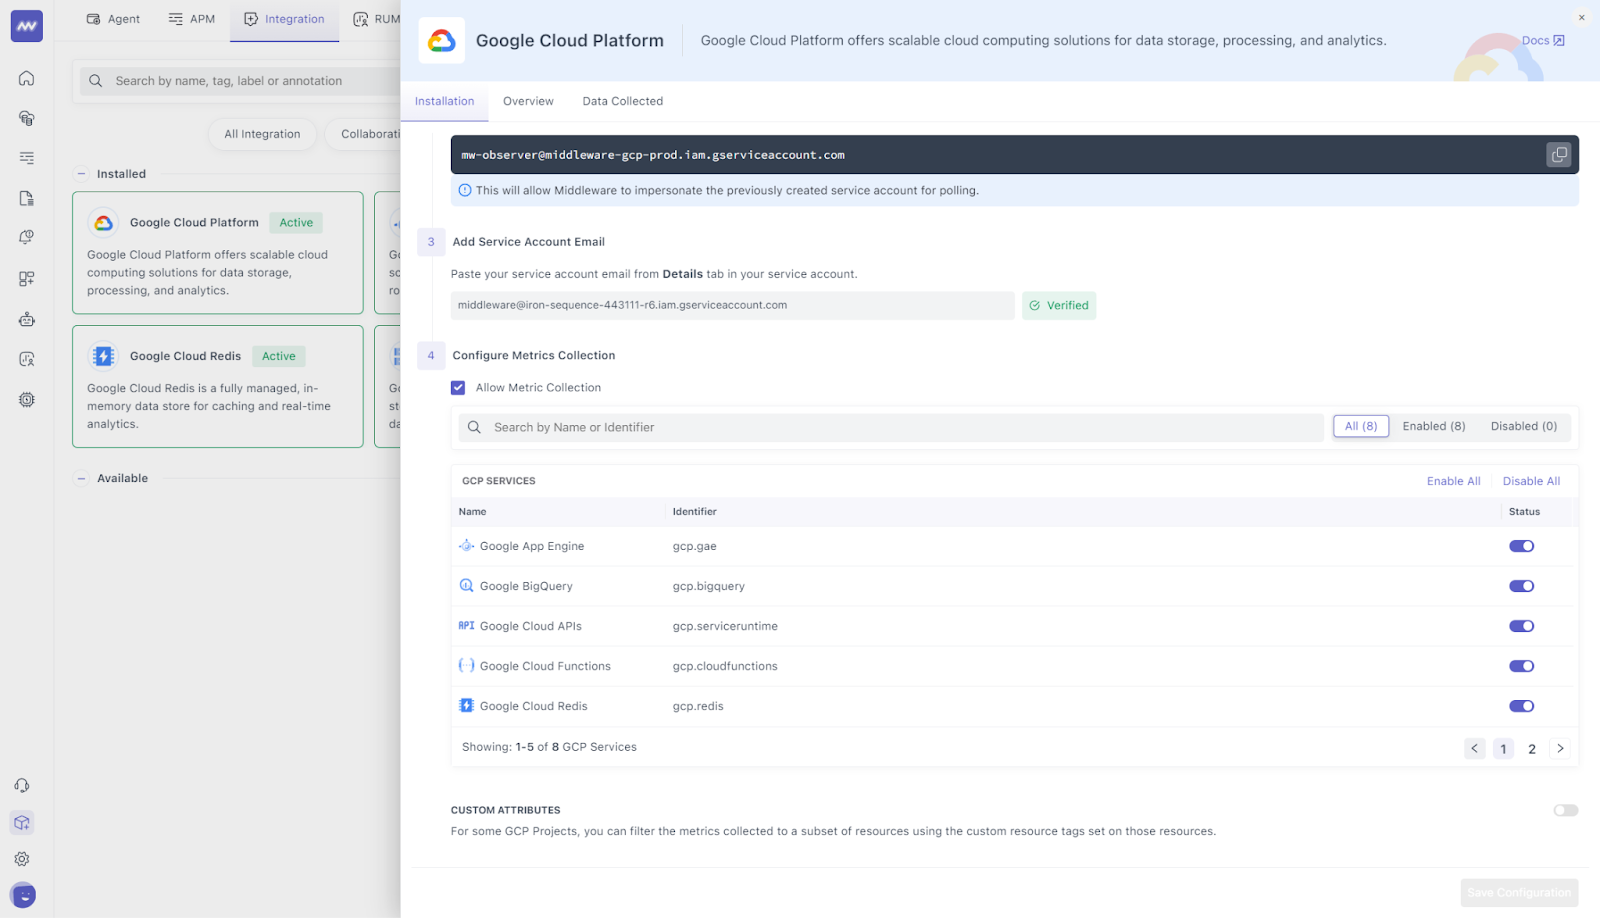
- Connect Middleware to GCP services
Start by linking Middleware to GCP resources such as Cloud Monitoring and Logging. This integration enables Middleware to collect metrics, logs, and traces for unified analysis and actionable insights. - Create custom dashboards
Middleware provides existing templates for individual services like GKE, BigQuery, and Cloud SQL. However, if you prefer custom configurations, you can use Middleware’s Dashboard-Builder features to create visualizations for key metrics from GCP services. This enables a consolidated view of system health, effectively helping teams monitor performance across distributed systems. - Set up alerts and proactive scaling
Configure alerts for critical performance indicators such as CPU usage, memory utilization, or API latency. Middleware’s AI-driven scaling recommendations can also be applied to GCP services like Compute Engine and GKE, ensuring resource stability during high-traffic periods. - Utilize Middleware’s analytics for optimization
Use Middleware’s advanced analytics to detect anomalies, optimize scaling policies, and troubleshoot issues proactively. This ensures smoother operations and improved reliability for your GCP environment.
For detailed instructions, refer to the official Middleware GCP Integration documentation.
Conclusion
This article has explored how Middleware improves GCP monitoring by bridging the gaps in native tools, delivering advanced observability, and enabling smarter scaling. You’ve learned how Middleware consolidates metrics into unified dashboards, provides AI-driven insights, and ensures proactive issue detection to maintain system reliability and performance.
By integrating with GCP services like Cloud Monitoring, Logging, and Trace, Middleware strengthens teams to optimize resource usage, reduce resolution times, and accomplish smooth multi-cloud observability. Its tailored scaling recommendations and anomaly detection capabilities ensure peak performance during traffic surges without overprovisioning.
What is monitoring in GCP?
Monitoring in GCP involves collecting, analyzing, and visualizing telemetry data such as metrics, logs, and traces to ensure the health, performance, and reliability of Google Cloud resources. Tools like Google Cloud Monitoring enable teams to track resource utilization, set up alerts, and gain insights into workloads running on Compute Engine, GKE, Cloud SQL, and other GCP services.
What is the Google equivalent of CloudWatch?
The Google equivalent of AWS CloudWatch is Google Cloud Monitoring. It provides real time metrics, dashboards, and alerts for resources and applications hosted on Google Cloud. Cloud Monitoring integrates with other GCP tools like Cloud Logging and Cloud Trace to offer comprehensive visibility into system performance and behavior.
What are the prerequisites for integrating GCP with Middleware?
Before integrating GCP with Middleware, ensure that the following APIs are enabled in your GCP project:
- Cloud Resource Manager API,
- Cloud Billing API,
- Stackdriver Monitoring API,
- Compute Engine API,
- Cloud Asset API, and
- Identity and Access Management (IAM) API.
Additionally, confirm that the projects being monitored are set up individually and not as scoping projects.
How do I create a Google Cloud Service Account for Middleware integration?
To create a service account for Middleware integration, go to the Google Cloud Console, navigate to IAM & Admin > Service Accounts, and click Create Service Account. Provide a name, assign the necessary roles (such as Monitoring Viewer, Compute Viewer, and Cloud Asset Viewer), and click Done to complete the setup.
How does Middleware collect metrics from GCP services?
Middleware collects metrics from GCP services using service account impersonation. This method allows Middleware to access data from all GCP projects the service account has permission to, based on the IAM roles assigned. Metrics are then aggregated and displayed in Middleware’s dashboards for analysis.
