Regardless of its popularity, Kubernetes can fumble even the most seasoned DevOps engineers. While it excels at handling containerised applications at scale, it presents unique Kubernetes troubleshooting challenges.
In this post, we’ll explore the top 10 Kubernetes troubleshooting techniques that every DevOps engineer should master. These K8s troubleshooting tips come from real-world scenarios, showing how to solve common and critical Kubernetes issues quickly and reliably.
1. Fixing CrashLoopBackOff Errors in Pods
One of the most common and frustrating issues in Kubernetes is when a pod repeatedly crashes during restarts; a situation known as the CrashLoopBackOff error. This occurs when a container fails to start correctly, and Kubernetes continually attempts to restart it, resulting in a loop of failures.
Step 1: List All Pods
The first step in debugging this error is to get a high-level overview of all pods running in your namespace. You can do this with the following command:
This will show the status, restart count, and age of each pod. Pods with a status that CrashLoopBackOff clearly indicates an issue requiring immediate attention.
Step 2: Describe the Affected Pod
Once you’ve identified the problematic pod, use the describe command to inspect its internal details:
This provides configuration information, recent events, and messages that might indicate the reason for the crash. Pay special attention to the Events section, which can help pinpoint issues such as failed image pulls, missing configuration, or permission errors.
Step 3: Review Container Logs
Logs are essential for understanding what went wrong inside a container. Use the following command to access a pod’s logs:
If the pod fails before producing logs, you might find the logs are empty. In such cases, use the --previous Flag to inspect the logs from the last failed container instance. This often reveals the root cause, especially if the container exited before any meaningful activity.
If you’re trying to debug pods in real-time, don’t miss our detailed guide on tailing logs with
kubectl, which walks you through using--tail,-f, and more advanced flags for live troubleshooting.
Example Scenario:
Let’s walk through a practical example:
- Run
kubectl get podsand observe the output:
The pod my-webapp-pod is crashing repeatedly.
2. Try describing the pod:
If this yields no helpful insight, the issue might be within the container logs.
3. Check the logs of the previous instance:
kubectl logs my-webapp-pod --previous:
Error: DATABASE_URL environment variable is not set
Process exiting with code 1
The logs show that the DATABASE_URL Environment variable was missing. This explains why the container failed. The application inside expected a configuration that wasn’t provided.
CrashLoopBackOff errors often result from misconfigurations such as missing environment variables, incorrect commands, or failed dependencies. By systematically inspecting pods, describing their events, and reviewing logs (including those from previous container instances), you can efficiently identify and resolve the underlying cause.
2. Kubernetes Troubleshooting Deployment Failures: ImagePullBackOff
When Kubernetes cannot pull a container image due to authentication issues or an incorrect image name, it triggers an ImagePullBackOff error.
Step 1: Identify Problematic Deployments
Start by checking the status of your deployments:
This command displays all deployments and their replica counts. Pay close attention to the READY column. For example, a “0/3” status means that none of the pods are starting successfully, suggesting an issue at the pod level rather than with the application itself.
For deeper insight, run the following:
This provides detailed deployment data, including the pod template, conditions, and recent events. You may see messages like “ReplicaSet failed to create pods,” which can indicate underlying issues.
Step 2: Monitor Rollout Status and History
To track a deployment rollout in real time:
This is useful when monitoring deployments during CI/CD pipeline runs.
To view the deployment history:
Use this to identify which revision introduced the issue and compare it with previous working versions.
Step 3: Investigate the Root Cause of ImagePullBackOff
Let’s list the pods and spot the error:
Now, inspect the failing pod:
kubectl describe pod my-app-7d4b8c8f-xyz
Failed to pull image "private-registry.com/my-app:v1.2.3":
Error response from daemon: pull access denied for private-registry.com/my-app
This indicates that Kubernetes cannot access the private container registry due to missing or invalid credentials.
Step 4: Fixing the ImagePullBackOff Using Secrets
To resolve this, create a Kubernetes Secret to store your private registry credentials securely:
kubectl create secret docker-registry my-registry-secret \
  --docker-server=private-registry.com \
  --docker-username=myuser \
  --docker-password=mypassword \
  --docker-email=my@email.com
Now, patch your deployment to reference the secret:
kubectl patch deployment my-app -p '{"spec":{"template":{"spec":{"imagePullSecrets":[{"name":"my-registry-secret"}]}}}}'
Once patched, Kubernetes will re-trigger the deployment using the correct credentials. You can monitor the new rollout using:
3. Kubernetes Troubleshooting: Fixing NotReady Node Errors
One of the most common Kubernetes troubleshooting issues DevOps engineers face is the NotReady status on a node, which blocks pod scheduling and disrupts workloads.
If the kubelet on the node cannot communicate with the server or the node fails health checks, the NotReady The status appears, preventing pods from being scheduled, which often leads to application downtime.
Step1: Checking Node Status
First, check the status of all nodes:
This command lists all cluster nodes, showing their status, container runtime, IP addresses, and OS details. The -o wide flag gives additional context, helping identify node-level issues such as OS mismatches or node location patterns (e.g., subnet-specific failures).
Step 2: Inspecting Node Conditions and Issues
Use the following command to get a detailed view of a node’s resource capacity and health:
This will show whether the node’s allocatable resources are within limits or are being over-utilized.
For example, let’s say you have a node showing a NotReady status:
Step 3: To investigate further
kubectl describe node worker-node-1
Conditions:
Type             Status  LastHeartbeatTime   LastTransitionTime   Reason                 Message
DiskPressure     True    Mon, 01 Jan 2024    Mon, 01 Jan 2024     KubeletHasDiskPressure kubelet has disk pressure
Fixing Disk Pressure Issues
In this case, the node is reporting disk pressure typically because the partitions or logs have consumed excessive space.
To resolve this, clear out system logs using:
This will remove logs older than 3 days and free up disk space, helping the kubelet return the node to a Ready state.
4. Diagnosing Service and Networking Problems: The Pending error
When services or pods are stuck in a Pending state, Kubernetes troubleshooting becomes essential. This often indicates a selector mismatch, networking misconfiguration, or issues with DNS resolution.
Service connectivity problems are among the most frustrating issues in Kubernetes. Start by listing all services to verify their configuration:
This command returns service types and network details, including IP addresses and ports.
Step1: Verifying services
To identify if a service lacks matching pods, use the following command to list endpoints:
If an endpoint is empty, it means no pods match the service’s selector, which is commonly the root cause of connection failures.
You can further inspect the service configuration to verify the labels used to locate pods:
Compare the selector labels in the service with the actual labels on your pods to ensure they align.
Step 2: Inspecting DNS Issues In The Cluster
If there’s a communication failure between microservices that causes the Pending state, DNS resolution might be the culprit. You can run the following commands from within a pod:
If the DNS name does not resolve to an IP address, there’s likely an issue with the cluster’s DNS configuration.
Testing HTTP Connectivity
To ensure that the service is responding correctly, test its endpoint with:
If the request fails, it could indicate a problem with the service configuration, network policies, or incorrect pod selectors.
5. Kubernetes Troubleshooting High Resource Usage: Solving OOMKilled Errors
Monitoring resources is a crucial part of Kubernetes troubleshooting, enabling the maintenance of healthy clusters and ensuring optimal application performance. When a container exceeds its allocated memory limit, Kubernetes forcefully terminates it, resulting in the infamous OOMKilled error. This can cause pod evictions, application downtime, or severe performance degradation.
Step 1: Checking Resource Usage
To identify memory-intensive nodes and pods:
This command provides real-time resource usage across nodes. If a node is using over 80% of its memory, it may be at risk of triggering OOMKilled errors.
You can also view pod-level resource usage and sort by CPU or memory:
These commands help you pinpoint the most resource-hungry pods in the cluster.
Track OOMKilled and other errors in real-time with Middleware’s K8 agent.
Step 2: Investigating Resource Quotas, Limits, And Autoscaling
Understanding and monitoring resource limits is essential. To check quotas across all namespaces:
A Memory leaks often appears as a gradual increase in memory usage over time. You can monitor a pod’s live memory consumption every 5 seconds using:
This helps you spot memory leaks or gradually increasing memory usage.
Avoid memory issues before they crash your pod. See how detects them early via Kuberenetes Monitoring.
Step 3: Checking Pod Resource Requests and Limits
If pods lack memory limits, they can consume excessive resources, potentially affecting other workloads. To inspect resource requests and limits:
This is a useful Kubernetes troubleshooting trick to identify which pods lack proper memory restrictions.
Step 4: Mitigating Resource-Related Issues
To prevent OOMKilled errors and automatically balance resource usage, you can set up Horizontal Pod Autoscaling (HPA).
Pro Tip: Use autoscaling to manage resource spikes. For example, to autoscale a deployment based on 70% CPU usage:
You can verify if autoscaling is active and functioning correctly:
Proactively managing resource limits and enabling autoscaling helps prevent OOMKilled errors and ensures smoother application performance.
6. Kubernetes Troubleshooting Storage: Resolving PVC Pending Errors
The PersistentVolumeClaim (PVC) Pending status is a common storage issue in Kubernetes, preventing applications from accessing persistent data. This typically results from misconfigured storage classes, missing volume provisioners, or insufficient available storage in the cluster.
Step 1: Inspecting PV and PVC Status
Start by listing all Persistent Volumes (PVs) and Persistent Volume Claims (PVCs) across all namespaces. This command provides an overview of their status, access modes, capacity, and whether they are bound:
Step 2: Troubleshooting Mounting Issues
To further investigate an unbound PVC stuck in the Pending state, use the following command:
Check the Events section at the bottom of the output. It often reveals the root cause, such as:
- No matching
PersistentVolumeavailable - Storage class mismatch
- Insufficient capacity
- Missing provisioned
Step 3: Verifying Storage Classes
Incorrect or non-existent storage classes are a common culprit. List all available storage classes:
Then, describe a specific one to inspect details like the provisioner and parameters:
Ensure that your PVC references a valid, correctly configured storage class. If the specified provisioner does not exist or is misspelled, the volume will fail to provision.
Step 4: Common Mistakes and Resolution
Suppose you’ve defined a PVC that references a storage class named fast-ssd, but it’s failing to provision. Run:
You might see an error like:
Warning  ProvisioningFailed  3m    persistentvolume-controller
storageclass.storage.k8s.io "fast-ssd" not found
Now, list all available storage classes to confirm:
If fast-ssd is missing, but gp2 or standard exists, update your PVC to use a valid class.
7. Using Event and Audit Logs: Deep System Analysis
Kubernetes provides two powerful tools for debugging: events and audit logs. These help you track what happened, when it happened, and why, giving you a timeline of system activities for root cause analysis.
Step 1: Understanding Kubernetes Events
Events in Kubernetes record what’s happening inside the cluster. You can list events across all namespaces and sort them by their creation time to see the most recent activity at the bottom. This helps correlate issues with recent system behavior.
For a more comprehensive understanding of how Kubernetes handles logs across nodes and clusters, check out our complete guide to Kubernetes logging.
For View all events sorted by time:
To filter events that occurred after a specific time:
To view only warning-type events (which often indicate potential problems):
You can also monitor events in real-time using the --watch flag. This is helpful when you’re actively troubleshooting and want to immediately observe what happens after deploying or modifying resources:
If you’re investigating a specific pod, deployment, or service, you can filter events to focus only on that object. For example:
In case you’re dealing with pods not getting scheduled, you can filter events with reason set to “FailedScheduling”. This will show why Kubernetes couldn’t place the pod on a node, such as due to insufficient resources or affinity conflicts:
Step 2: Using Audit Logs for In-Depth Troubleshooting
While events help you understand what’s happening, audit logs let you see who did what at the API level essential for security investigations or when tracking administrative actions.
Audit logs are not enabled by default. To enable them, you must configure an audit policy. Here’s a sample audit policy configuration that captures detailed logs for core resources like pods, services, deployments, etc.:
apiVersion: audit.k8s.io/v1
kind: Policy
rules:
- level: RequestResponse
  resources:
  - group: ""
    resources: ["pods", "services"]
  - group: "apps"
    resources: ["deployments", "replicasets"]
- level: Request
  resources:
  - group: ""
    resources: ["configmaps", "secrets"]
Once configured, audit logs can help you track down issues like:
{
  "kind": "Event",
  "apiVersion": "audit.k8s.io/v1",
  "level": "RequestResponse",
  "auditID": "4d2c8b7a-f3e1-4b2a-9c8d-1e3f5a7b9c2d",
  "stage": "ResponseComplete",
  "requestURI": "/api/v1/namespaces/production/pods/web-app-7d4b8c9f-xyz",
  "verb": "delete",
  "user": {
    "username": "admin@company.com",
    "groups": ["system:authenticated"]
  },
  "sourceIPs": ["192.168.1.100"],
  "userAgent": "kubectl/v1.28.0",
  "objectRef": {
    "resource": "pods",
    "namespace": "production",
    "name": "web-app-7d4b8c9f-xyz"
  },
  "responseStatus": {
    "code": 200
  },
  "requestReceivedTimestamp": "2024-01-15T10:30:00.000Z",
  "stageTimestamp": "2024-01-15T10:30:00.123Z"
}
Once audit logging is enabled, logs will show important details such as:
- Which user made the API request
- From which IP address
- The HTTP verb used (e.g., GET, POST, DELETE)
- The resource affected (e.g., pod, deployment)
- The timestamp of the action
- Whether the request succeeded
Example: An audit log might show that a pod was deleted at a specific time, by a specific admin user, from a certain IP address. This level of transparency is crucial when diagnosing problems caused by accidental or unauthorized changes.
8. Using Kubernetes Dashboard and Visual Tools
While command-line tools like kubectl offer powerful ways to inspect your Kubernetes cluster, visual tools simplify cluster management, especially when identifying patterns across metrics, logs, and events.
Step 1: Kubernetes Dashboard Overview
The Kubernetes Dashboard is a web-based user interface that lets you manage cluster resources visually. It provides detailed insights into deployments, resource usage, logs, and events, making it easier to diagnose issues without needing to run multiple CLI commands.
By default, the Dashboard is not installed in production environments due to security concerns. However, it can be manually deployed as follows:
- Deploy the Dashboard: Run the following command to apply the recommended configuration:
kubectl apply -f https://raw.githubusercontent.com/kubernetes/dashboard/v2.7.0/aio/deploy/recommended.yaml
2. Create a service account for access.
kubectl create serviceaccount dashboard-admin -n kubernetes-dashboard
kubectl create clusterrolebinding dashboard-admin --clusterrole=cluster-admin --serviceaccount=kubernetes-dashboard:dashboard-admin
3. Generate Access Token:
Once deployed, the Dashboard allows you to:
- Monitor CPU and memory usage over time
- Visualize event timelines
- Explore relationships between Kubernetes resources
- Stream application logs directly in your browser
Example Use Case:
Suppose your application experiences intermittent failures. The Dashboard may show that CPU usage spikes align with these failures, and the events log shows that pods are being OOMKilled. This kind of pattern is easier to identify visually than by reading raw CLI logs.
Step 2: Alternative Visualisation Tools like Middleware
While the Kubernetes Dashboard is helpful, it has limitations in terms of full observability. Tools like Middleware enhance visibility by combining metrics, logs, traces, and alerting into a single view. They support custom dashboards and real-time insights into your entire Kubernetes environment.
To install the Middleware agent as a DaemonSet:
apiVersion: apps/v1
kind: DaemonSet
metadata:
  name: middleware-agent
  namespace: middleware
spec:
  selector:
    matchLabels:
      app: middleware-agent
  template:
    metadata:
      labels:
        app: middleware-agent
    spec:
      containers:
      - name: middleware-agent
        image: middleware/agent:latest
        env:
        - name: MW_API_KEY
          valueFrom:
            secretKeyRef:
              name: middleware-secret
              key: api-key
        - name: MW_TARGET
          value: "https://api.middleware.io"
        volumeMounts:
        - name: docker-sock
          mountPath: /var/run/docker.sock
        - name: proc
          mountPath: /host/proc
          readOnly: true
        - name: sys
          mountPath: /host/sys
          readOnly: true
      volumes:
      - name: docker-sock
        hostPath:
          path: /var/run/docker.sock
      - name: proc
        hostPath:
          path: /proc
      - name: sys
        hostPath:
          path: /sys
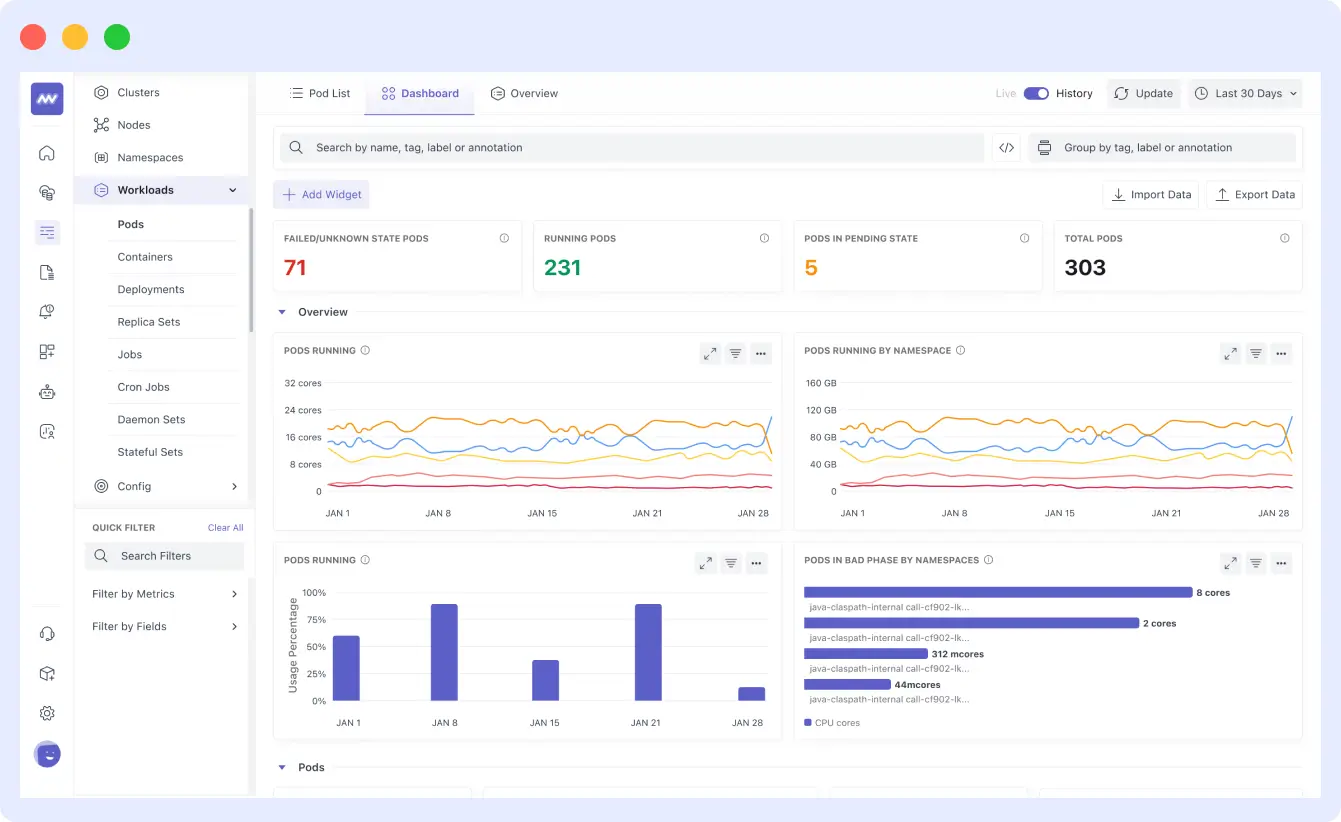
Once integrated, you can visualise your pods, collect metrics from various sources and also monitor the status of your deployments.
9. Implementing Health Checks and Probes
Health checks in Kubernetes function similarly to routine medical checkups, helping to detect issues early and ensuring everything is functioning as expected.
Kubernetes uses probes to monitor the health and availability of your application containers. These probes enable the cluster to detect issues and take automated actions, such as restarting containers or stopping traffic routing, when necessary.
Understanding Readiness and Liveness Probes
Kubernetes provides three types of probes, each serving a specific role in maintaining container health:
- Liveness Probe: Checks if the container is still running. If it fails repeatedly, Kubernetes restarts the container.
- Readiness Probe: Checks if the container is ready to accept traffic. If this fails, the container is temporarily removed from the service endpoints.
- Startup Probe: Provides containers with additional time to complete their startup logic before other probes begin. This is useful for applications with longer boot times.
Example: Configuring All Three Probes
Below is a configuration example that combines all three types of probes in a single deployment:
apiVersion: apps/v1
kind: Deployment
metadata:
  name: web-application
spec:
  replicas: 3
  selector:
    matchLabels:
      app: web-application
  template:
    metadata:
      labels:
        app: web-application
    spec:
      containers:
      - name: web-app
        image: my-app:v1.2.3
        ports:
        - containerPort: 8080

        # Startup probe - gives the app time to initialize
        startupProbe:
          httpGet:
            path: /health/startup
            port: 8080
          initialDelaySeconds: 10
          periodSeconds: 5
          timeoutSeconds: 3
          failureThreshold: 30  # 30 * 5 = 150 seconds to start
          successThreshold: 1

        # Liveness probe - restarts container if unhealthy
        livenessProbe:
          httpGet:
            path: /health/live
            port: 8080
          initialDelaySeconds: 30
          periodSeconds: 10
          timeoutSeconds: 5
          failureThreshold: 3
          successThreshold: 1

        # Readiness probe - removes from service if not ready
        readinessProbe:
          httpGet:
            path: /health/ready
            port: 8080
          initialDelaySeconds: 5
          periodSeconds: 5
          timeoutSeconds: 3
          failureThreshold: 3
          successThreshold: 1

        resources:
          requests:
            memory: "256Mi"
            cpu: "250m"
          limits:
            memory: "512Mi"
            cpu: "500m"
How These Probes Work Together
- Startup Probe: This is checked first. It runs every 5 seconds, allowing up to 150 seconds for the application to complete startup tasks such as initializing databases or loading configurations. During this time, other probes are paused.
- Liveness Probe: Once the startup probe succeeds, the liveness probe takes over. It ensures the container remains healthy. If the check fails three times in a row, Kubernetes automatically restarts the container.
- Readiness Probe: This ensures the container is prepared to handle incoming traffic. If the check fails (e.g., due to a temporary database outage), Kubernetes temporarily removes the pod from the load balancer without restarting it.
10. Advanced Debugging Techniques
While standard Kubernetes debugging methods handle many day-to-day issues, there are times when more advanced techniques are needed, especially for diagnosing complex performance bottlenecks, unexpected application behavior, or deep network-level problems that basic tools can’t resolve.
Step 1: Using Ephemeral Containers for Live Debugging
Ephemeral containers are a powerful way to troubleshoot live applications without restarting pods or altering their state. They allow you to temporarily inject a debugging container into a running pod, ideal for production debugging where uptime is critical.
For example, to initiate a basic debugging container within a live pod:
To include specific debugging tools (like bash, curl, dig), use an image like Ubuntu:
Practical Example: Network Issue Investigation
Imagine your web application is facing intermittent connectivity issues. You can attach a debugging container with networking tools like netshoot:
Inside the debugging container, we can now check network connectivity:
Inside the debugging container, you can perform several diagnostics:
Check service connectivity:
Test open ports:
Inspect networking interfaces:
Validate DNS resolution:
Monitor network traffic:
Inspect running processes:
And examine the file system:
This kind of live environment debugging allows for pinpointing issues that might only occur under real production conditions.
Step 2: Leveraging kubectl debug for Broader Scenarios
The kubectl debug command also supports more advanced operations beyond ephemeral containers:
Create a full debug copy of a pod:
kubectl debug web-app-7d4b8c9f-xyz --copy-to=web-app-debug --image=ubuntu --set-image=web-app=ubuntu -- sleep 1d
You can also create a new pod with the same configuration but a different image:
Debug at the node level: You can launch a privileged pod on a node to investigate node-level issues:
Inside the privileged container, you can access the host’s filesystem and services:
Add profiling containers for performance analysis:
If you’re looking into CPU profiling or memory leaks, a container with Go or another profiling tool can help:
Why These Techniques Matter
Advanced debugging isn’t just about having extra commands; it’s about having flexibility to access low-level details without affecting production workloads. With ephemeral containers, node-level access, and full pod duplication, you can troubleshoot virtually any problem live and in context, minimizing guesswork and downtime.
Using Monitoring and Tracing Tools like Middleware
While built-in tools like kubectl are essential for initial debugging, they can fall short when dealing with complex, distributed systems. This is where third-party observability platforms come into play. Middleware, for instance, offers a comprehensive observability solution that provides deeper visibility into your Kubernetes clusters.
Middleware enables you to track critical Kubernetes metrics, including node health, pod performance, and resource utilization. It collects data from sources such as Kube-state-metrics and the Metrics Server to provide you with real-time, actionable insights.
The Middleware agent offers an intuitive dashboard that visualizes metrics across your cluster. It enables you to:
- Monitor pod activity and identify issues using unique pod IDs.
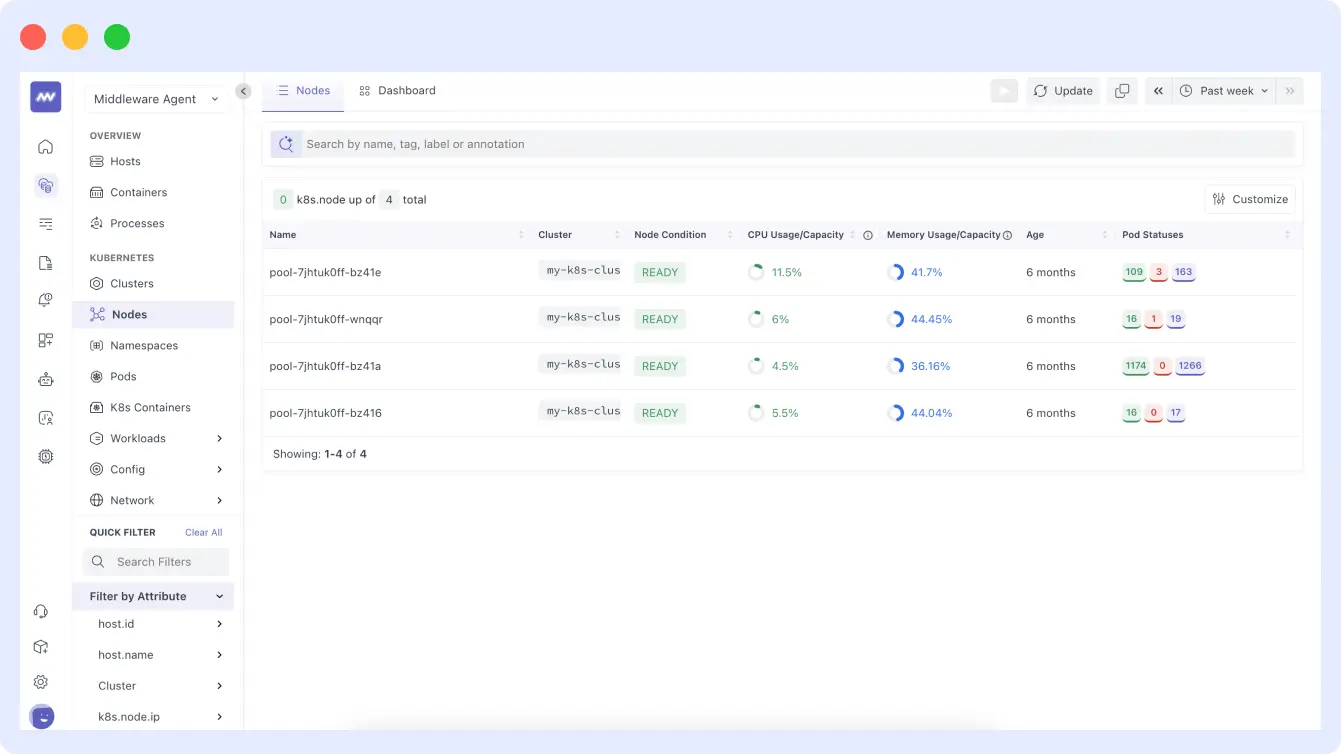
- Analyze node-level CPU and memory usage.
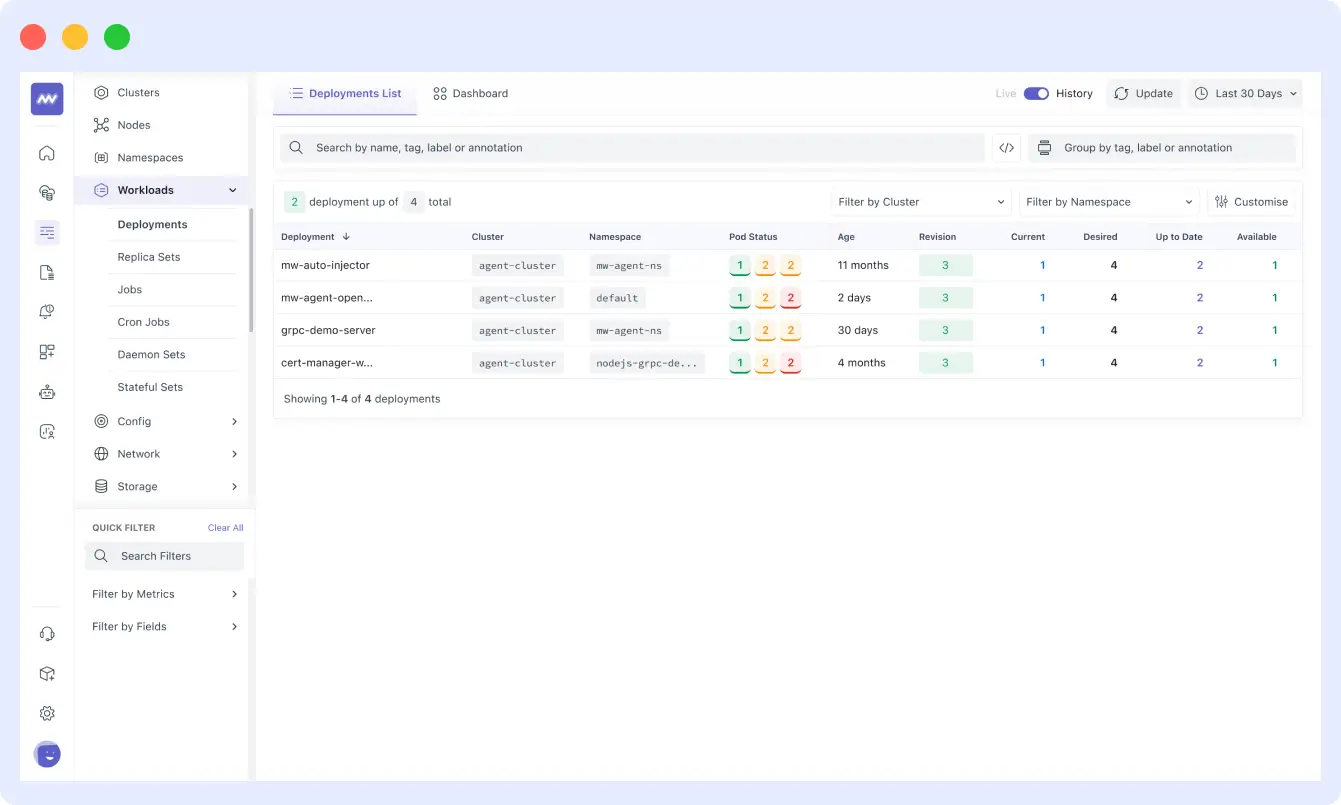
- Track the health and status of deployments over time.
- Detect performance bottlenecks and configuration mismatches quickly.
By integrating Middleware into your debugging workflow, you gain a centralized view of your infrastructure, which significantly improves your ability to detect, investigate, and resolve issues.
You can inspect inside your nodes to view their CPU usage:
You can also monitor the status of your deployments:
Conclusion
Effectively troubleshooting Kubernetes relies on knowing when and how to apply the right debugging approach. Tools like kubectl, events, and audit logs are crucial for day-to-day debugging. However, combining these with a dedicated Kubernetes observability platform, such as Middleware, enhances visibility, reduces MTTR (mean time to resolution), and ensures smoother operations across your Kubernetes environment.