Summary
Every time an alert fires, most developers open four tabs before they write a single line of code. Middleware MCP Server eliminates that pattern by connecting AI-powered IDEs directly to your observability data via 21 structured tools that cover APM, logs, metrics, traces, dashboards, error tracking, and incidents. Investigation, triage, and root cause analysis all happen inside the editor, no tab switching required.
TL;DR
- Middleware MCP Server is an open implementation of the Model Context Protocol that connects AI-powered IDEs (Cursor, Claude Desktop, VS Code, Windsurf, and others) to your Middleware observability data.
- It exposes 21 structured tools covering dashboards, widgets, metrics, queries, alerts, errors, and incidents, so an AI assistant can investigate production issues without you leaving the editor.
- Three transport modes are supported: stdio, http, and sse. Tool access can be restricted via EXCLUDED_TOOLS for read-only or non-destructive deployments.
- The result: fewer context switches, faster root cause analysis and observability that lives where the code lives.
Modern developers spend too much time switching between tools for debugging issues.
A typical debugging workflow looks like this:
An error occurs in production → Open the observability platform → Search logs and traces → Analyze dashboards → Switch back to the IDE → Make code changes → Repeat.
This constant context switching slows down incident resolution and reduces developer productivity.
What if you could access your observability data directly from your IDE without leaving your coding environment?
That’s exactly what the Middleware MCP Server enables.
What is Middleware MCP Server?
Middleware MCP Server is a Model Context Protocol (MCP) server that enables AI assistants, including Cursor, Claude Desktop, Windsurf, VS Code, and other MCP-compatible clients, to interact with Middleware’s full-stack observability platform securely.
Through a single MCP connection, AI assistants can access and analyze observability data across Application Performance Monitoring (APM), logs, metrics, traces, dashboards, alerts, error tracking, and infrastructure monitoring.
How the Middleware MCP Server Works
The Middleware MCP Server connects your AI assistant directly to observability data, eliminating the need to switch between dashboards, log viewers, and tracing tools. Developers query their systems in natural language and get actionable answers inside the IDE.
What it connects to
Through a single bridge, the AI assistant gains access to:
- Application Performance Monitoring (APM)
- Logs, metrics, and traces
- Dashboards and alerts
- Infrastructure monitoring
- Error tracking
Troubleshooting, investigation, and remediation all happen in a single workspace, reducing context switching and shortening incident resolution time.
How it handles a question
The server exposes a set of structured, secure tools purpose-built for observability workflows. Ask something like:
“Why is my checkout service returning 500 errors?”
The assistant then:
- Pulls the relevant errors
- Fetches associated traces
- Retrieves matching logs
- Analyzes metric trends
- Correlates signals across sources
- Returns the findings in your IDE
Context is assembled automatically instead of being gathered screen by screen.
Supported tool categories
Metrics and querying — interact with observability data conversationally:
- Query logs, metrics, and traces
- Retrieve resources
- Discover available metrics
Error investigation — speed up incident response with:
- Error listing
- Incident investigation
- Root cause analysis
- Detailed error context
Safer Deployments with Tool Exclusion
Not every team wants their AI assistant to be able to delete dashboards or create alerts. The server supports an EXCLUDED_TOOLS environment variable that lets you carve out a more restricted surface useful for read-only deployments, sandboxed environments, or junior engineers.
Example:
EXCLUDED_TOOLS=delete_dashboard,delete_widget,create_alertThis is the kind of guardrail that makes MCP usable in production environments where you want the benefits of AI-assisted investigation without the risk of irreversible actions.
Real-World Use Cases
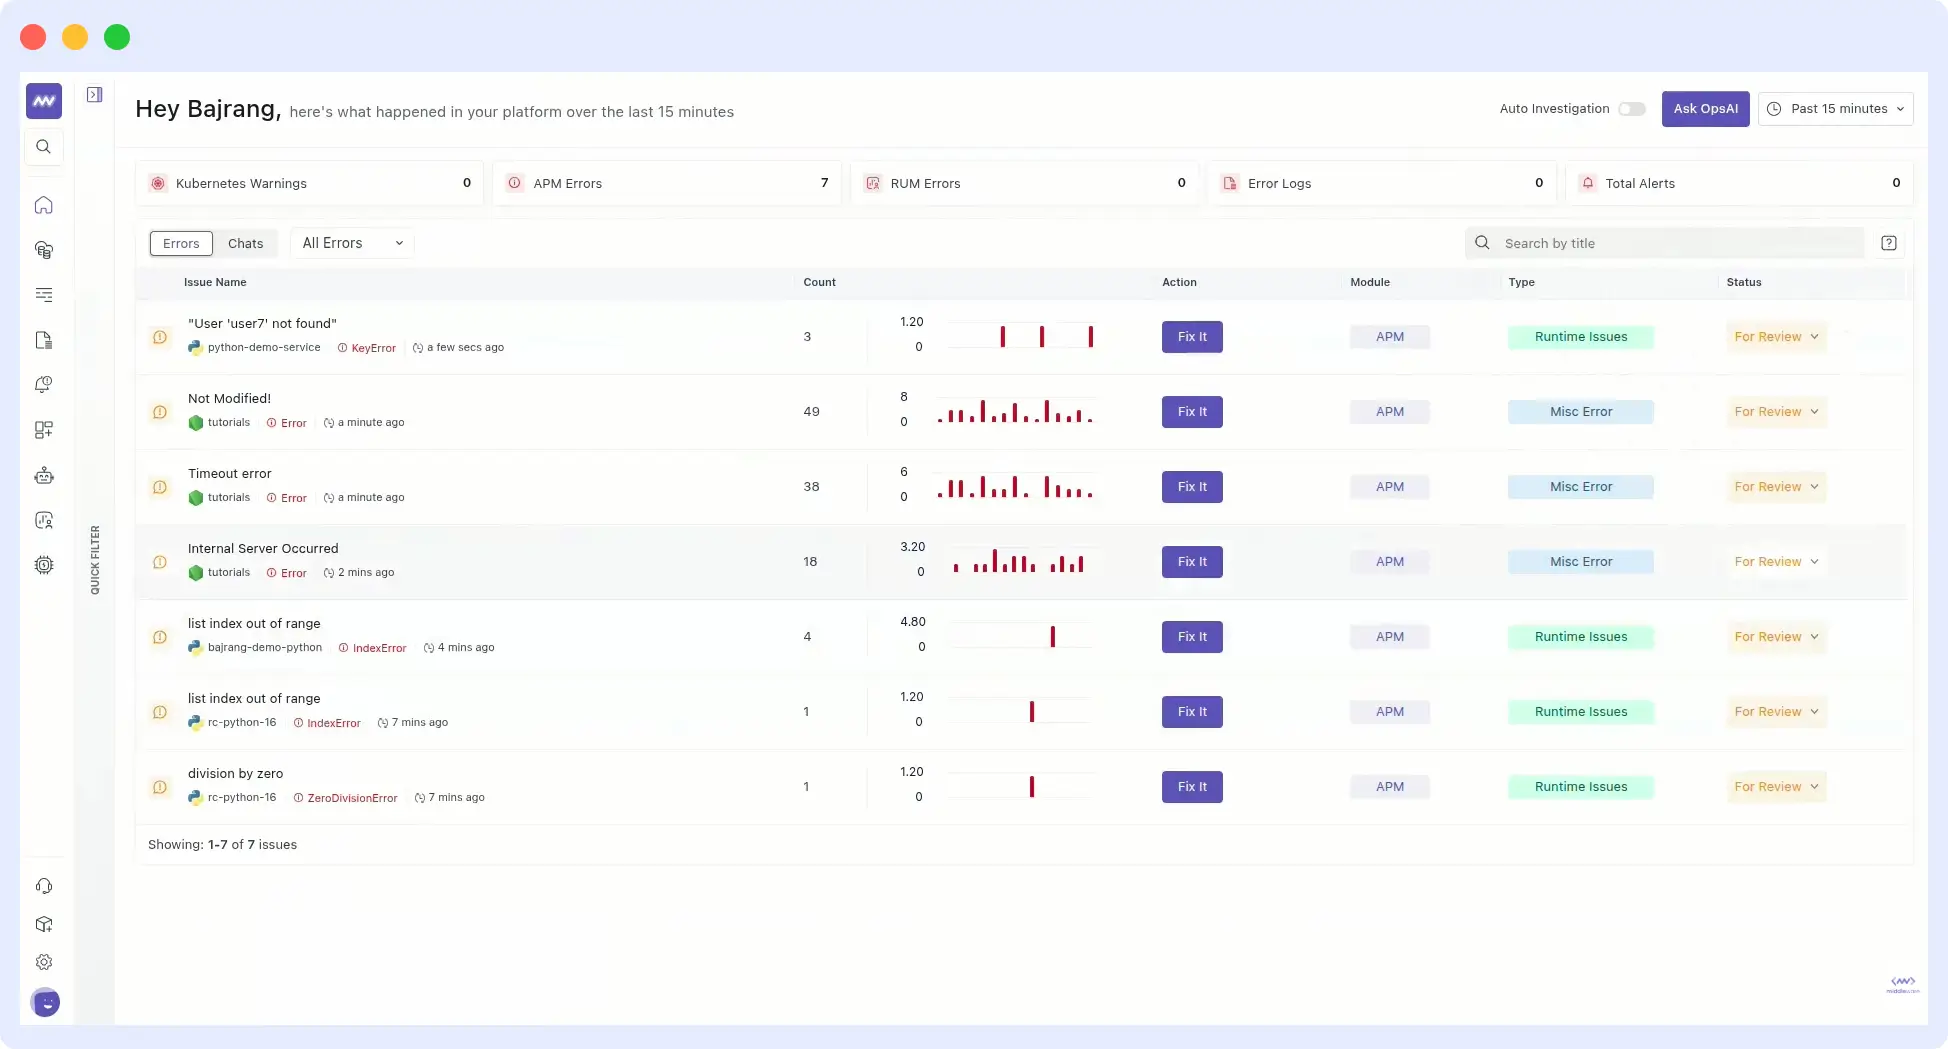
1. Triage production errors without leaving the IDE
Instead of opening Middleware, filtering by service, and scanning the error list, ask:
“Show me the top errors in the payment service from the last hour.”
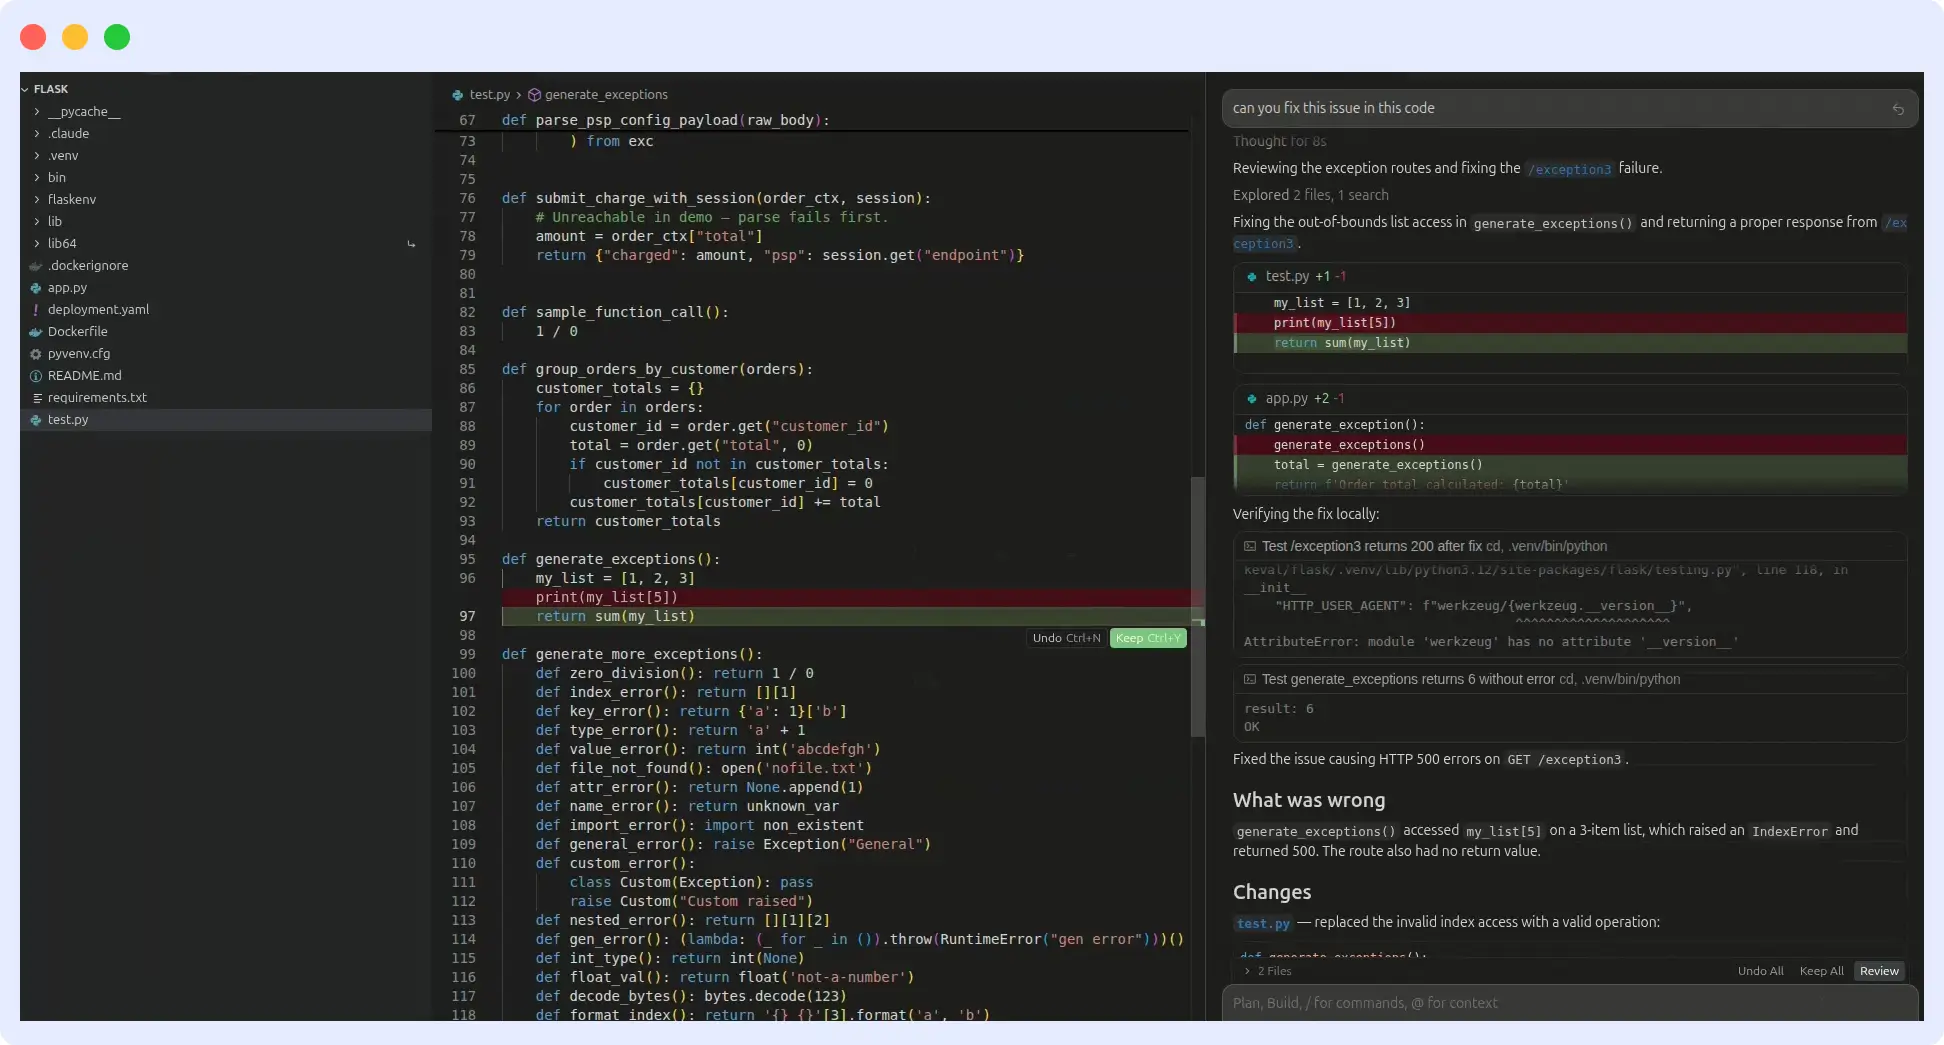
The assistant calls list_errors with the right filters, picks the most relevant fingerprint, and follows up with get_error_details to surface stack traces and affected requests. You stay in the editor, see the error context next to the code, and start fixing.
For Kubernetes deployments, this pairs especially well with OpsAI’s pod crash auto-remediation. The MCP Server surfaces what went wrong, while OpsAI handles the fix.
2. Find the slow endpoint behind a latency spike
Ask:
“Which endpoint has the highest p95 latency today, and what does its trace look like?”
The assistant uses a query to pull APM data, identifies the endpoint, fetches a representative distributed trace, and presents it inline. You can now jump directly to the file and function in question.
3. Investigate why an alert fired
When an alert lands in Slack, paste it into the assistant and ask:
“Why did this alert trigger?”
The assistant uses get_alert_stats for historical context, then query to inspect the underlying metrics, logs, and traces around the trigger window. With Middleware’s OpsAI layered in, it can also reason across signals and point you toward the likely code path responsible for the regression.
4. Audit existing alerting before an on-call rotation
Before going on-call, ask:
“List all alerts on the checkout-service and show me which ones have fired more than three times this week.”
The assistant pulls list_alerts, then get_alert_stats for each. You get a heatmap of noisy alerts that probably need tuning before they wake you up at 3 AM.
Why This Matters for Middleware Specifically
Middleware is a full-stack, OpenTelemetry-native observability platform. That means every signal APM traces, logs, metrics, infrastructure data, RUM and errors already lives in one correlated dataset. The MCP Server exposes that correlated dataset to AI assistants as structured tools, making it especially powerful compared to MCP servers built on siloed observability tools.
A few things that compound the value:
- OpsAI integration. Middleware’s OpsAI is built to reason across signals and identify likely root causes. See how OpsAI was built to troubleshoot production incidents end-to-end. The MCP Server makes OpsAI’s reasoning available inside the IDE, not just inside the Middleware app.
- OpenTelemetry-native by default. No vendor-specific agents to install for new languages or frameworks. If you can emit OTel data, the MCP Server can investigate it.
- Unified query surface. The query tool works across logs, metrics, and traces. You do not need separate MCP tools or separate mental models for each telemetry type.
How to set up Middleware MCP server – Getting Started
Setup typically takes a few minutes:
Step 1: Open the Middleware MCP documentation.
Step 2: Choose your IDE (Cursor, Claude Desktop, VS Code, Windsurf, Antigravity, Gemini CLI, Codex CLI, or any other MCP-enabled tool).
Step 3: Copy the provided MCP configuration block.
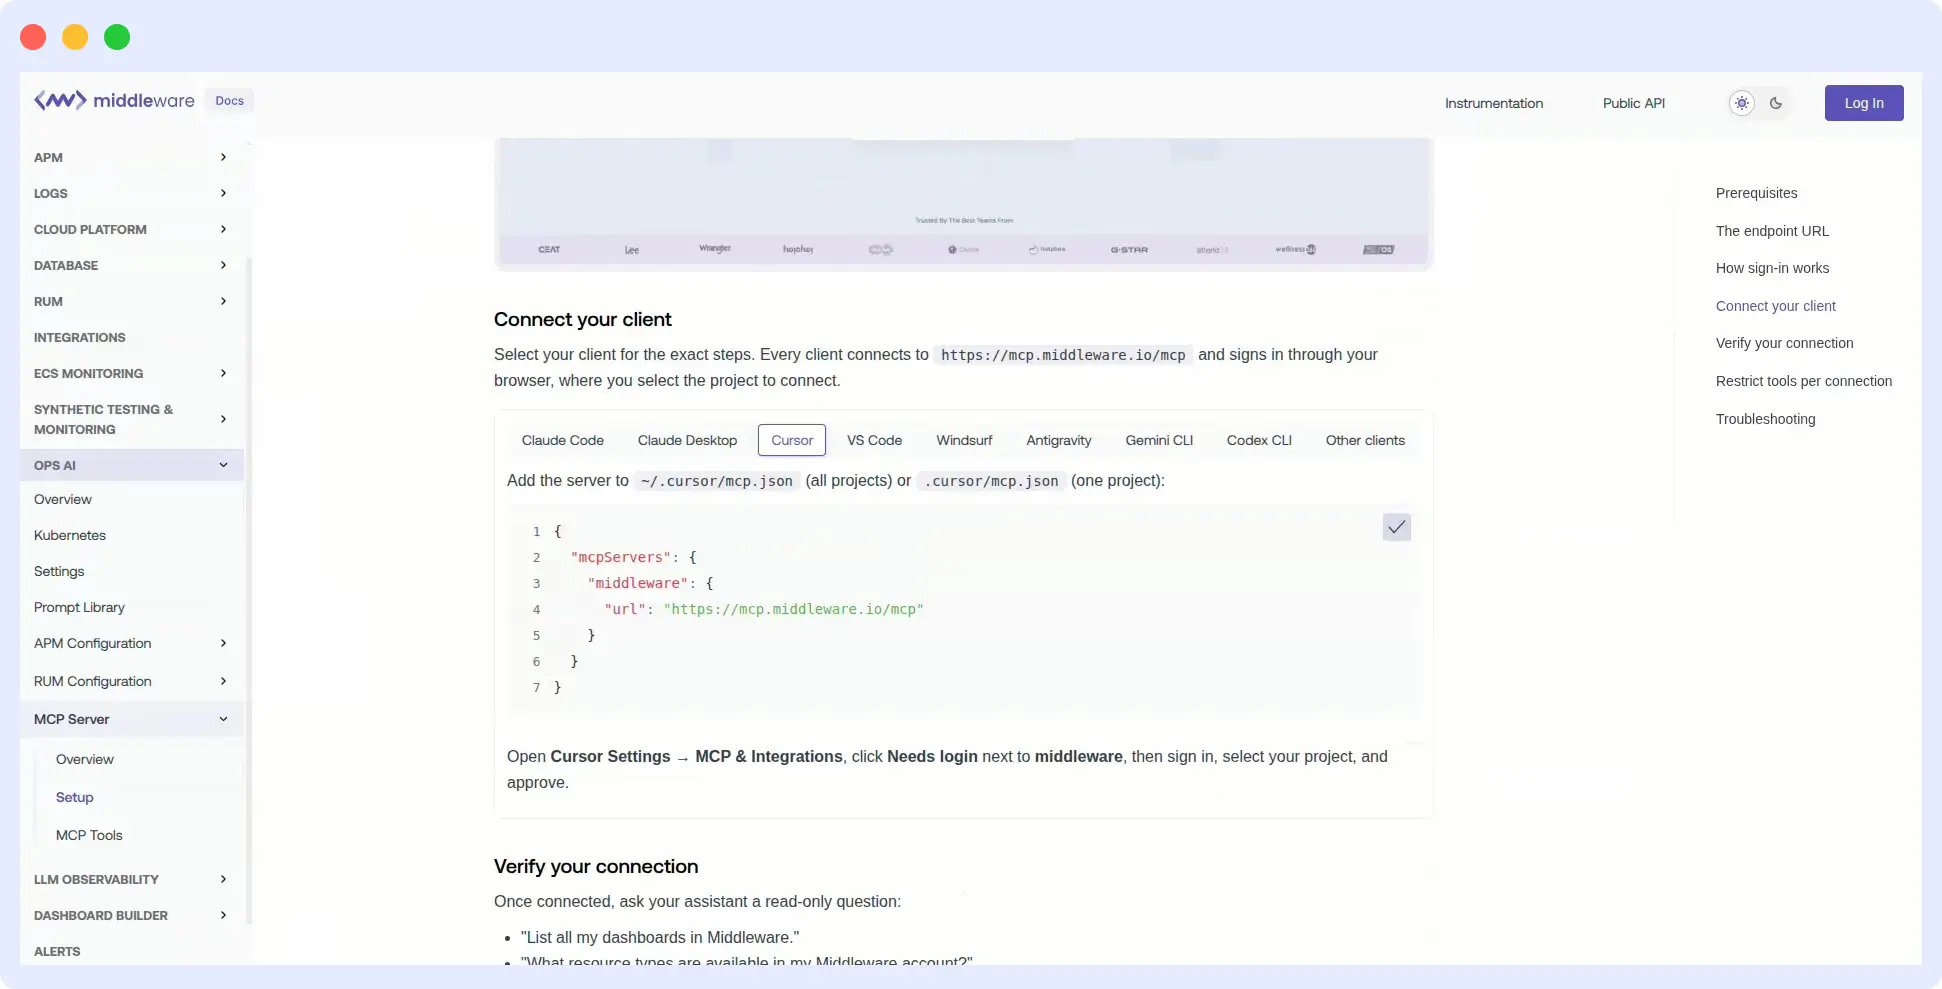
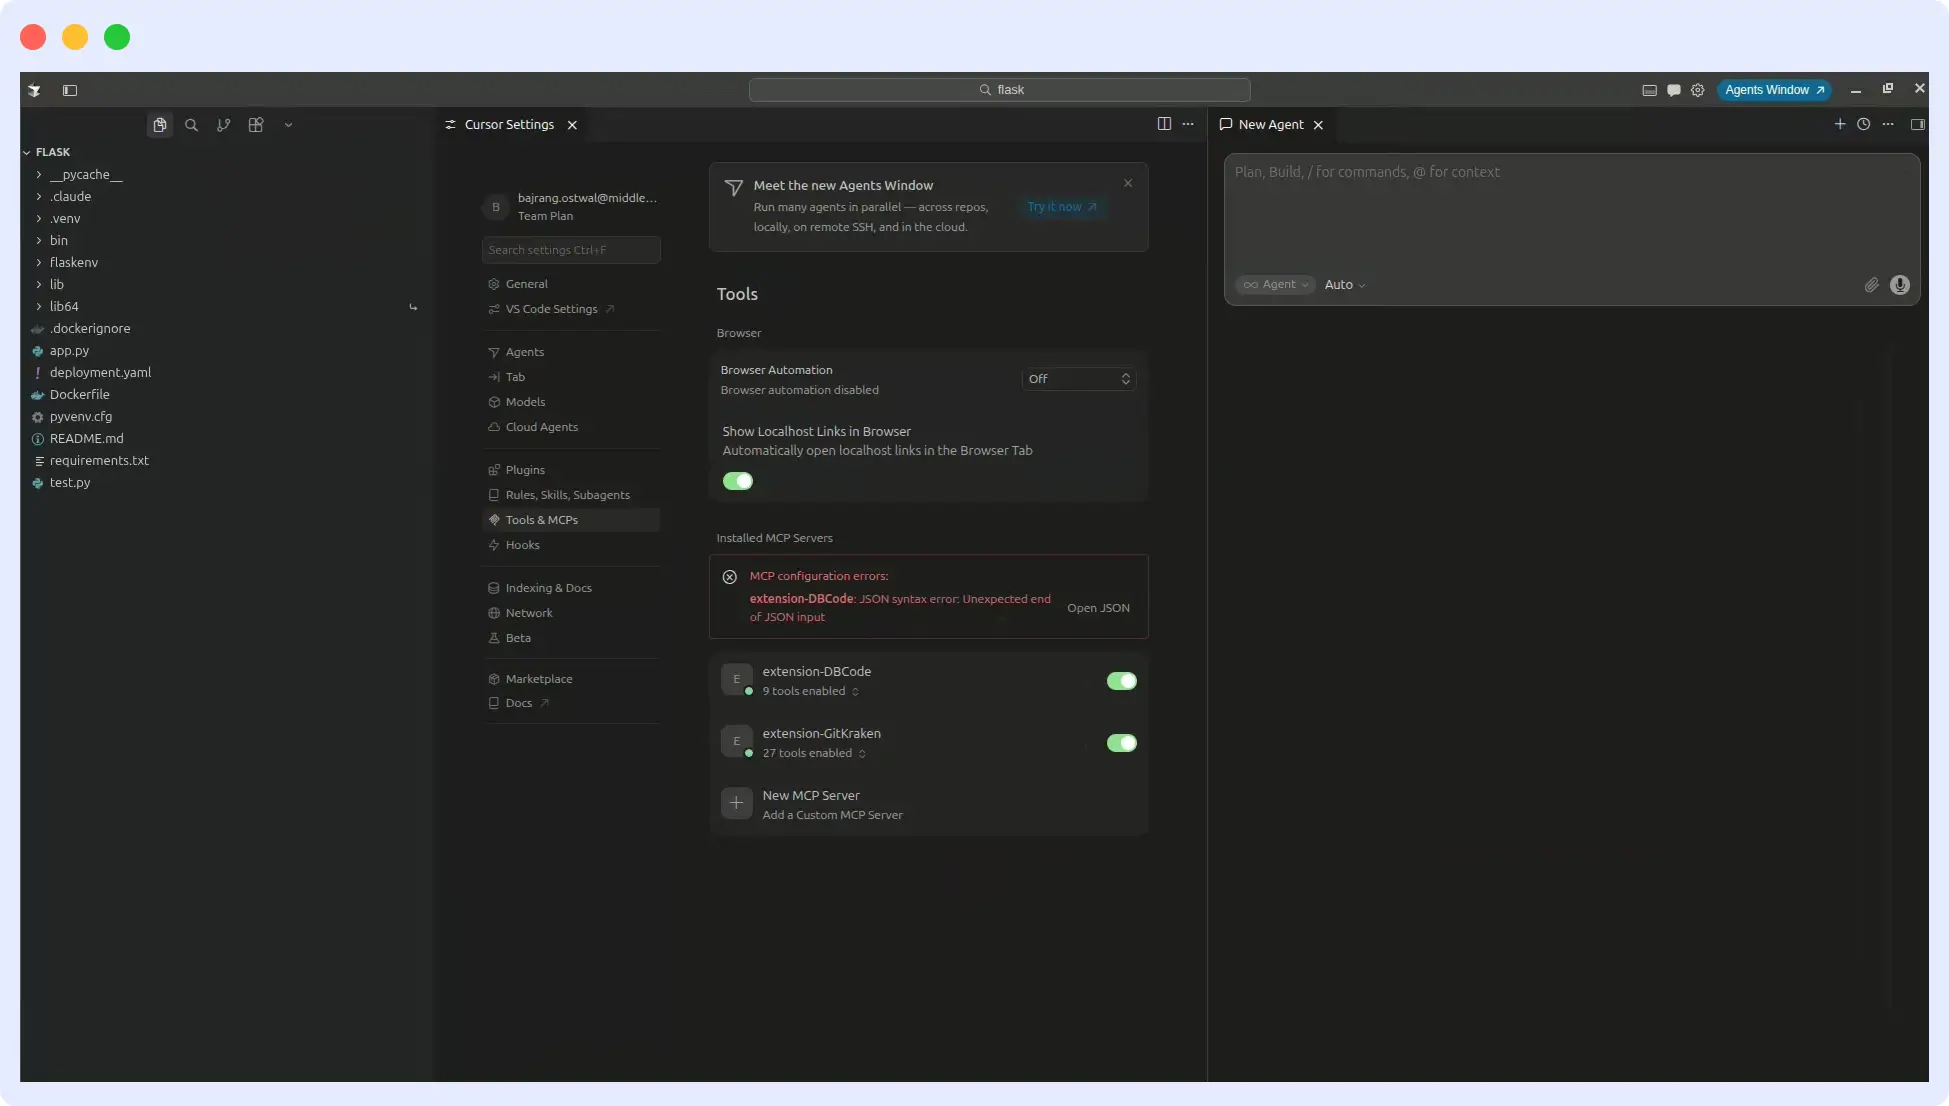
Step 4: Add the MCP Server entry to your IDE’s MCP config file.
Step 5: Authenticate against your Middleware account.
Step 6: Start asking questions.
Once connected, your AI assistant has the observability context it needs to help with investigation, performance analysis, alert triage, and dashboard work, all without leaving your editor.
A short walkthrough is available here:
The Future of Observability Is Inside the IDE
Developers should not have to leave their editor to understand what is happening in production. The Middleware MCP Server collapses that gap by bringing logs, metrics, traces, dashboards, alerts, and incidents directly into AI-powered IDEs through a structured, secure tool interface.
The outcome is concrete: faster debugging, fewer context switches, shorter incident resolution, and a noticeably better developer experience.
If your team already builds with AI-assisted IDEs, the Middleware MCP Server is the missing piece that brings real production observability into the conversation.
Start using the Middleware MCP Server today and turn your IDE into a complete observability workspace.
FAQs
What is the Model Context Protocol (MCP)?
MCP is an open standard for connecting AI assistants to external systems via structured tool calls. Each tool has a defined name, input schema, and response format, which keeps interactions predictable and easier to debug.
Which IDEs and clients does the Middleware MCP Server support?
Any MCP-compatible client, including Cursor, Claude Desktop, VS Code, Windsurf, Antigravity, Gemini CLI, and Codex CLI.
Can I make the deployment read-only?
Yes. Use the EXCLUDED_TOOLS environment variable to remove any tools you do not want the assistant to access — including all destructive operations.
Does the MCP Server give the AI raw access to my data?
No. The AI can only invoke specific, schema-bound tools. Each tool maps to a defined Middleware API call. There is no raw database or unstructured API access.
Does this work with OpsAI?
Yes. OpsAI’s reasoning is available through the MCP integration, which means root cause analysis and correlated investigation occur within your IDE alongside your code.
Is OpenTelemetry support required?
Middleware is OpenTelemetry-native, so any service that emits OTel data is automatically queryable via the MCP Server. You do not need separate agents per language.