Middleware’s new and improved platform provides complete control over telemetry data and costs, new monitoring capabilities, faster root cause analysis, and broader integration support.
Over the last few years, we’ve witnessed a fundamental shift, driven by the relentless growth of complex, distributed systems. Monolithic applications are giving way to microservices architectures, and with them, a growing IT industry that traditional monitoring tools simply can’t handle.
Two years ago, we recognized this challenge as an opportunity. The goal was to move beyond basic metrics to true observability, where we could ingest and analyze massive datasets – logs, traces, metrics – to paint a holistic picture of application health in a cost-effective way.
Middleware was born to empower development and operation teams to not just react to fires, but to proactively identify and prevent issues before they disrupt users. The ability to monitor applications and infrastructure in real-time allowed developers to improve end-user experience, boost operational efficiency, minimize downtime, and ensure a positive impact on the bottom line.
“Developers no longer want outdated debugging systems. They seek faster, cost-effective, automated solutions for monitoring distributed architectures with scalable and easy-to-learn real-time observability capabilities. Back in 2022, our goal was to drive adoption by providing cost-effective, end-to-end observability.”
Laduram Vishnoi, Founder and CEO, Middleware.
However, a lot has changed since. Observability is no longer a buzzword or an afterthought, but a core principle woven into the fabric of modern software development. It’s a collaborative effort, where developers, SREs, and operations teams work together to ensure a seamless user experience (UX). This requires not just powerful tools, but a commitment to knowledge sharing and a deep understanding of the systems we’re building.
To achieve this, Middleware needed to be more intuitive and user-friendly while providing comprehensive insights into every layer of the tech stack, from the infrastructure to the application, without the complexity that typically comes with such solutions.
“By analyzing global customer insights across various industries, we’ve pinpointed where users struggled and the features they desired. This feedback has been crucial in shaping the new Middleware platform,” Vishnoi adds.
“Our mission is to simplify the observability process to the extent that the dev and ops teams can use the platform intuitively within a minute. This update is a testament to that mission. We’ve made it much easier for users to set up services and get started quickly, without having to deal with a steep learning curve. We’ve also incorporated significant changes, both minor and major, to enhance the overall user experience and functionality of the platform.”
Laduram Vishnoi, Founder and CEO, Middleware.
What’s improved within Middleware?
UI/UX enhancements
Users expressed appreciation for the depth of information provided in the first version of Middleware but desired a more intuitive workflow for correlating signals.
To address this, we’ve included the following updates in the latest version:
1. New UI with reusable components
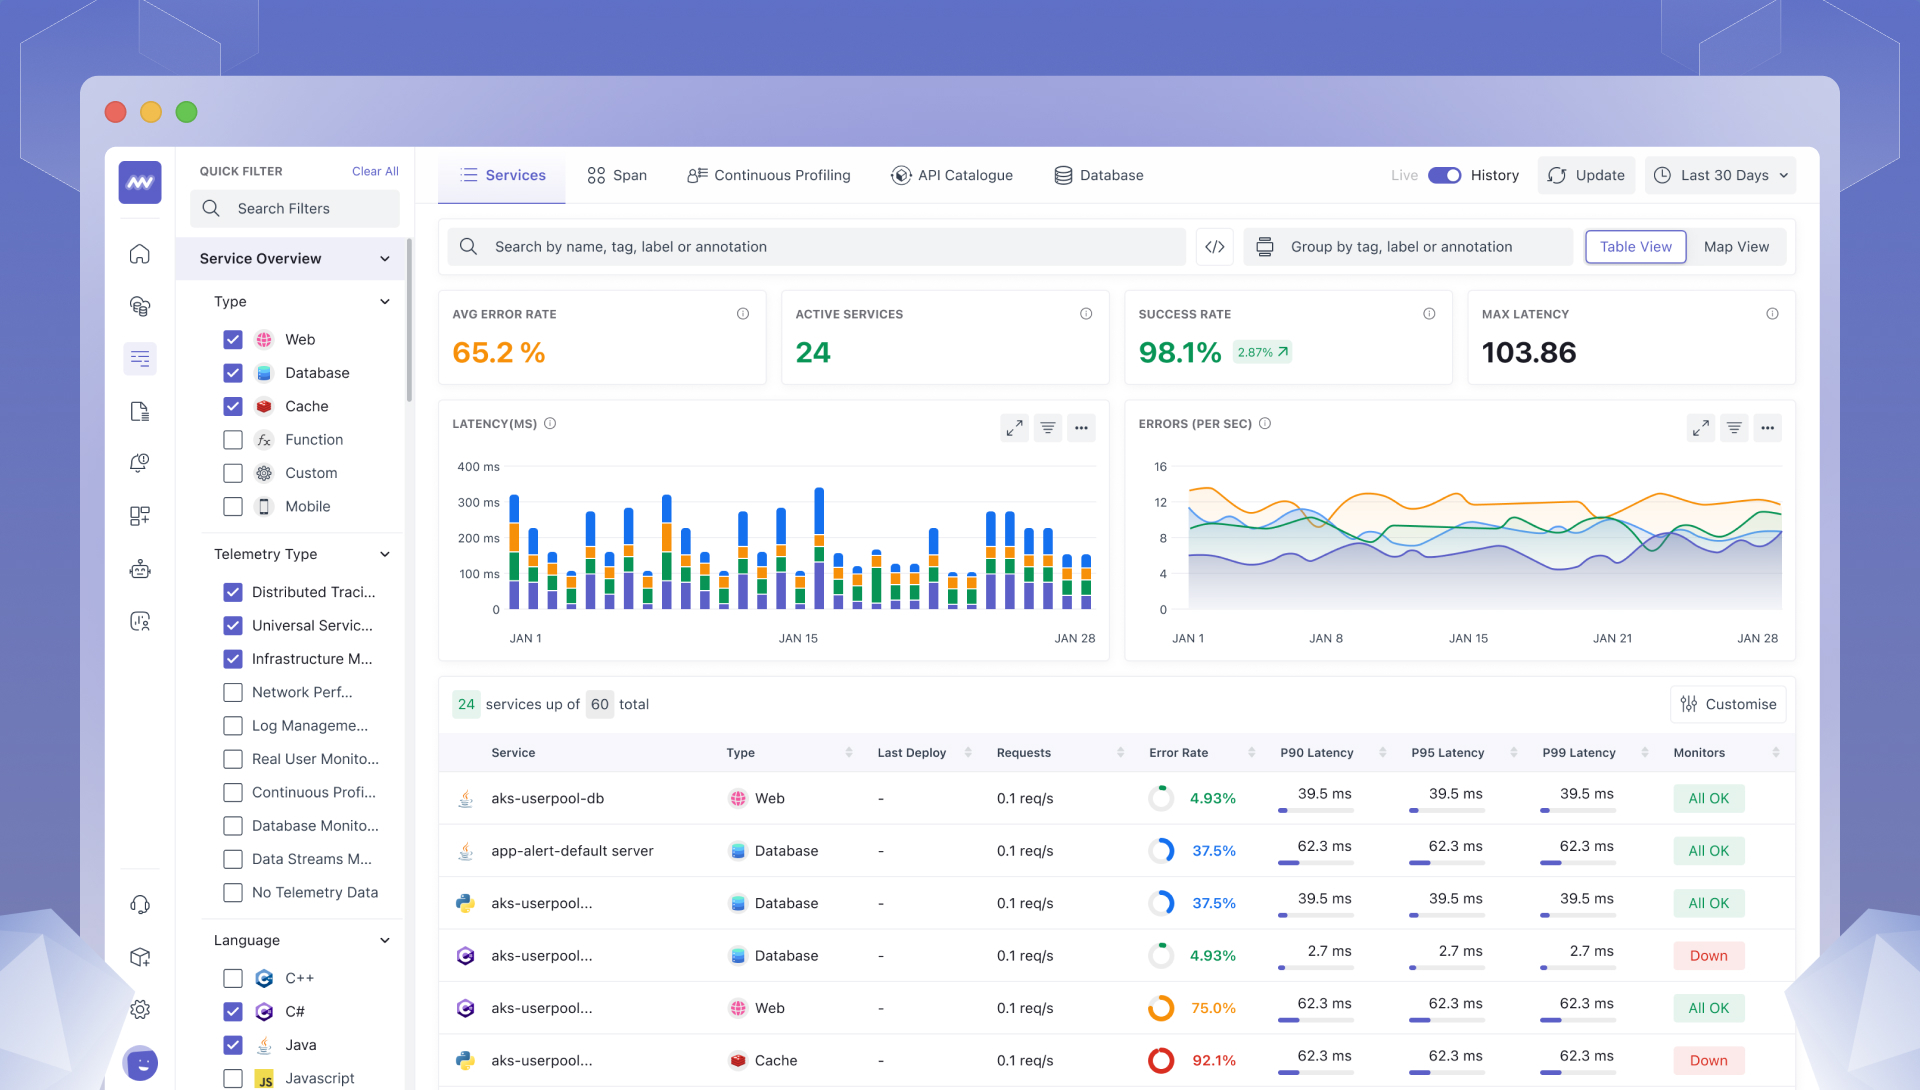
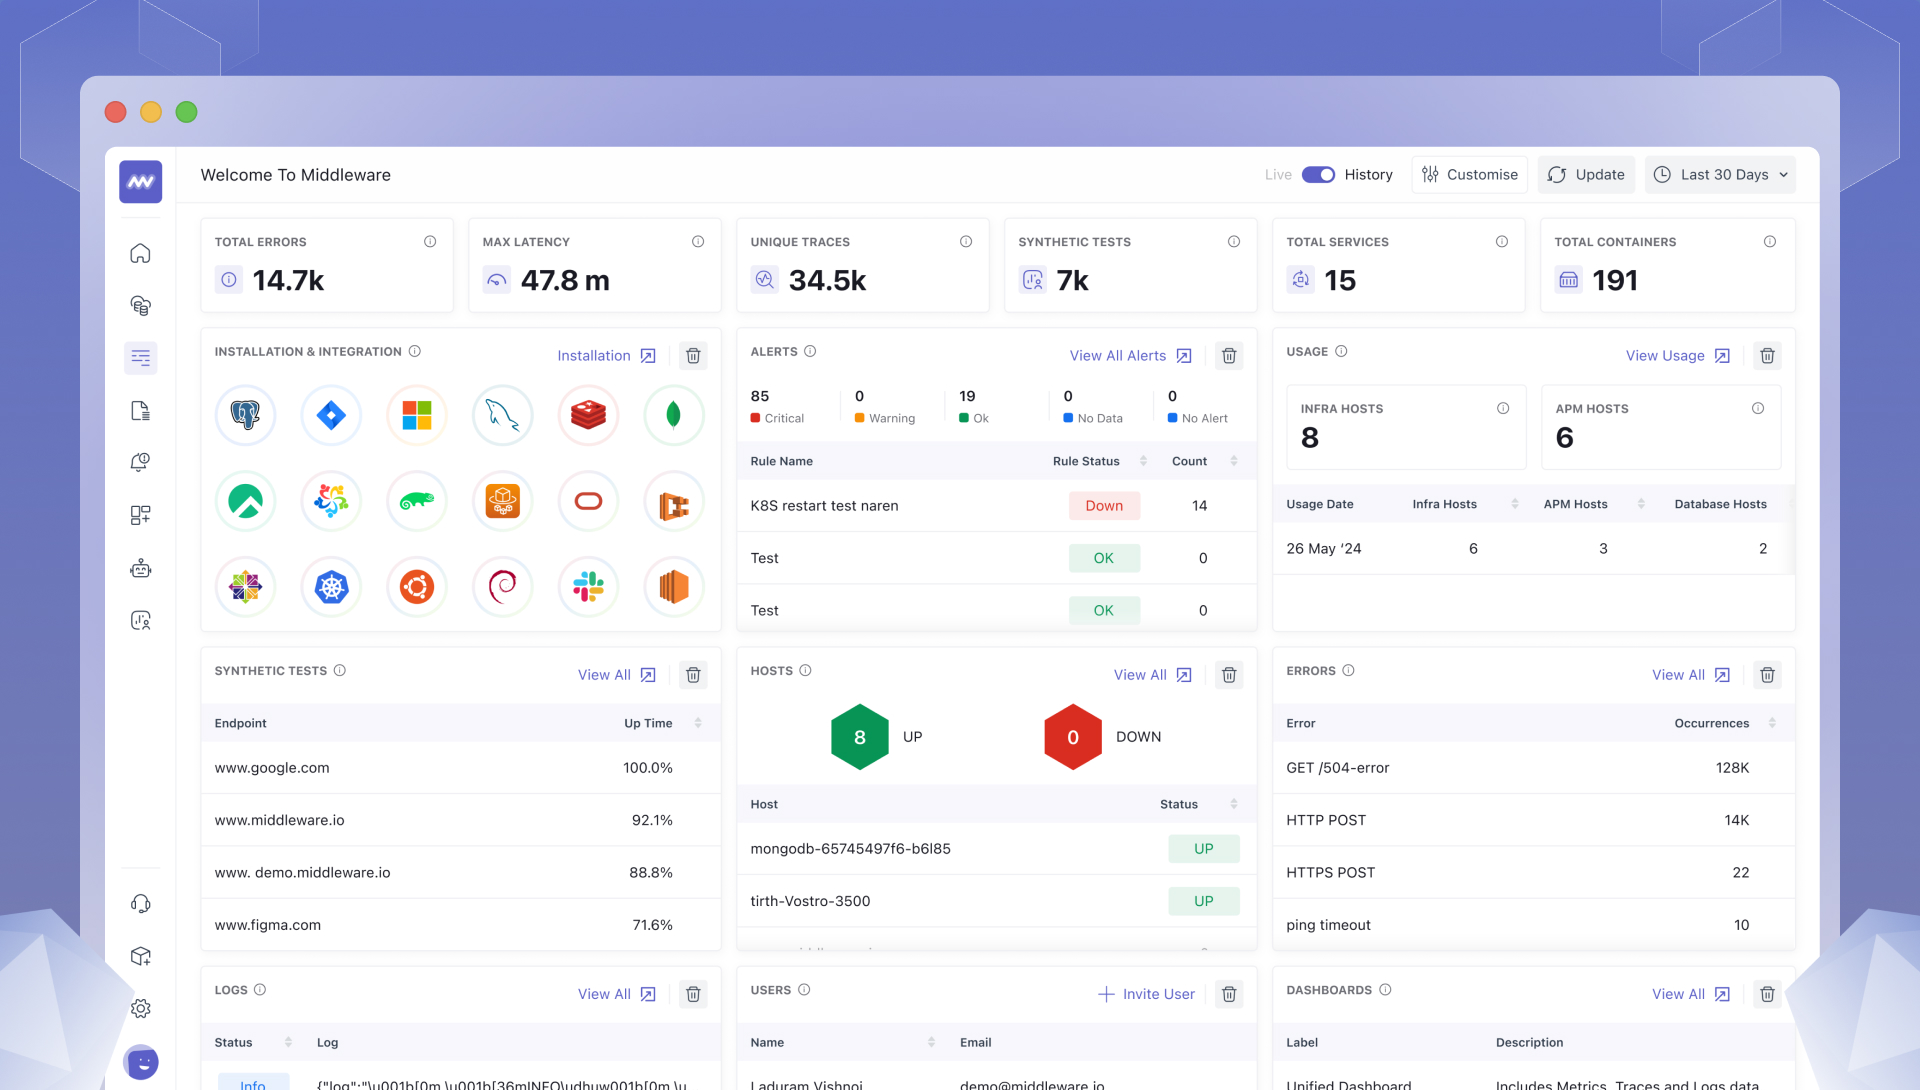
Over 300 screens have undergone a comprehensive redesign with reusable components that ensure a consistent and streamlined UX throughout the Middleware. Not only does this improve visual aesthetics, but it enhances functionality and simplifies navigation.
2. Enhanced dashboard builder
Middleware’s dashboard builder has undergone a complete overhaul. We have added alerts on custom metrics and introduced 100 new dashboards. The improved UI/UX ensures that users can easily build and customize dashboards to suit their specific needs.
3. Simpler installation and documentation
The installation process and documentation website have been thoroughly revamped to help users set up and utilize Middleware’s features with ease, reducing onboarding friction and accelerating time to value.
4. Interactive features for data correlation
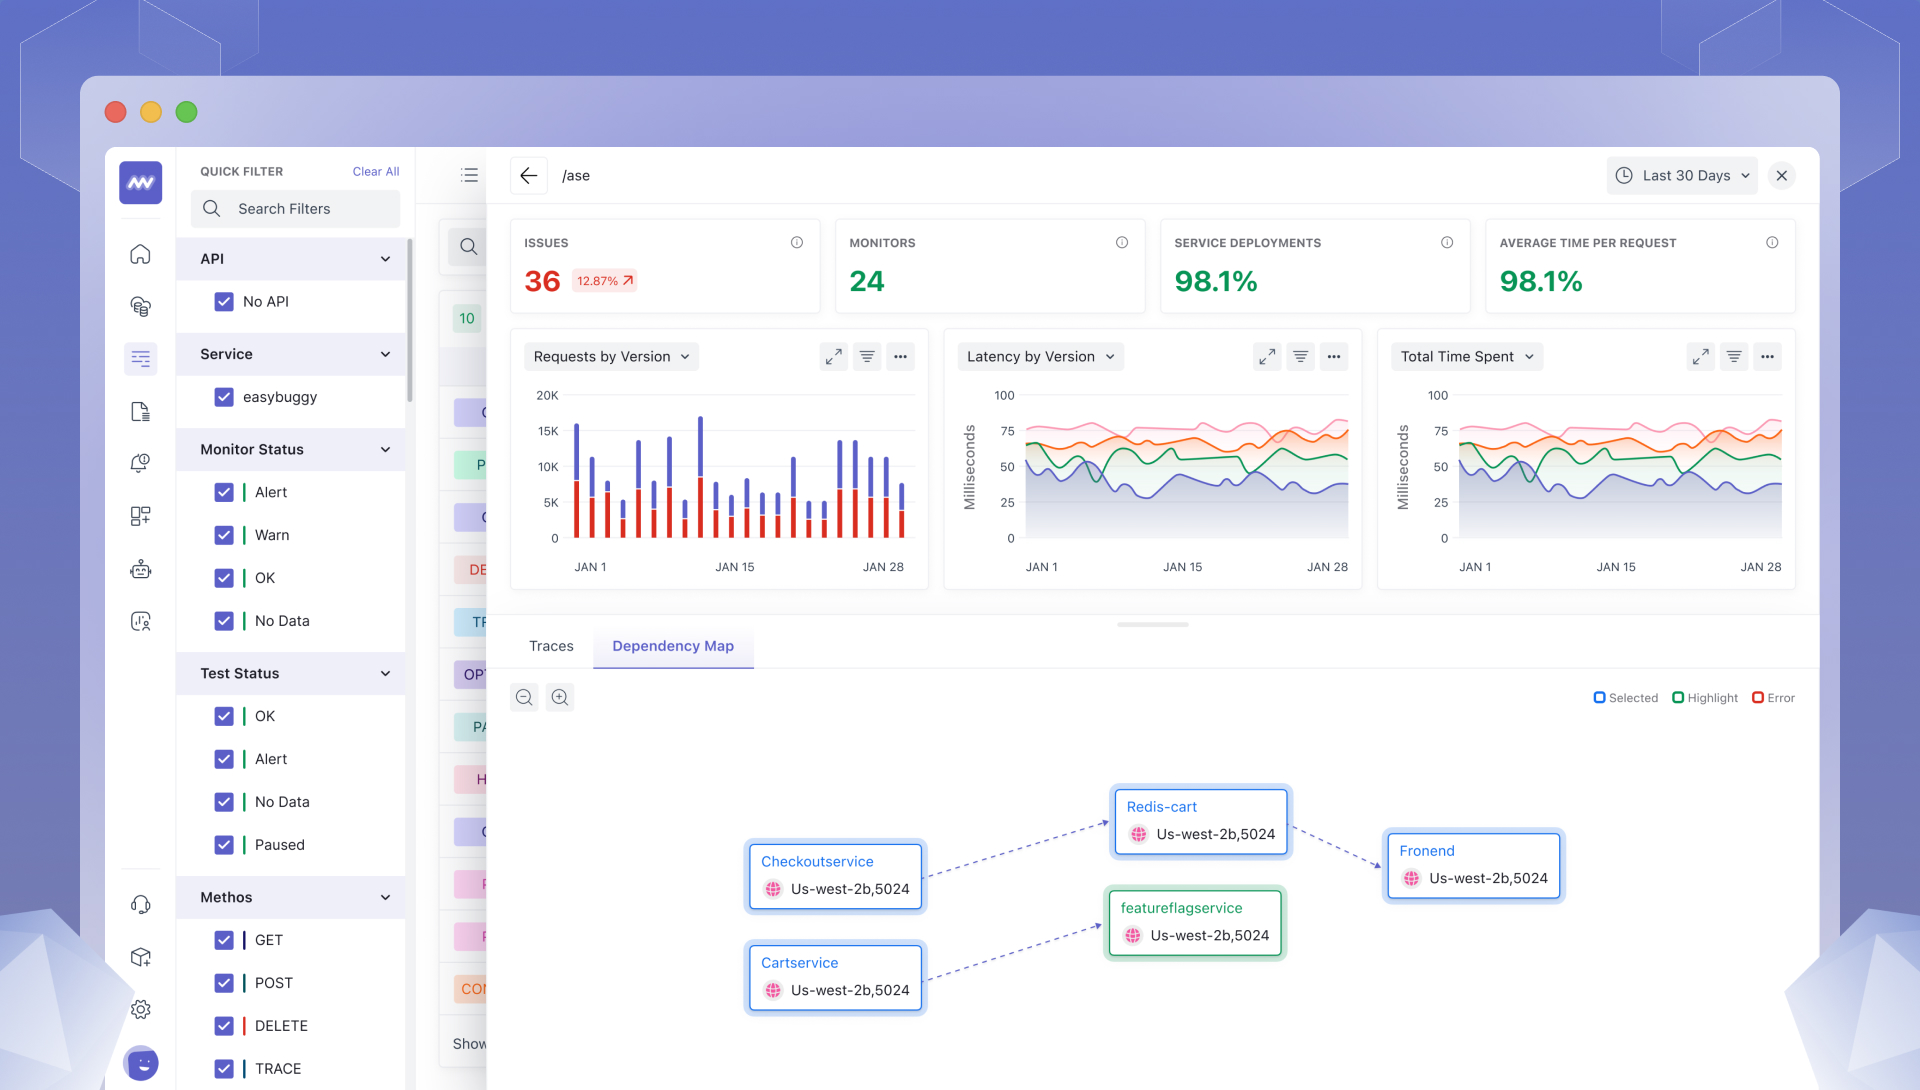
Our platform can facilitate data correlation across multiple graphs. Users can now move the mouse along the X-axis of one graph to view corresponding data points on all graphs simultaneously. This streamlines data analysis and improves overall usability.
5. Date picker
We have standardized the date picker across all features, ensuring a consistent user experience and simplifying date selection and navigation throughout the platform.
6. High-performance charting library
Middleware now features Highcharts to enhance data visualization capabilities. Developers can now gain a clearer and more interactive representation of data for quick and effective insights.
Technology enhancements (features and functionalities)
1. Datadog agent support
Developers can now send logs, metrics, and traces from Datadog agents directly to Middleware. This eliminates the need for new agents or configurations, making the transition to Middleware effortless.
2. Auto-instrumentation
Middleware now supports auto instrumentation for applications written in Python, Node.js, Java, .NET, and Golang using the OpenTelemetry operator. This allows for distributed tracing with zero code changes and simplifies the instrumentation process.
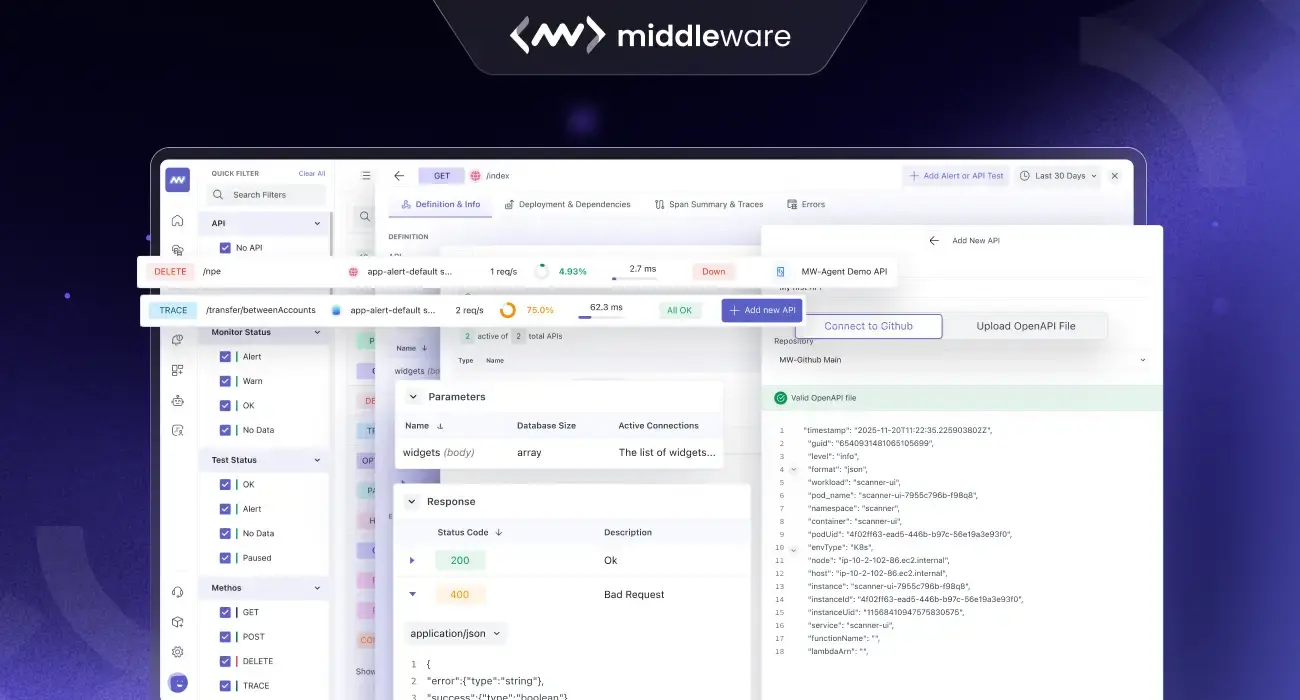
3. New integrations
Middleware now supports AWS integration for collecting logs, metrics, and events from ECS, EC2, S3, RDS, Firehose, Lambda, and EBS, simplifying AWS monitoring with less complex configurations. Middleware can also ingest logs from Elastic Logstash, thereby replacing Elastic Search & Open Search.
4. Status page
Users can now create status pages and publish them to their websites. This feature allows for synthetic checks and incident management, providing a public-facing status page that displays the availability of services/products. Users can also send notifications via Slack and email, keeping stakeholders informed during outages.
5. Product performance monitoring within real user monitoring (RUM)
Middleware’s RUM now tracks core web vitals such as First Contentful Paint (FCP), Largest Contentful Paint (LCP), First Input Delay (FID), and Cumulative Layout Shift (CLS). It will also support native iOS and Android apps, delivering insights on performance metrics and user interactions across mobile platforms.
6. Log patterns
Middleware’s new log pattern feature enables users to quickly identify logs by creating a pattern for the log message. It shows users which machines are emitting similar logs, helping them recognize that the issue may lie in the code rather than a specific machine or code replica.
Infrastructure enhancements
1. Query optimization
Several backend queries have been revisited and optimized to enhance query response times and overall system performance. These optimizations ensure that users receive timely and accurate insights into their infrastructure and applications.
2. Database schema optimization
The database schema has been refined to optimize storage efficiency and reduce costs associated with data retention and retrieval. These improvements contribute to a more efficient use of resources and enable Middleware to offer competitive pricing while maintaining high performance standards.
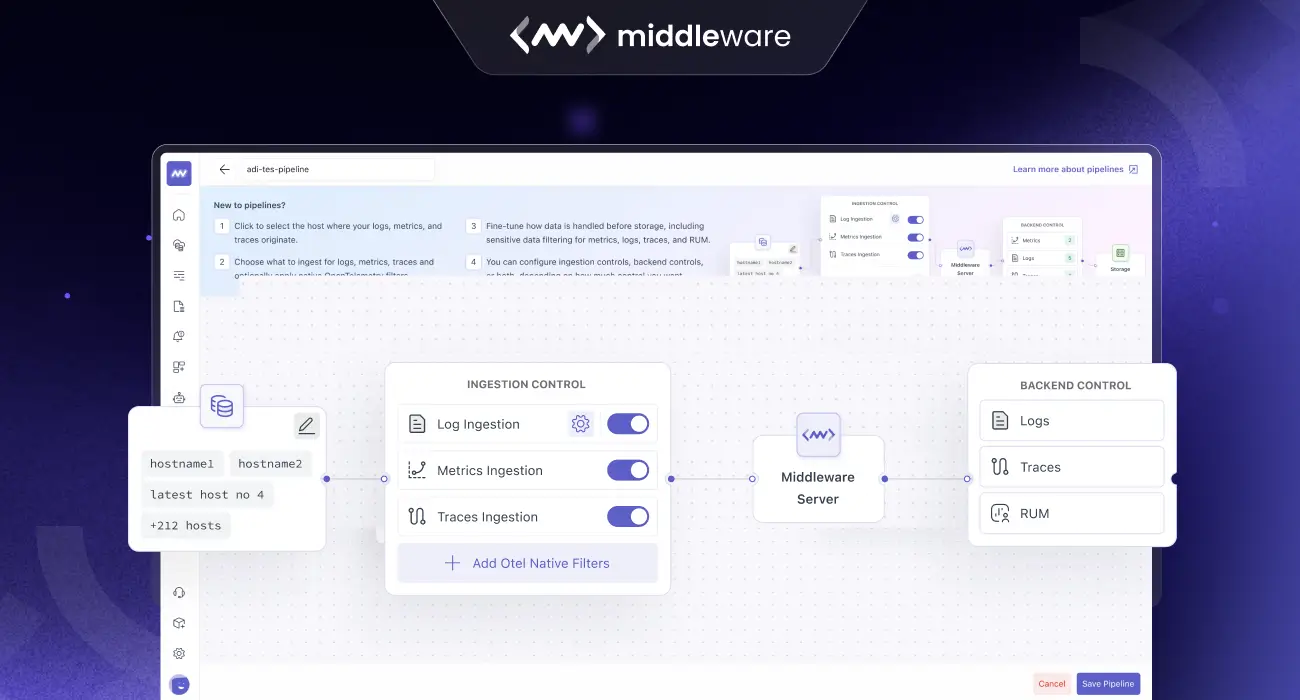
3. Ingestion control and pipelines
Middleware’s ingestion control model allows you to optimize data intake through customizable “feature flags.” This ensures that we only ingest the telemetry data that is crucial to you, such as metrics, traces, logs, and profiling data. Within these categories, we offer granular filtering options. For example, you can choose to ingest logs from specific services or filesystems, keeping your data intake streamlined and cost-efficient.
Read more about how Middleware makes a difference in this exclusive story by AIM.
“At Middleware, we are committed to redefining cloud native observability by making our tools more intuitive, faster, and cost-effective by using cutting-edge technologies like OpenTelemetry, cloud object storage, and fast analytical query processing. With revamped visuals, seamless integrations, and advanced capabilities like log patterns and mobile RUM, we aim to empower SREs, DevOps, and developers to achieve unparalleled insights and efficiency. To further our goal, we will also leverage AI to detect anomalies in the telemetry data, provide alert recommendations, and enable querying using natural language.“
Tejas Kokje, Head of Engineering at Middleware.
This is just the beginning for us. In the months to come, we’d be introducing many more exciting features and functionalities. Stay tuned!
Want to try the latest version of Middleware’s full-stack cloud observability platform for free? Click here.