Running production workloads on Kubernetes without proper observability is like flying blind in adverse conditions. As your applications run across multiple pods, nodes, and services, monitoring your Kubernetes app in real time becomes essential to understand what’s happening under the surface. A single failing pod or resource bottleneck can quickly escalate into a critical outage, making effective Kubernetes app monitoring crucial to ensuring business continuity.
Learn more about Kubernetes observability concepts and best practices in our dedicated guide.
In production environments, Middleware simplifies Kubernetes monitoring by offering a fast, visual way to monitor workloads. Additionally, this modern observability platform provides comprehensive insights through intuitive dashboards and intelligent, real-time alerts.
This tutorial demonstrates how to set up Middleware, monitor metrics and logs in real-time, navigate the UI, and maintain a smooth running of your Kubernetes apps.
Setting Up Middleware for Kubernetes Application Monitoring
Deploy Middleware into your Kubernetes cluster in just a few simple steps. Unlike other monitoring tools that require large configuration files and complex setup procedures, Middleware gets you monitoring in minutes, not hours.
Step 1: Signing up or logging into Middleware
Visit Middleware to create an account or log in if you already have one. The signup is quick and easy; enter your basic details, and you’re ready to start.
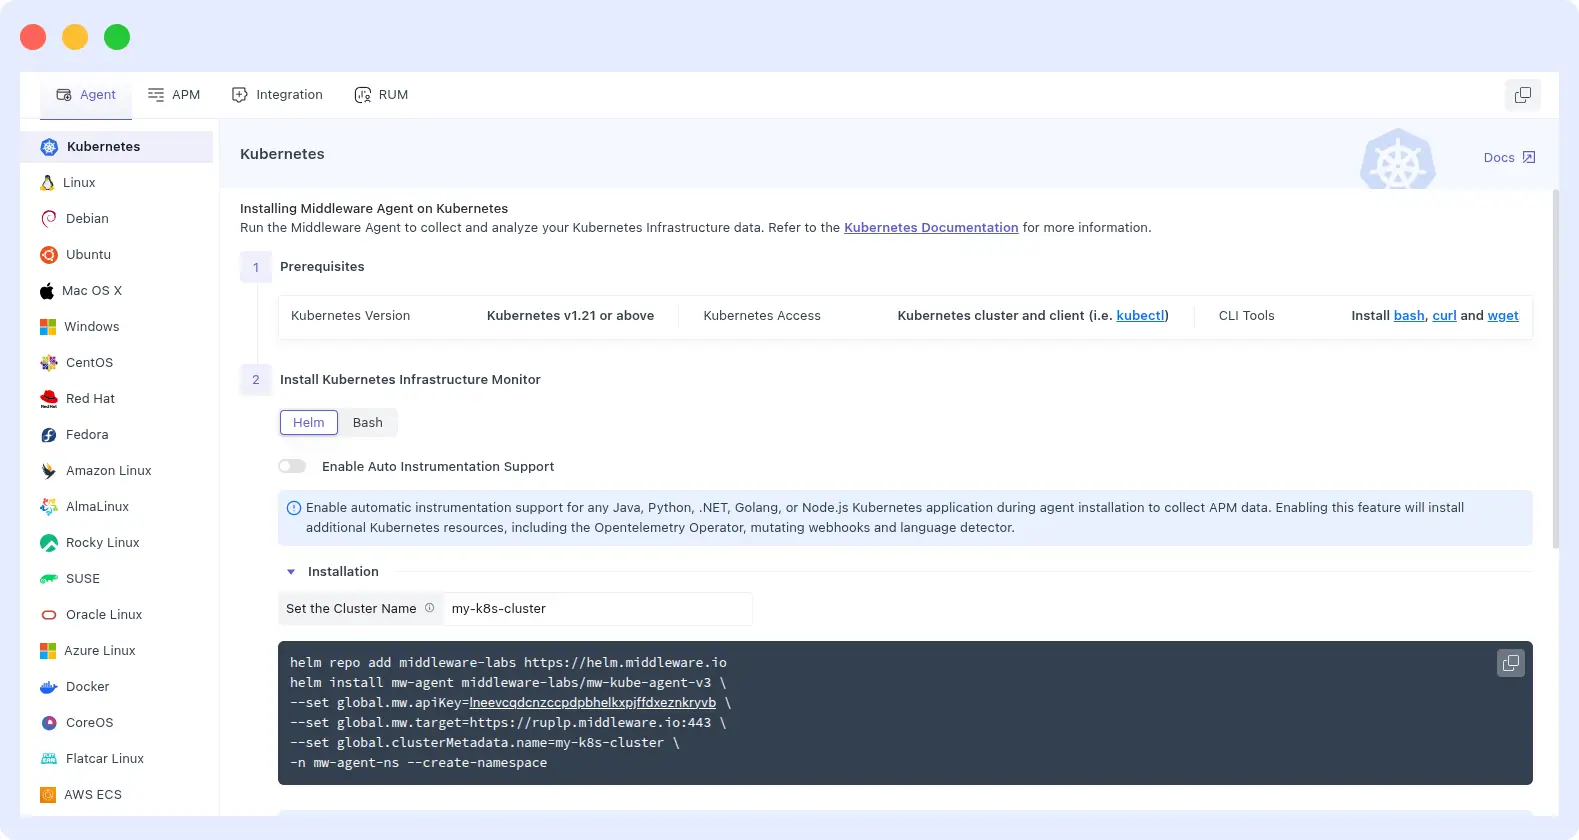
Step 2: Installing the Middleware agent/Helm chart in the cluster
Next, install the Middleware agent in your Kubernetes cluster. Once logged in, Middleware provides a simple Helm chart command that adds the Helm repository. Installing the agent then takes just a few easy steps, as shown below.
For full installation instructions and advanced setup options, refer to the official Middleware documentation → Middleware Kubernetes Agent Installation Guide.
And that’s it! Deployed as a DaemonSet, the agent automatically runs on every node in your cluster, ensuring complete monitoring with no additional setup required.
Step 3: Automatic cluster discovery (nodes, pods, deployments)
Middleware makes cluster discovery effortless, with no manual configuration required. Once the agent is deployed, it automatically detects and monitors all key components:
- Nodes: All worker and master nodes are detected automatically
- Pods: Every pod across all namespaces gets monitored
- Deployments: Your applications and services are identified instantly
- Services: Network components are mapped without manual setup
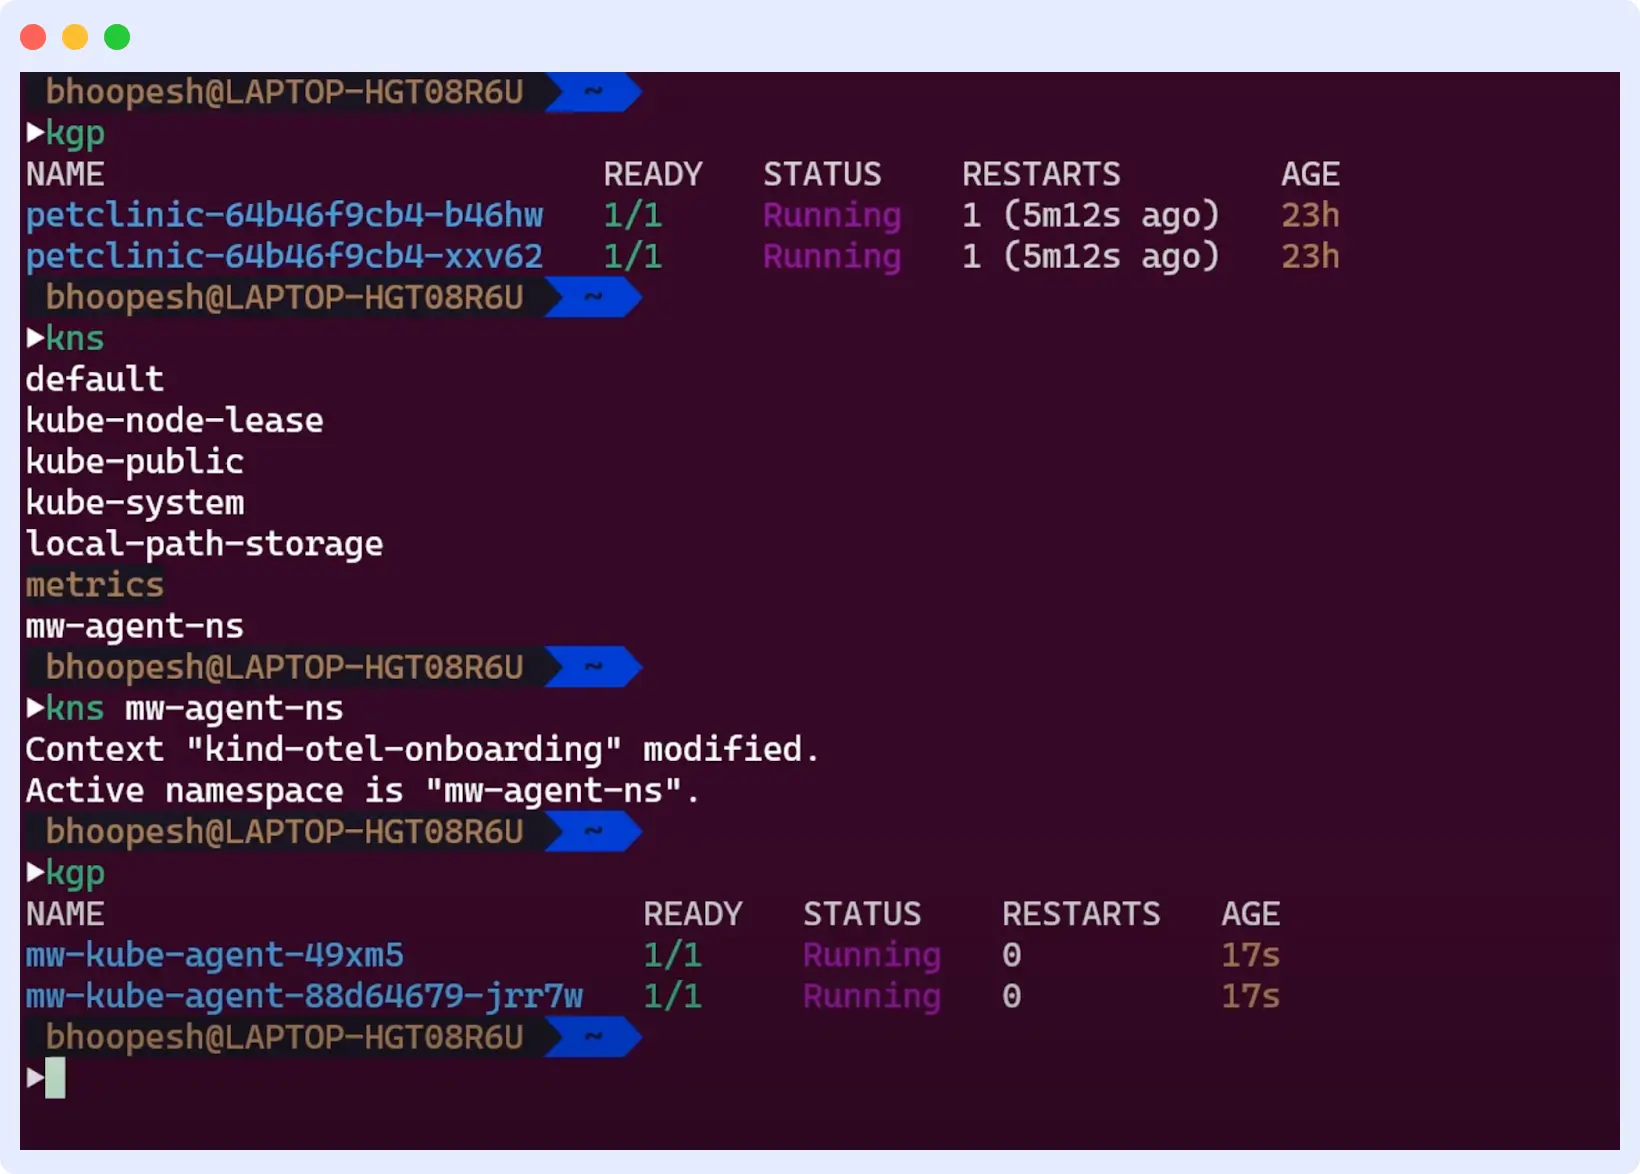
Step 4: Verifying successful connection and data ingestion
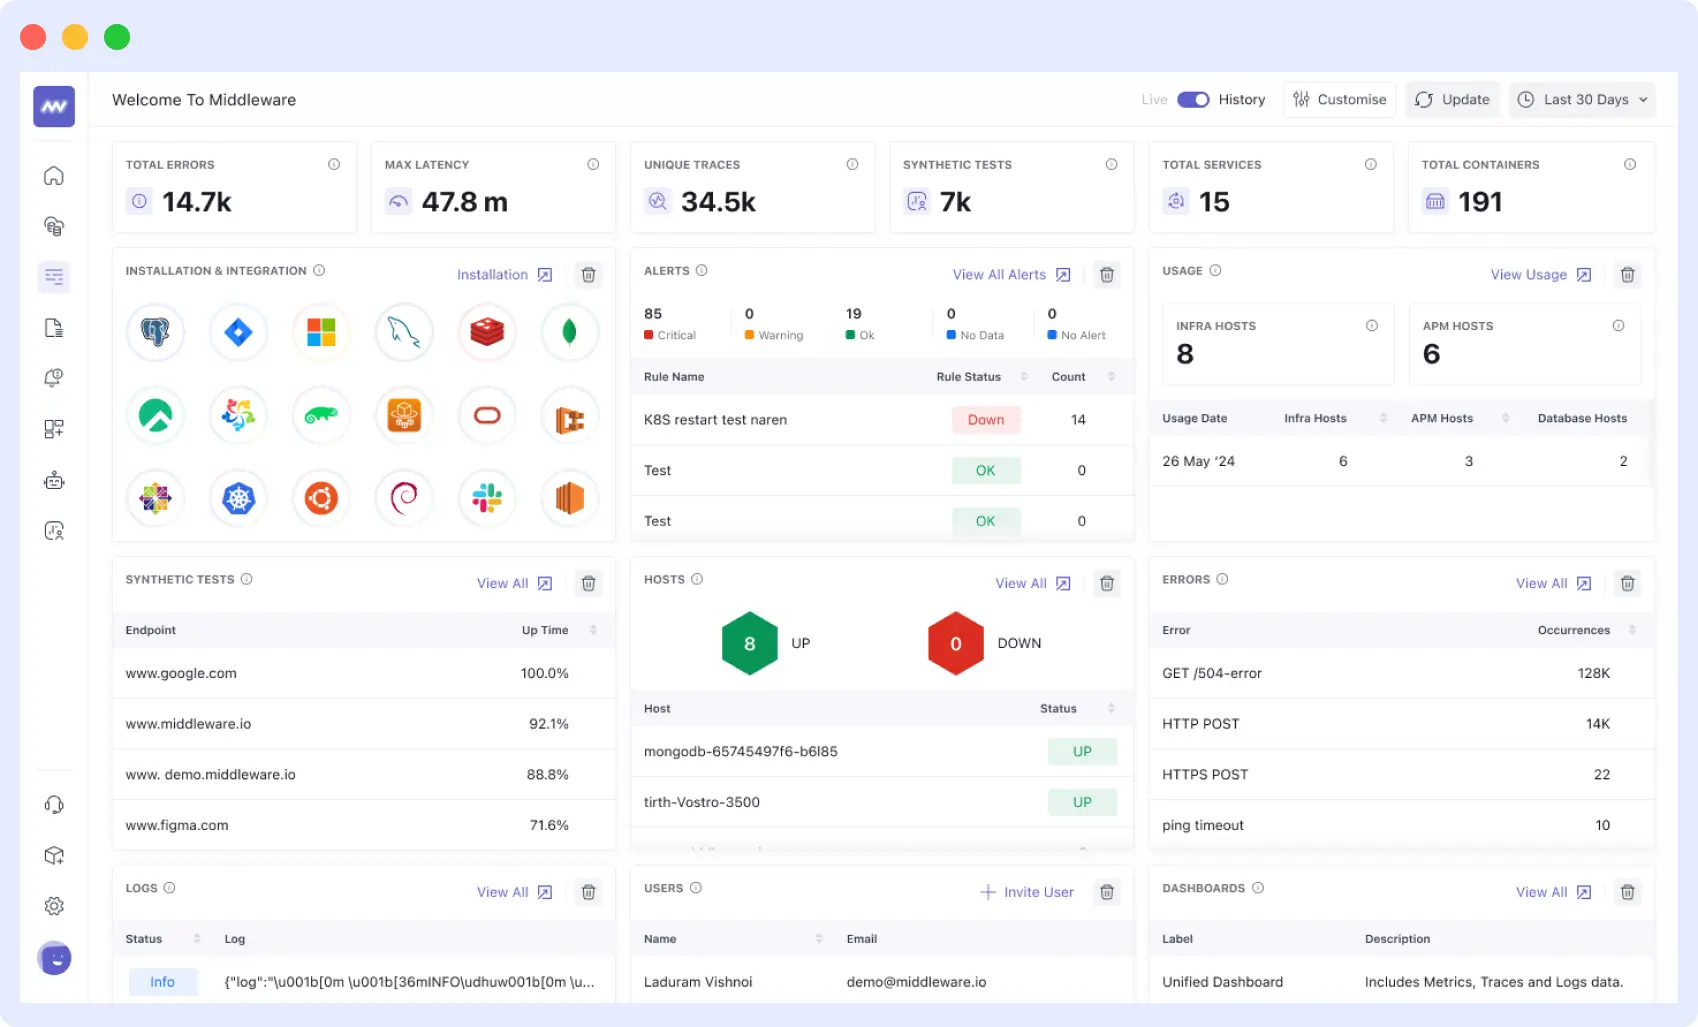
You should confirm everything works correctly in the final step. Within a few minutes of installation, you should see data streaming into your Middleware dashboard.
First, check the infrastructure view to confirm that all cluster nodes are visible and that your pods are actively sending metrics. Once real-time data appears on your dashboards, you know Middleware is successfully monitoring your Kubernetes cluster.
The best part about Middleware is its simplicity. Unlike other tools that require extensive configuration, custom dashboards, or manual monitoring setup, Middleware handles everything automatically, giving you complete Kubernetes monitoring with virtually no effort.
Observing Metrics for Monitoring of Your Kubernetes App
With Middleware running, you can start monitoring your Kubernetes cluster in real time. Its intuitive UI makes tracking metrics and cluster activity simple and efficient.
Monitoring CPU, memory, and storage metrics is crucial for avoiding bottlenecks. For a comprehensive overview of Kubernetes monitoring approaches, see our guide.
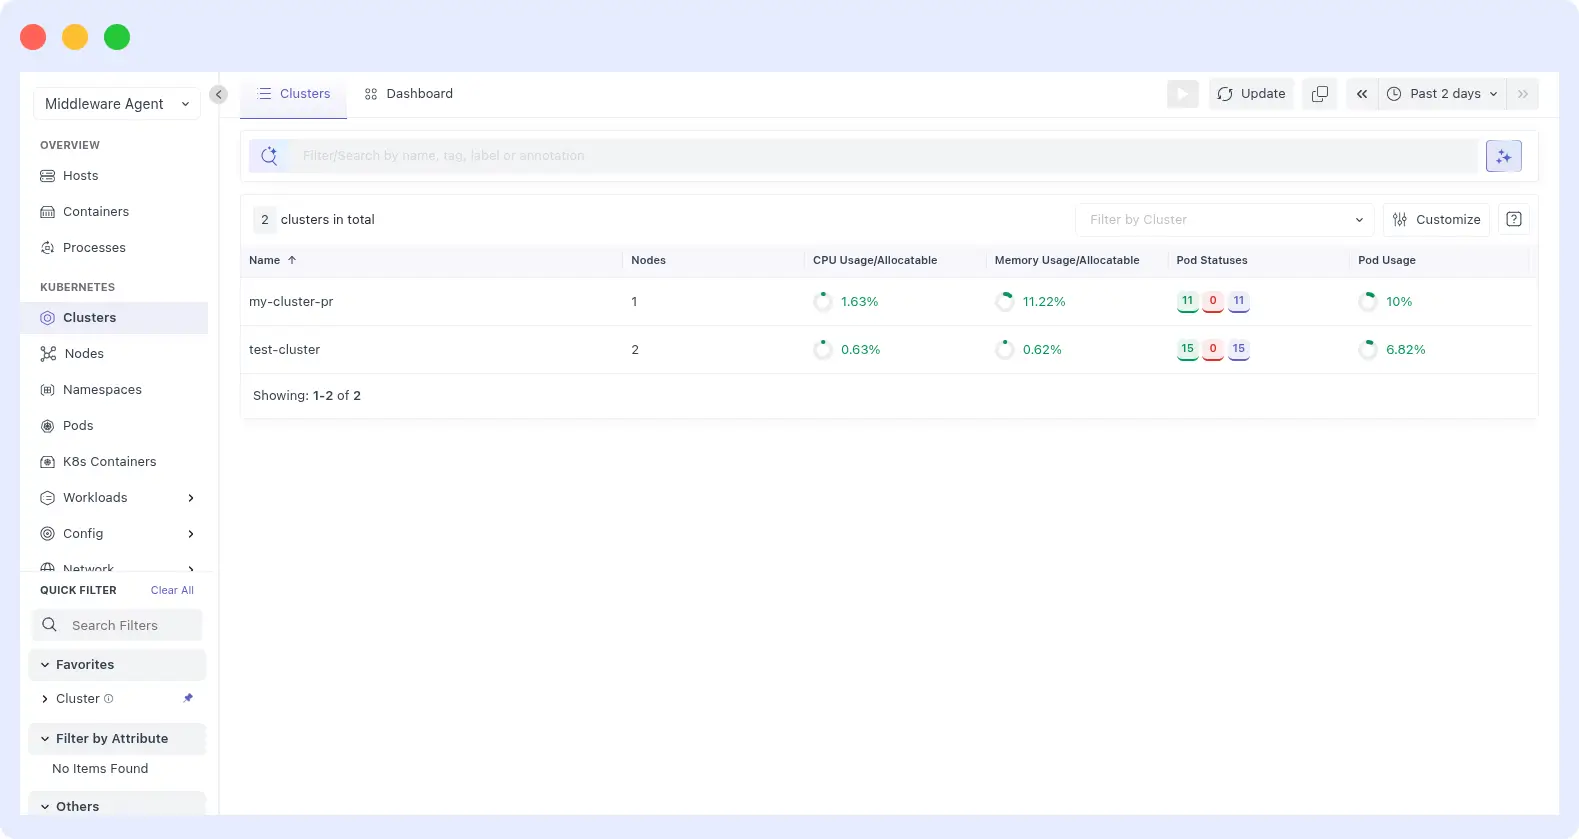
Cluster Overview: Live View for Monitoring Your Kubernetes App
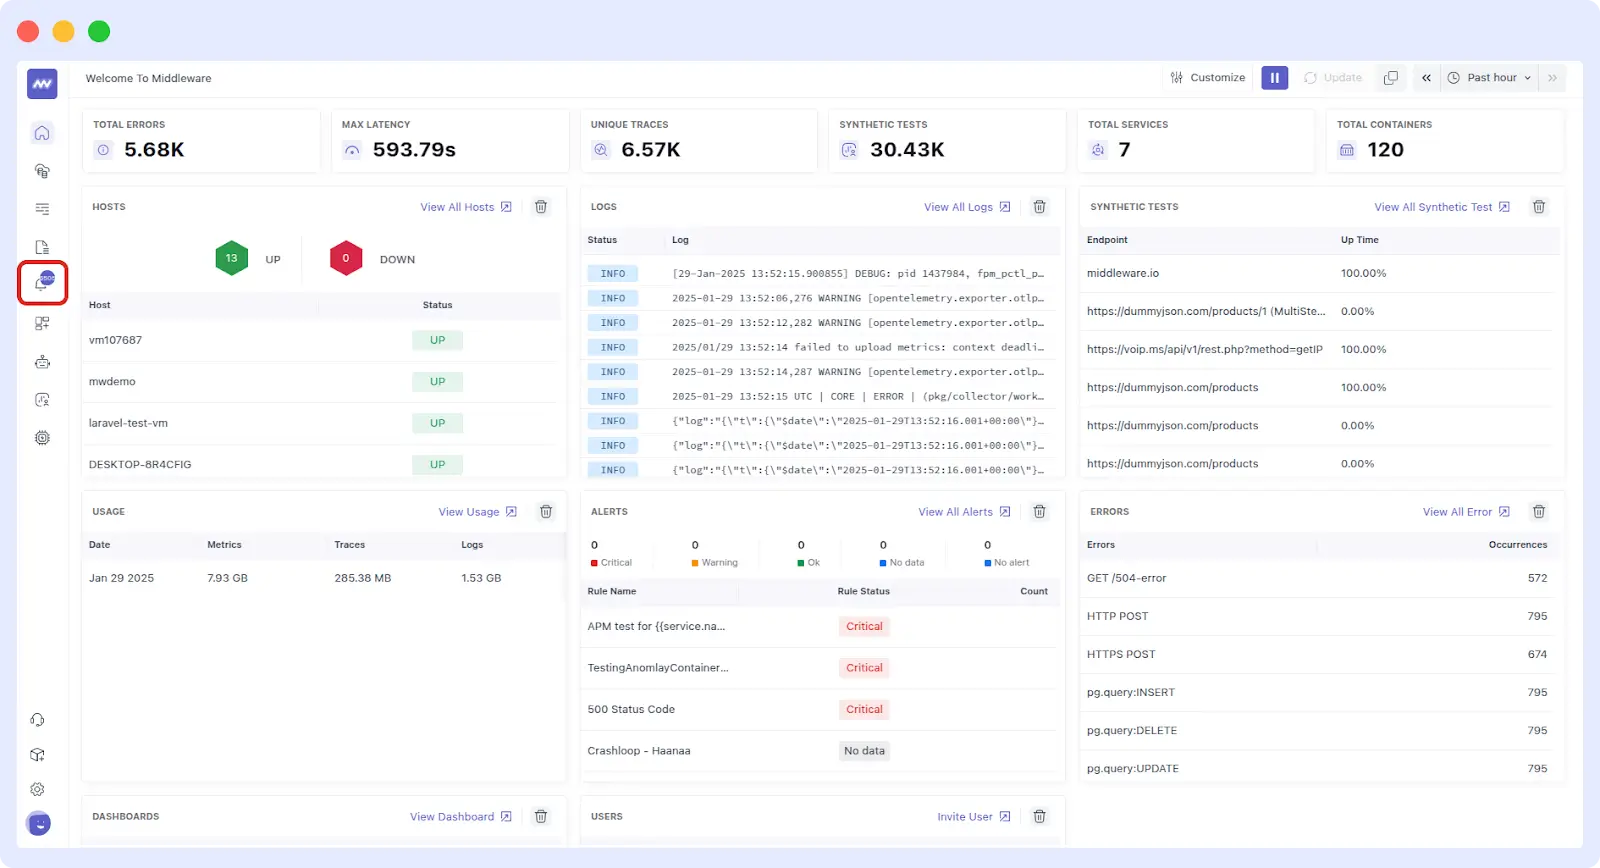
When you launch Middleware after your agent installation, you will see the Cluster Overview page. Think of this page as your command center. You can see all your nodes, your namespaces, and even your pods with their current status clearly. My favorite part is that you can quickly determine which areas of your cluster are running healthily and which require attention.
The live view changes in real time, so you’re never looking at stale info. You will see your workloads in their current state, not as they were five minutes ago. This real-time feedback is extremely useful while troubleshooting or simply ensuring that the new deployment went smoothly.
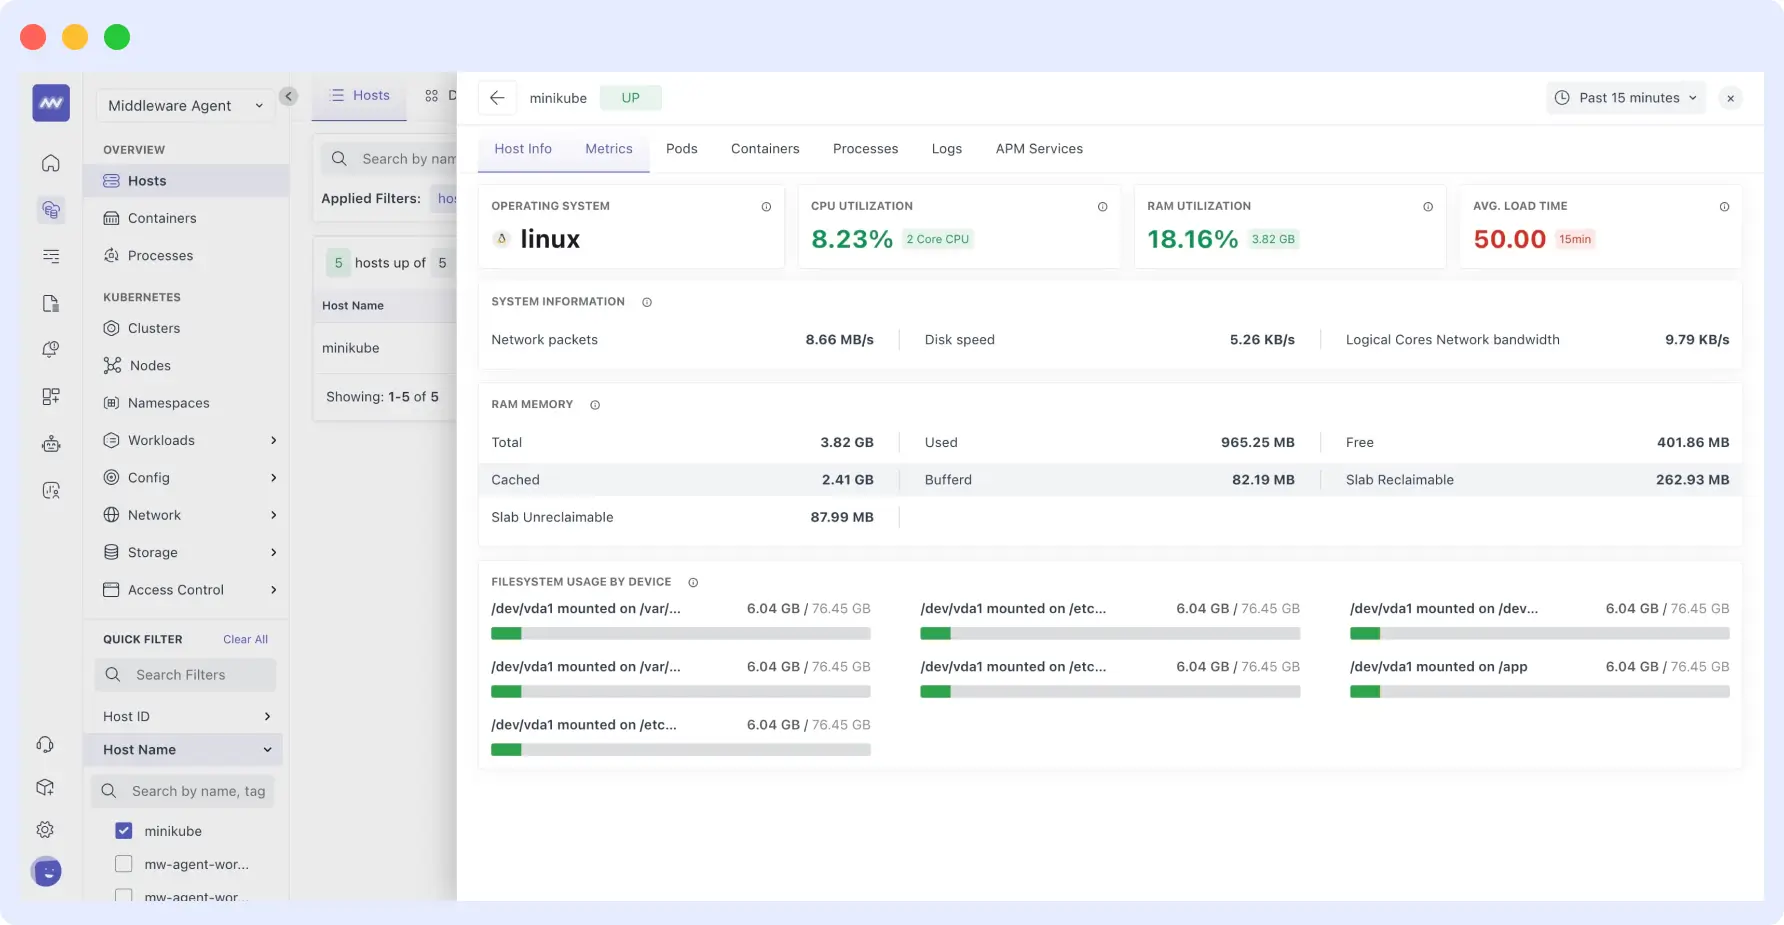
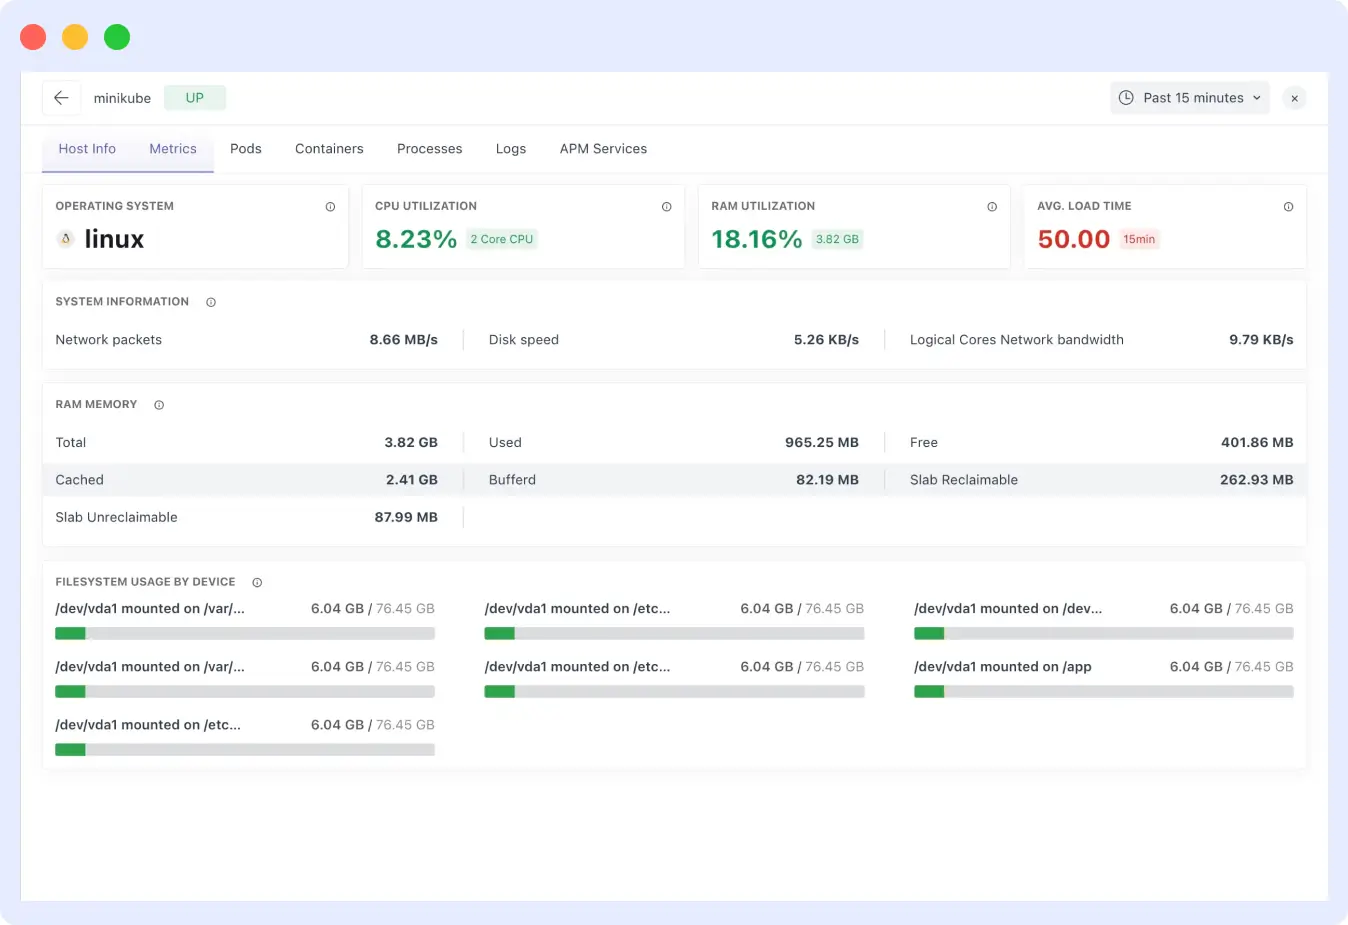
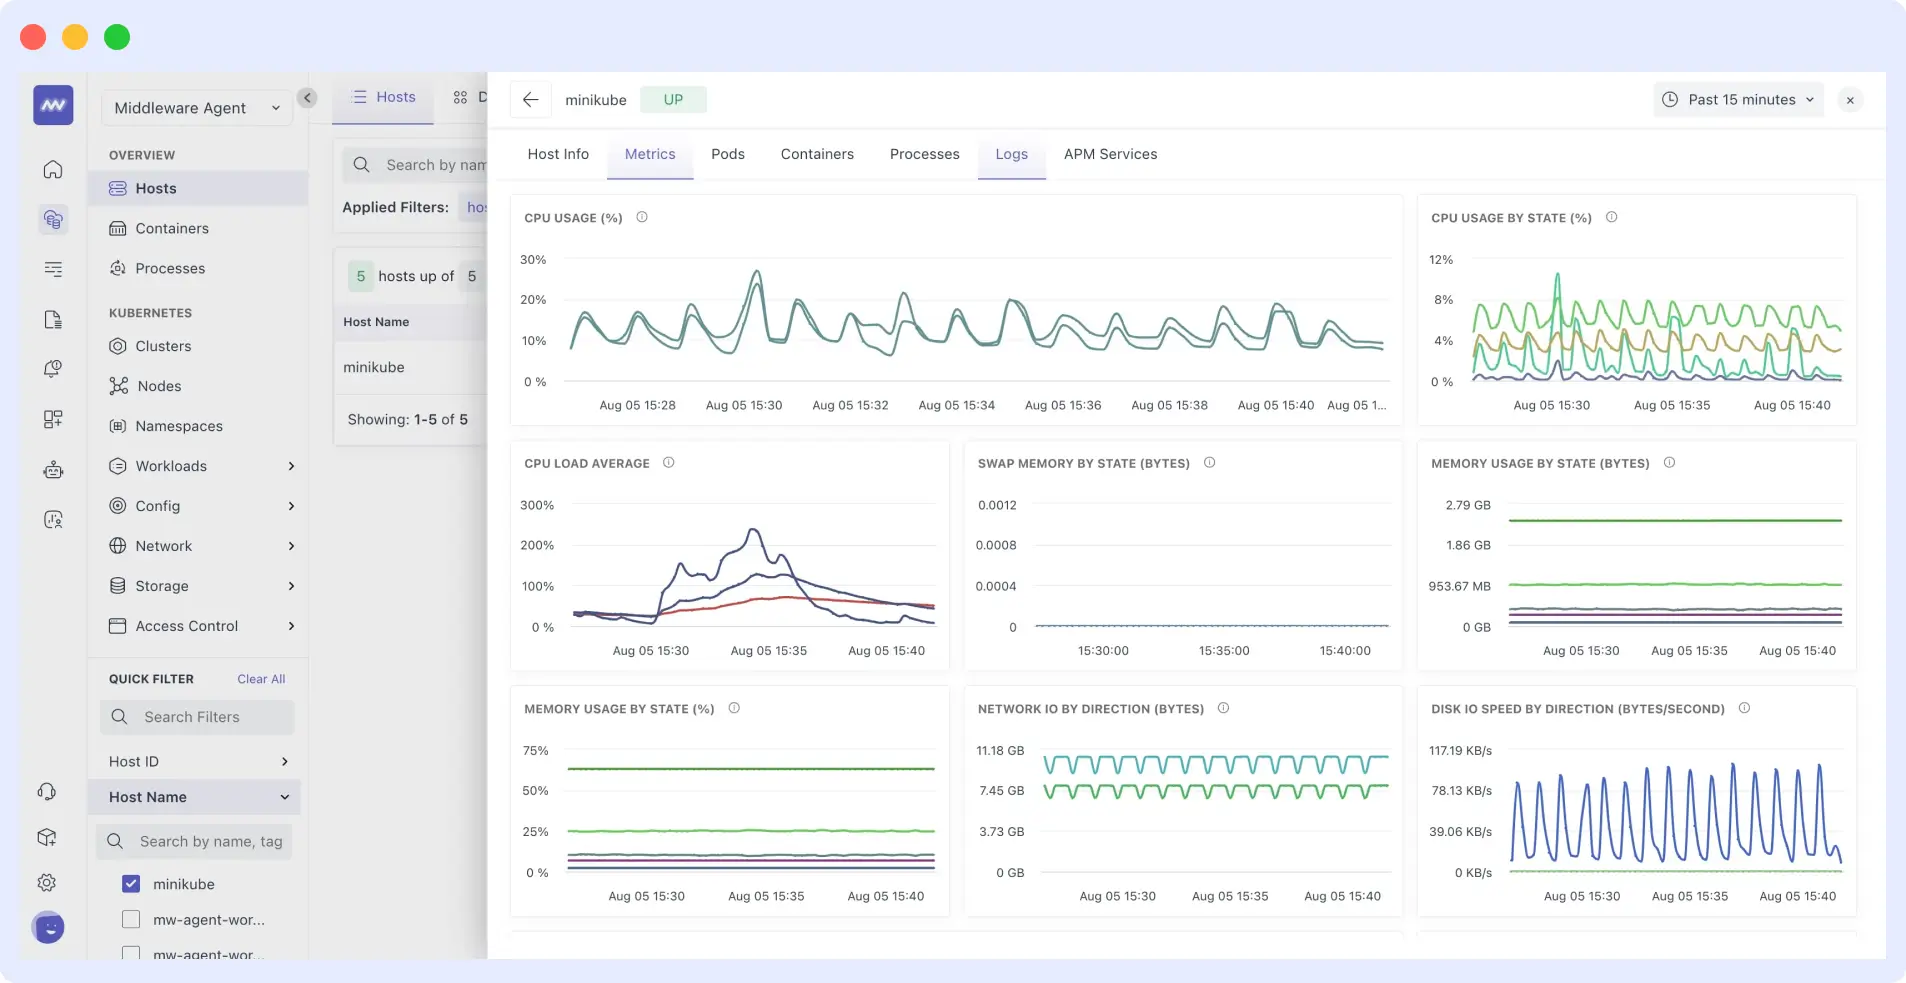
Resource Utilization: CPU, memory, and storage metrics at the pod and node levels
Middleware visualizes resource usage with easy-to-read charts, making monitoring your Kubernetes app effortless and accurate. You can drill down from cluster-level metrics to individual pods, monitoring CPU, memory, and storage efficiently.
When users report slow responses, you can quickly identify whether a node is maxed out on CPU or a specific pod consumes excessive memory. Storage metrics help prevent surprises like unexpected disk full alerts, keeping your cluster running smoothly.
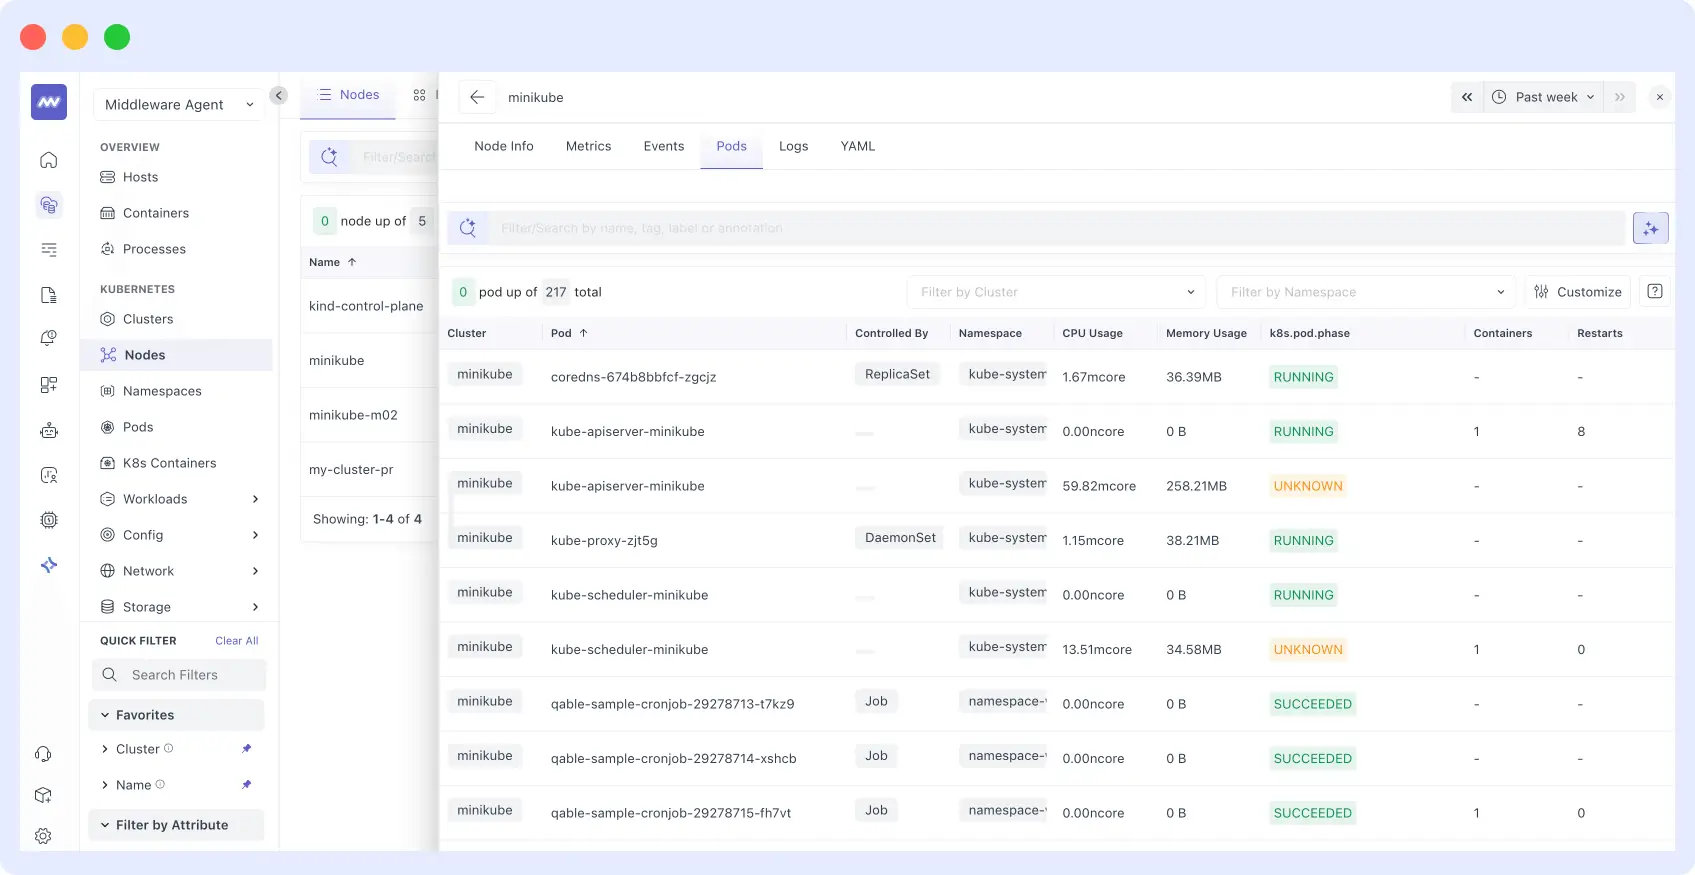
Pod Health and Restarts: Tracking Your Kubernetes App for Crashes and Restarts
Pods can be unpredictable, but Middleware’s Pod Health and Restarts monitoring removes the guesswork. You can instantly see which pods have restarted, how often, and whether a deployment has failed.
Middleware also tracks restart trends over time, helping you identify consistent issues before they impact your applications. Any underlying reasons for failures are highlighted, reducing the need to dig through logs manually.
Explore common pod issues and their resolutions in our Top 10 Kubernetes Troubleshooting Techniques blog.
Network Metrics: Traffic between services and latency insights
Middleware’s Network Metrics make it easy to visualize traffic between services, identify bottlenecks, and detect unusual patterns in service-to-service communication.
For insights into managing network-related issues, check out our Exit Code 137 in Kubernetes: Causes, Diagnosis, and Fixes
Latency insights help you quickly determine if performance issues are caused by the network or specific service calls, allowing faster troubleshooting and improved application performance.
Automatic Anomaly Detection: Your Silent Guardian
Middleware goes beyond charts by actively analyzing metrics, ensuring continuous monitoring of your Kubernetes application, and automatically detecting anomalies. It identifies unusual behavior, such as a pod consuming 90% CPU at midnight, and alerts you before it impacts your applications.
The system learns what’s normal in your cluster and flags abnormal log patterns, whether it’s unexpected pod restarts or unusual memory usage, so you can address issues proactively and maintain stable Kubernetes operations.
Centralized Logs and Alerts for Kubernetes App Monitoring
When something goes wrong in your cluster, you need answers fast. Middleware automatically pulls logs from all your containers, pods, and cluster events into a single unified view, with no extra configuration required and no separate log agents to manage. Everything flows into a single, searchable interface.
Learn more about Kubernetes logging best practices to optimize log collection and troubleshooting.
Searching and Filtering Logs
Middleware’s log viewer makes finding issues simple. Filter logs instantly by service, namespace, or time window, or search using error codes, service names, or partial messages. The interface updates in real time, so you don’t waste time while troubleshooting critical problems.
One-Click Filtering and Severity Switching
Click any value pod name, error type, or request ID to filter similar entries automatically. Severity switching allows you to toggle between log levels error, warning, and info logs, with color-coded highlighting for fast visual analysis. These one-click filters save valuable time, helping you debug production issues efficiently.
Alerts & Notifications
With Middleware, you can stay ahead of issues before they impact your users. Setting up alerts for your Kubernetes cluster is simple; no complex YAML or rule syntax is needed.
Configuring Alerts for Kubernetes Events
Use the alert configuration UI to monitor what matters most. Set alerts for pod failures, high CPU usage or memory usage, and unexpected restart rates. Drag-and-drop sliders and namespace selection make configuration fast and easy. Restart thresholds help catch subtle issues like memory leaks or misconfigurations before they escalate.
For advanced debugging techniques, refer to our Troubleshoot Smarter Using Advanced Debug Logging Techniques
Alert Dashboard and Incident Timeline
The dashboard displays warnings on a timeline, showing when issues occurred and their context. You can quickly see affected pods, relevant metrics, and associated log entries to troubleshoot efficiently.
Integration with Slack and PagerDuty
Middleware integrates with Slack and PagerDuty, sending notifications directly to your team for quick response. Alerts provide enough context to understand the severity and scope of an issue, keeping your team informed and proactive.
Try Middleware for your Kubernetes clusters today
You now have everything you need to monitor your Kubernetes clusters professionally. Middleware makes everything surprisingly simple, from real-time data and consolidated logs to helpful smart alarms.
Why not see it in action? Start monitoring your Kubernetes app with Middleware today and experience monitoring that works. Your future self (and your team) will thank you for making the switch.
Your clusters are waiting for the monitoring they deserve.


