New Relic is the industry standard in Application Performance Monitoring (APM), but it has several drawbacks, prompting many to consider alternatives. Key issues with New Relic include complex pricing, a steep learning curve, a complex UI, missing features, and its resource-hungry nature.
Of course, there is a lot to love about New Relic, but the issues that we discussed earlier can be a deal breaker for mid to small companies, where they often operate in a resource-intensive manner. We’ve compiled a list of alternatives to New Relic that address its existing issues.
Why Look for an Alternative to New Relic?
While New Relic is a great tool, it has drawbacks that may be a deal breaker for some users.
Looking for new relic alternatives
byu/hugthemachines indevops
- Complex pricing: New Relic’s pricing model is based on data ingestion and user seats, which can lead to unexpectedly high costs as data volumes grow.
- Resource-hungry nature: New Relic’s infrastructure agent consumes significant CPU and memory, especially in large environments, increasing infrastructure and optimization costs.
NewRelic unethical billing
byu/jaxn indevops
- Limitations on active sessions and IP addresses: New Relic restricts users to a maximum of three concurrent active sessions or unique IP addresses. This limits workflows for users needing access from multiple devices or locations.
- Steep learning curve: The extensive feature set of New Relic can result in a complex user interface, leading to a significant learning curve. Users may find it challenging to navigate and use the platform efficiently.
Several alternatives to New Relic offer similar or better functionality.
Top New Relic Alternatives
New Relic has evolved over the years and has become somewhat complex to navigate, and the New Relic pricing has also become a confusing part. To solve this issue, we present several alternatives to New Relic, which are simple, cost-effective, and easy to use.
1. Middleware
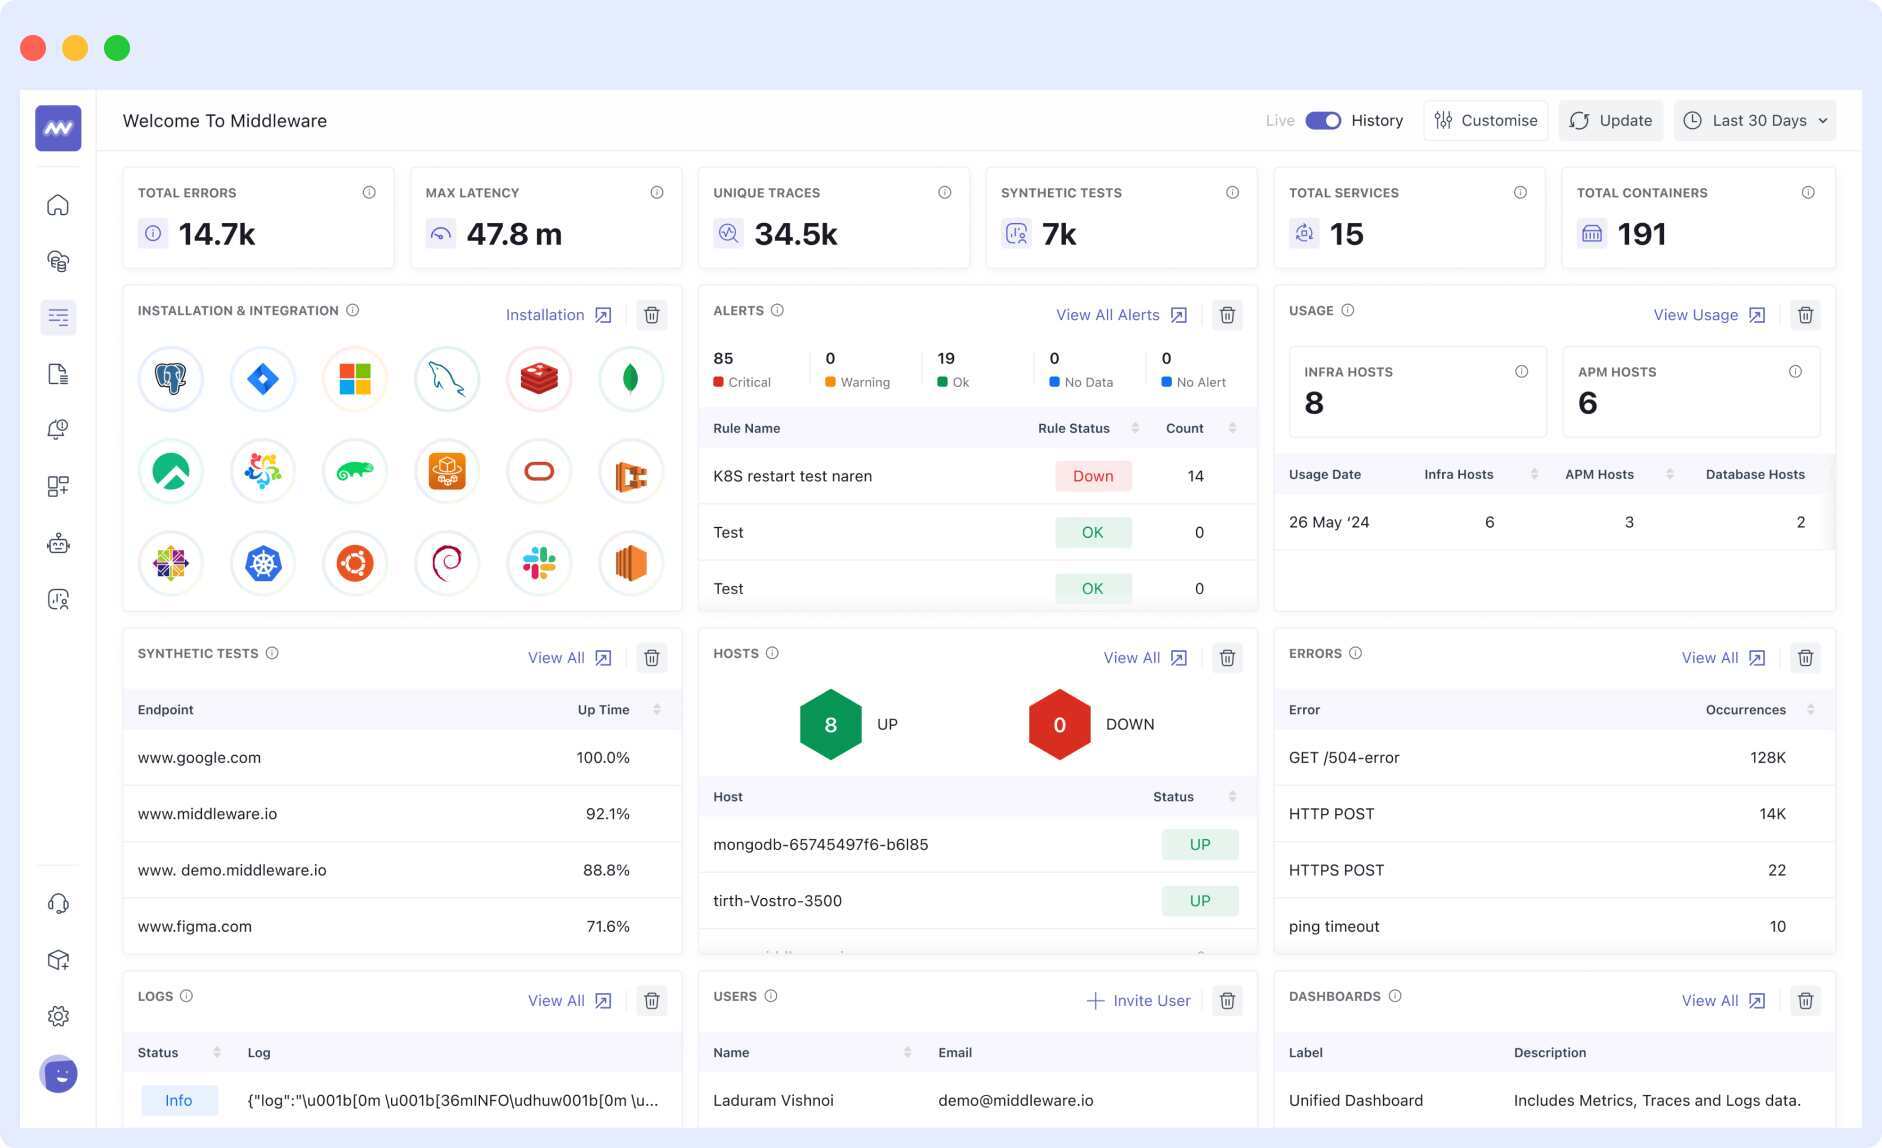
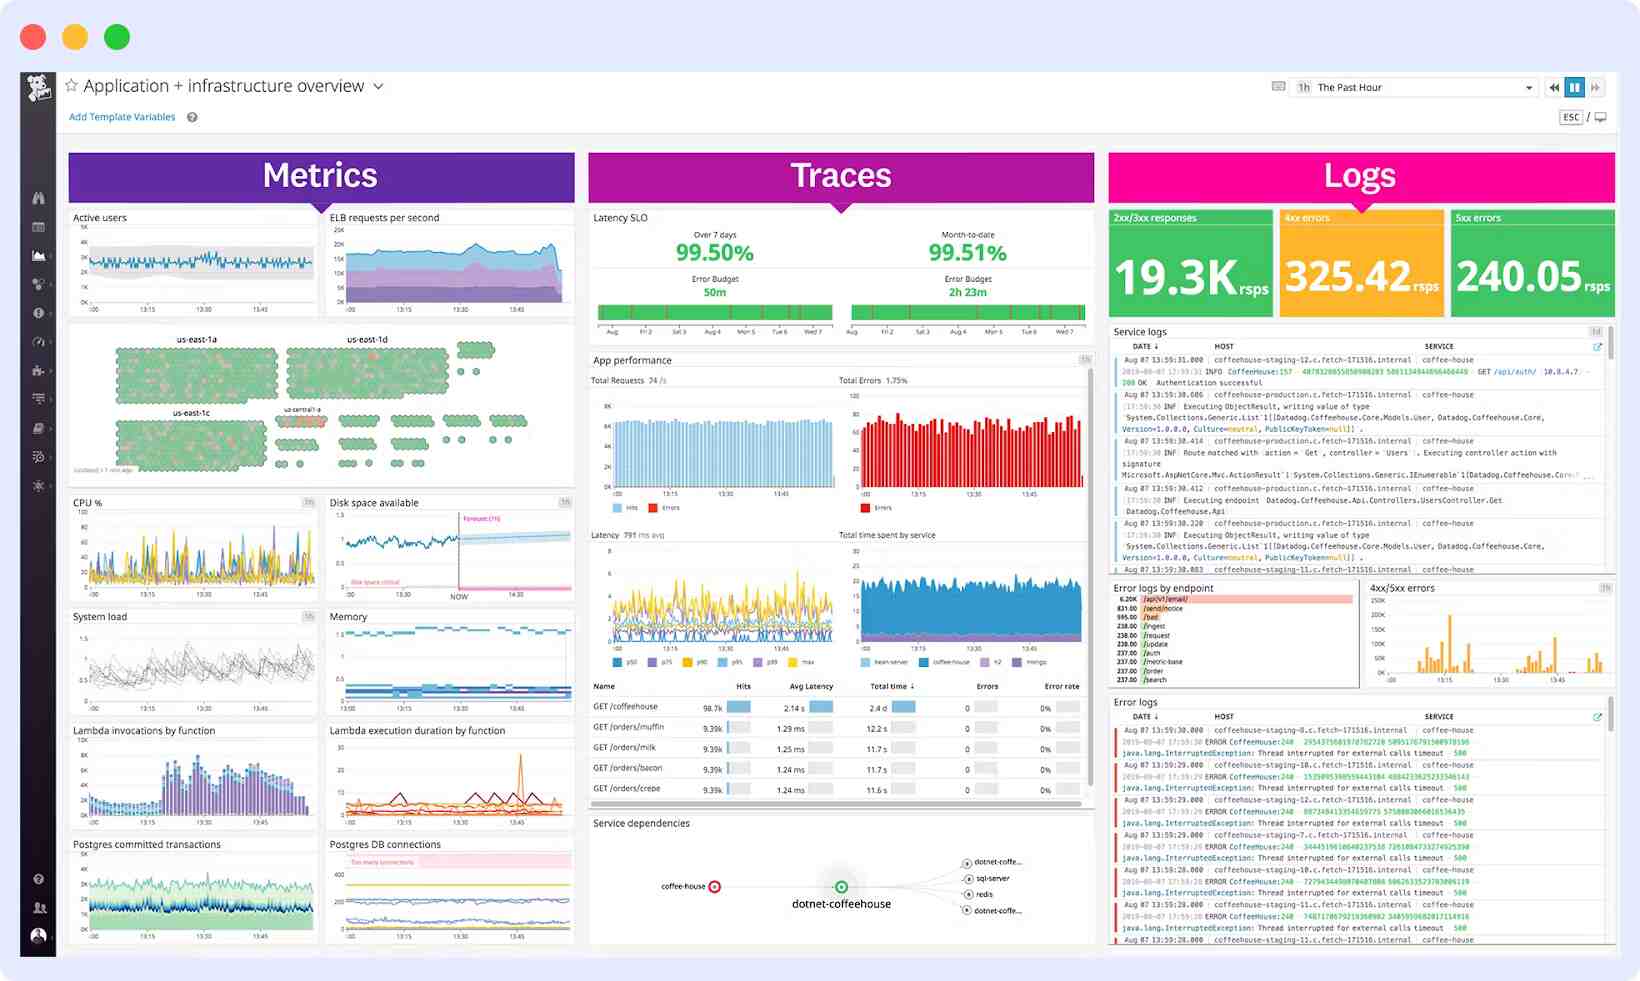
Middleware provides a full-stack observability platform for businesses. It provides real-time data on applications and infrastructure. As a powerful alternative to New Relic, Middleware consolidates metrics, logs, traces, and events. All data is presented in a single timeline for easy monitoring and troubleshooting. This platform supports both cloud-hosted and on-premise environments, making it versatile for different infrastructures.
Middleware has a scalable architecture, making it ideal for growing organizations. It offers a wide range of integrations. These features help businesses improve operational efficiency. At the same time, Middleware reduces observability costs, providing a cost-effective solution.
Key Features:
- Unified Observability: Combines metrics, logs, traces, and events into a single, real-time timeline for full visibility.
- Extensive Integration: Supports more than 200 technology integrations, including AWS, Azure, GCP, Kubernetes, and serverless environments to provide monitoring across your infrastructure.
- AI-Powered Insight: Uses AI-driven search and predictive analytics to surface anomalies in real time, accelerating issue resolution and preventing downtime.
- Ingestion Control: Allows for customizable ingestion pipelines to monitor the data most important to your organization and manage costs.
- Flexible Deployment Options: Both cloud and on-premise deployment options are available to meet your organizational security and compliance needs.
Pricing:
- Free Forever: $0
- Includes 100GB of data, 1000 RUM sessions, 20,000 synthetic checks, unlimited users, and 14 days of data retention.
- Pay As You Go: $0.30/GB for metrics, logs, and traces.
- This includes ingestion control for the first time, extended retention to 30 days, Slack support, and Security Features.
- RUM sessions and synthetic checks are charged separately.
- Enterprise: Custom Pricing
- This plan includes volume discounts, premium support, single sign-on (SSO), advanced security features, on-premise deployment, and a dedicated account manager.
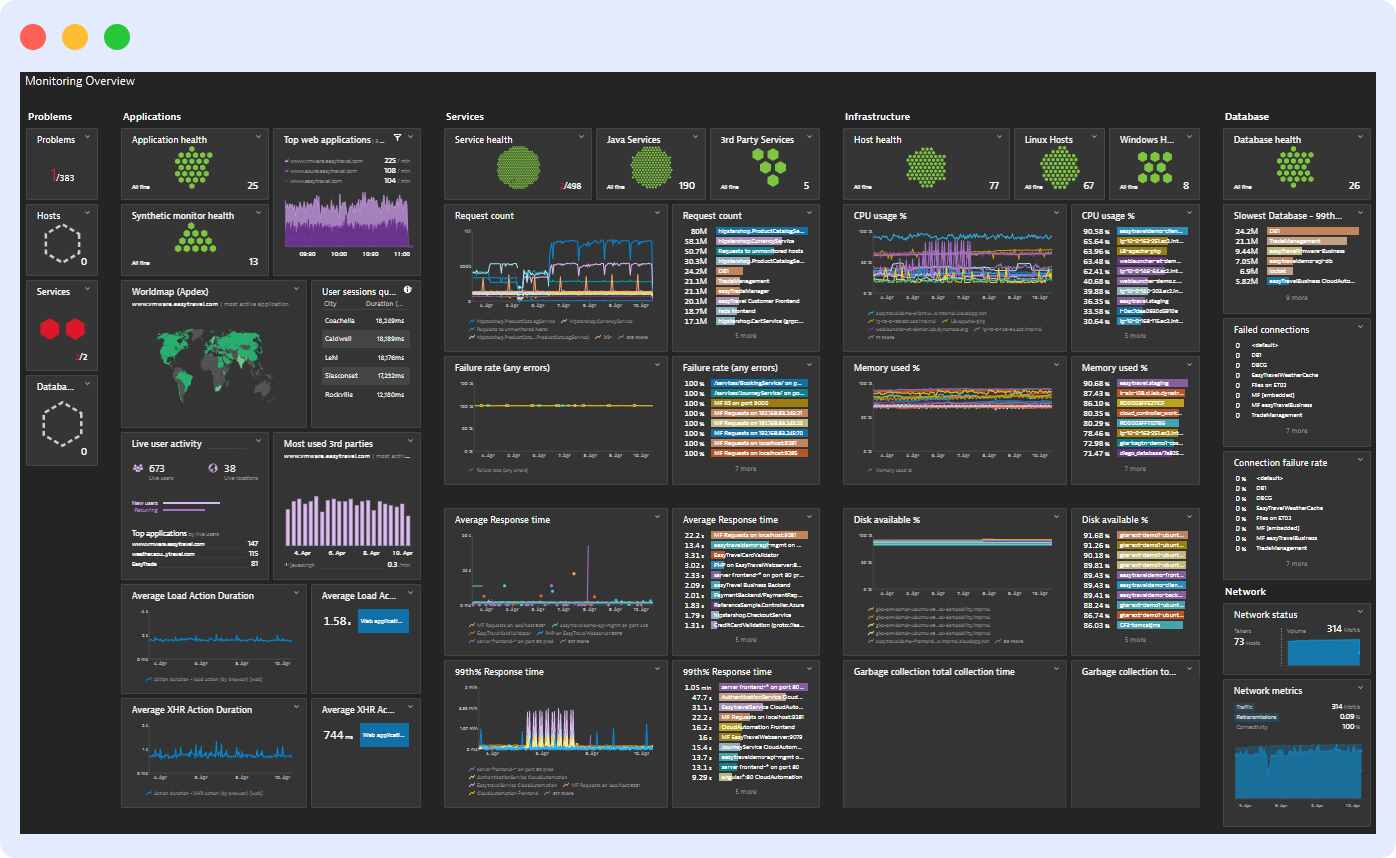
2. Datadog
Datadog is a monitoring and security platform offering end-to-end observability for applications, infrastructure, and logs. A top New Relic competitor, it integrates metrics, traces, and logs into a single view to allow real-time monitoring of various environments, including cloud and on-premise.
Key Features:
- Unified Observability: Datadog brings metrics, traces, and logs into one solution, providing a complete view of system performance while allowing for effective time to detect and resolve issues.
- Large Number of Integrations: Datadog has over 850 integrations, allowing you to connect to various technologies/services easily.
- Real-Time Monitoring: Datadog provides real-time analytics as well as customizable dashboards allowing teams to respond to performance metrics efficiently.
- Security Monitoring: The application has security monitoring features that detect and respond to security threats while maintaining compliance and providing insights to identify vulnerabilities.
Pricing:
- Free trial: Datadog has a 14-day free trial providing full access to all features while being able to monitor and analyze metrics, traces, and logs at no cost out of pocket for the first 14 days.
- Pro Plan:
- Annual Billing: $15 per host per month.
- Monthly Billing: $18 per host per month.
- Enterprise Plan:
- Annual Billing: $23 per host per month.
- Monthly Billing: $27 per host per month.
Application Performance Monitoring (APM):
- Pro Plan:
- Annual Billing: $31 per host per month.
- Monthly Billing: $36 per host per month.
Log Management:
- $0.10 per GB of logs ingested per month.
There are other services available for additional costs available such as Real User Monitoring (RUM), Synthetic Monitoring, and Security Monitoring, with pricing. See Datadog’s pricing for detailed pricing.
3. Dynatrace
Dynatrace offers a unified platform for observability and security. It covers applications, infrastructure, and user experience. As a top New Relic alternative, Dynatrace provides deep organizational monitoring. It integrates automation and AI features across both cloud-native and traditional environments.
Key Features:
- Full-Stack Monitoring: Provides observability end-to-end across your applications and infrastructure, including containers, cloud platforms, and servers.
- AI-Powered Insights: Use Davis’ AI engine for root-cause analysis and anomaly detection to reduce mean time to resolution across your application life cycle.
- Automatic Discovery and Instrumentation: Your application and infrastructure are discovered and instrumented automatically with no manual input, keeping you at speeds for scalability, whether you are in a static or dynamic setting.
- Real User and Synthetic Monitoring: Provide your users with real-user monitoring (RUM) and synthetic monitoring to assess user behavior and simulate a user interaction for a best-in-class digital experience.
- Application Security: Continuously assess your application for vulnerabilities and provide security threat protection in real-time.
Pricing:
- Full-Stack Monitoring: $0.08 per hour for an 8 GiB host, observability across your applications, microservices, and infrastructure.
- Infrastructure Monitoring: $0.04 per hour for a host of any size, allowing for an infrastructure focus around cloud platforms, containers, networks, and data center technology.
- Kubernetes Platform Monitoring: $0.002 per hour for a pod of any size, providing observability across workloads, pods, containers, and nodes.
- Application Security: $0.018 per hour for an 8 GiB host, providing continuous vulnerability assessment and security threat protection.
- Real User Monitoring (RUM): $0.00225 per session, and monitors real user interactions in your web and mobile applications.
- Synthetic Monitoring: $0.001 per synthetic request. You can simulate user interactions with your applications to identify user experience problems.
4. AppDynamics
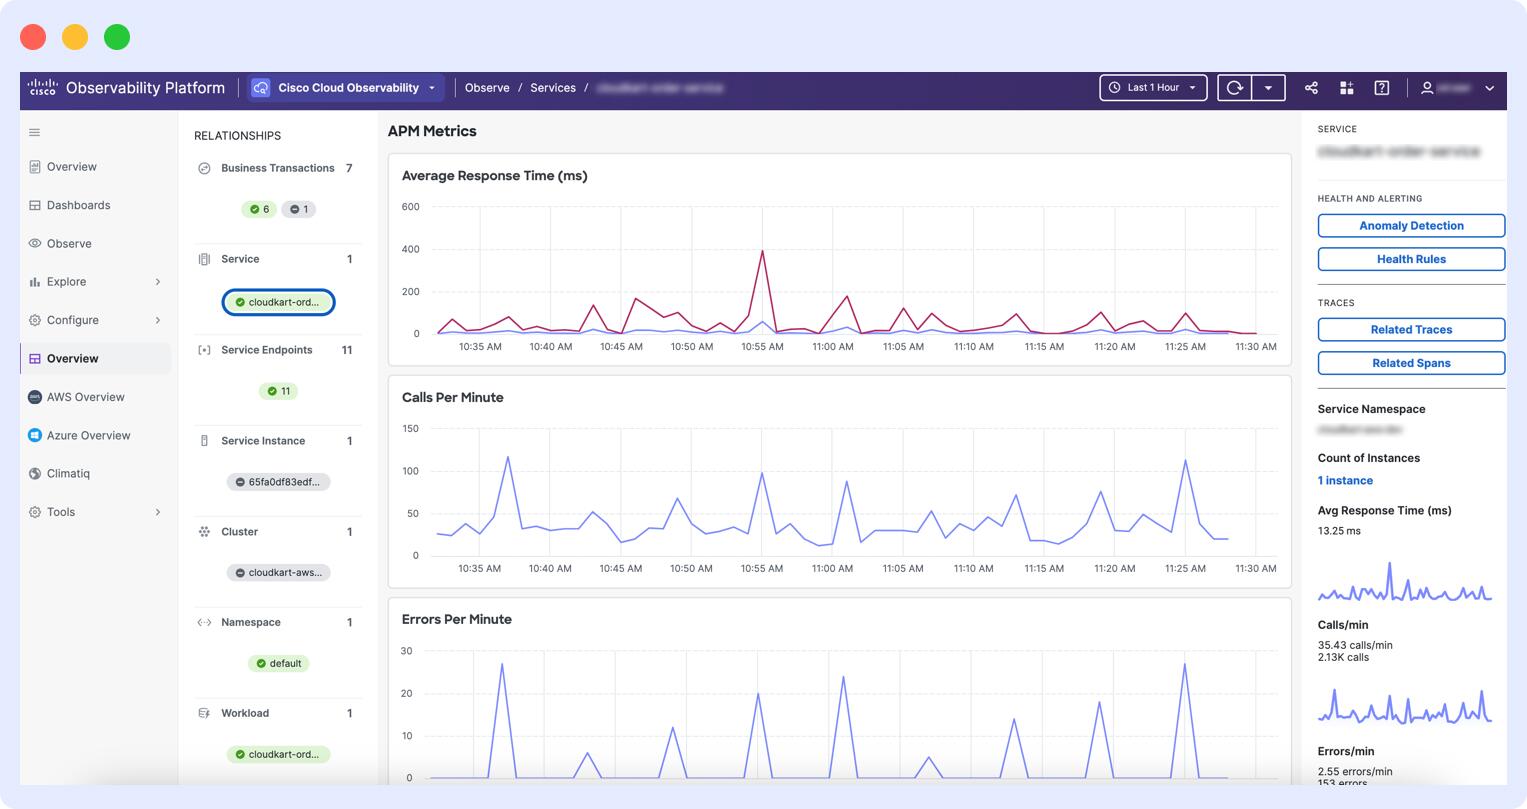
AppDynamics, a part of Splunk, offers application performance monitoring (APM) that provides deep insights into application performance, user experience, and business results. A strong competitor to New Relic, AppDynamics helps organizations identify and resolve performance issues by monitoring complex, distributed applications in real time.
Key Features:
- Application Performance Monitoring (APM): Provides end-to-end visibility into application performance with automatic dependency discovery and mapping.
- Infrastructure Monitoring: Displays any real-time insight into the health and performance of infrastructure components (servers, databases, etc.).
- Real User Monitoring (RUM): Allows measuring and monitoring the real user experience for browser and mobile apps, allowing organizations to identify and fix issues affecting the experience.
- Synthetic Monitoring: Helps organizations simulate user interactions to proactively find and resolve issues before they affect end users.
- Business Performance Monitoring: Provides insight into how application performance metrics impact business results by associating application performance metrics with business outcomes.
Pricing:
- Infrastructure Edition: Starting at $6 per CPU core per month, billed annually, and includes Infrastructure Monitoring.
- Premium Edition: Starting at $33 per CPU core per month, billed annually, includes infrastructure monitoring, application performance monitoring, database monitoring, log observability, and transaction analytics.
- Enterprise Edition: Starting at $50 per CPU core per month, billed annually and includes all premium edition features, plus business performance monitoring. It also offers additional services such as Real User Monitoring (RUM), synthetic monitoring, and application security for an additional fee.
5. Elastic APM
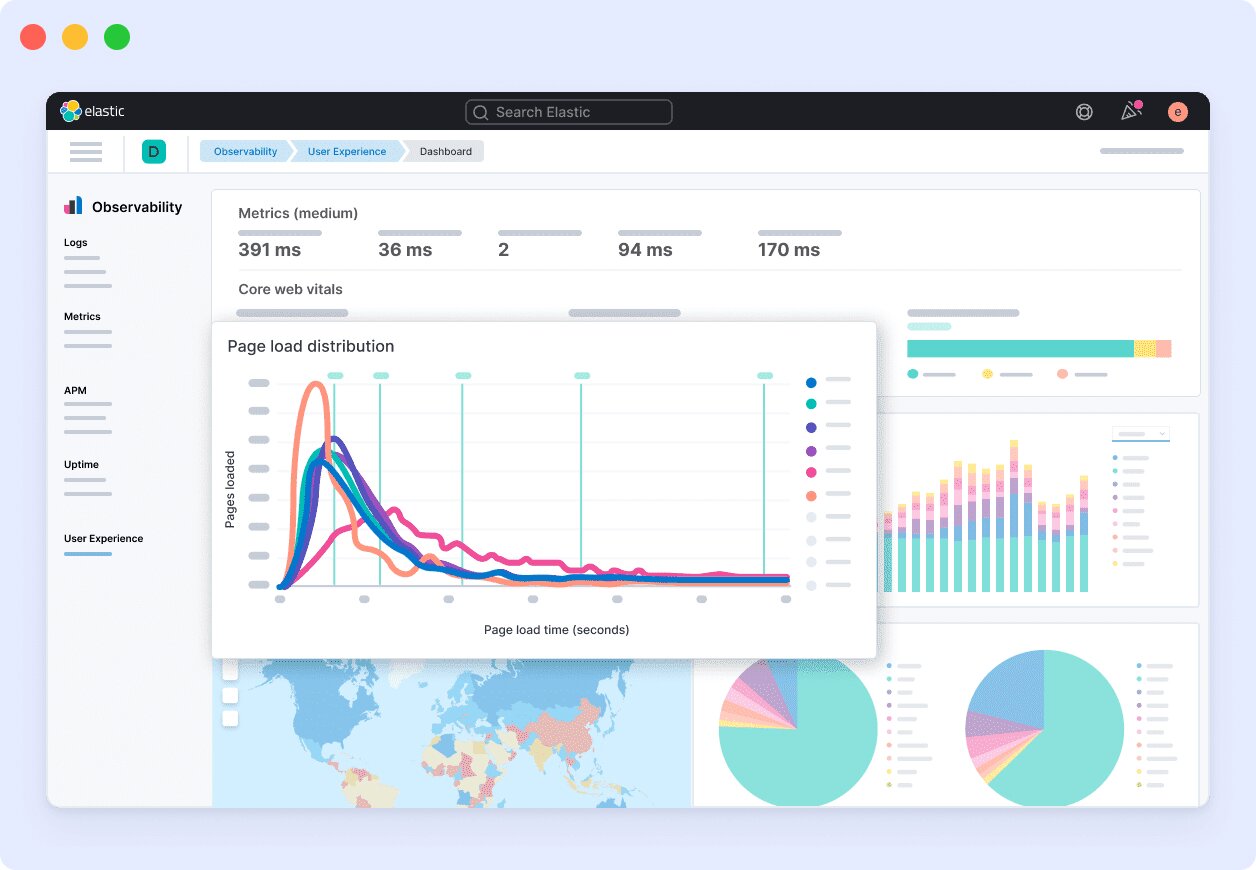
Elastic APM, part of Elastic Observability, offers real-time insight into software services and applications. As a New Relic competitor, it collects detailed performance data. This helps organizations detect and resolve performance issues, ensuring optimal application performance.
Key Features:
- Distributed Tracing: Elastic APM captures and visualizes distributed transactions across microservices and serverless architecture for end-to-end visibility into application performance.
- Multiple Language Support: Elastic APM offers APM agents for a wide range of programming languages, including Java, .NET, Python, Ruby, and JavaScript, allowing for seamless integration into numerous environments.
- Real User Monitoring (RUM): Elastic APM provides RUM functionality, which gives teams the ability to track real user experience in their web applications while optimizing user experience.
- OpenTelemetry Integration: Elastic’s APM supports OpenTelemetry for organizations to implement open standards, instrumentation, and interoperability with other observability tools.
- Anomaly Detection: APM allows for machine learning to detect anomalies in application performance so teams can proactively address issues.
Pricing:
Elastic APM can be used in two different ways, one of which is free because of its open source nature:
- Self-Managed (On-Premises): The APM is free and open to use under the Basic license and includes the core APM functionalities at no additional cost.
- Elastic Cloud (Hosted Solution): For hosted deployments on Elastic Cloud, the APM pricing is resource-based according to region and cloud provider. For example, in AWS us-east-1, the standard pricing tier begins at approximately $0.0431/hour.
6. Honeycomb
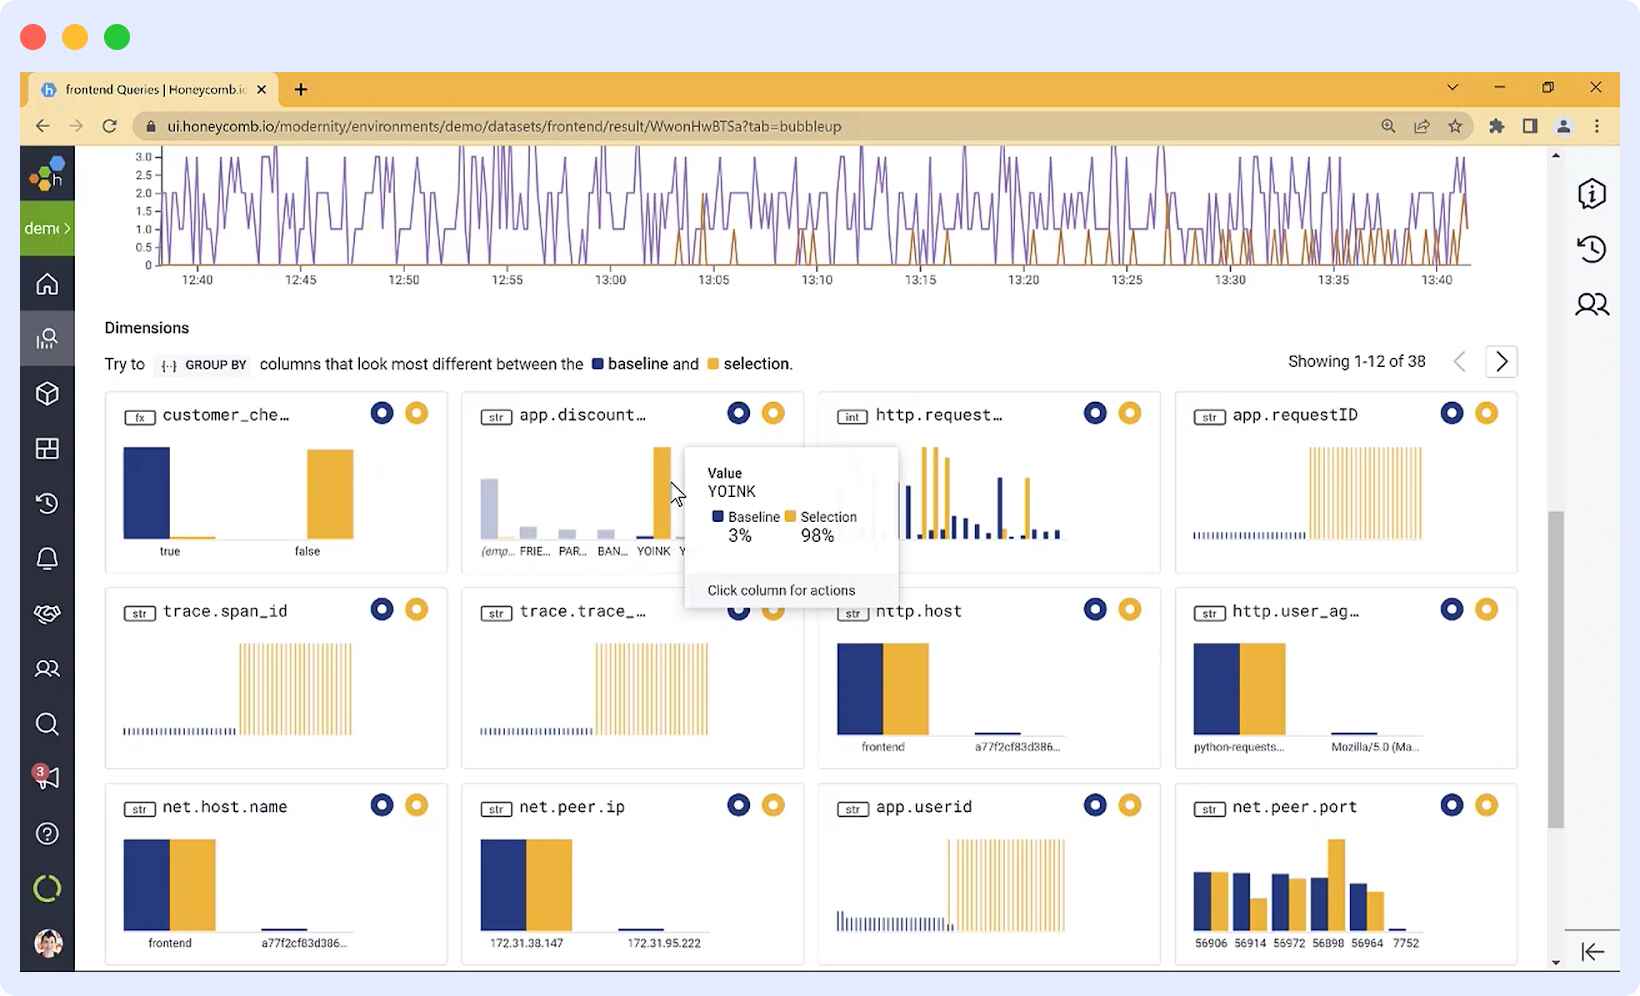
Honeycomb is an observability platform for engineering teams to debug and improve complex distributed systems. As a New Relic competitor, it collects logs, metrics, and traces into one view. This enables real-time analysis and troubleshooting to enhance system reliability and performance.
Key Features:
- Unified Observability: Logs, metrics, and traces are combined into one platform, providing a comprehensive understanding of system performance.
- Distributed Tracing: Get end-to-end visibility into requests as they move through different services and help identify performance bottlenecks.
- BubbleUp Anomaly Detection: Automatically detect outliers and anomalies within datasets, for fast detection of issues.
- Service Level Objectives (SLOs): Teams can set and monitor SLOs to meet performance targets for user expectations.
- OpenTelemetry Support: Honeycomb works with OpenTelemetry for standardized instrumentation and data collection across services.
Pricing:
- Free Plan: $0/month, supports 20 million events in a month.
- Pro Plan: $130/month or $1,300 annually
- Includes all free features plus expanded event volumes (100M, 450M, or 1.5B per month), 100 Triggers, 2 Service Level Objectives (SLOs), Single Sign-On (SSO), and enhanced support.
- Enterprise Plan: Custom pricing tailored to business requirements.
- Offering all Pro Plan features with scalable event volumes, starting with 300 Triggers and 100 SLOs, Service Map, Enterprise support for Refinery, and a dedicated Customer Success team.
7. Prometheus and Grafana
Prometheus and Grafana form an open-source stack for monitoring and visualization, commonly used for system performance. As a popular New Relic alternative, Prometheus handles monitoring and time-series data collection. Grafana offers powerful visualization and analysis capabilities.
Key Features:
- Prometheus:
- Time-Series Data: Prometheus scrapes specified targets for metrics at specified times and stores them as time series that can be queried for analysis with the appended labels.
- PromQL for Querying: Prometheus offers PromQL, which is a powerful query language that allows you to slice and dice the time-series data you collect to provide insights and trigger alerts.
- Single Server Nodes: Prometheus has been designed to operate in an autonomous way, without distributed storage, which makes it less complex to deploy and scale.
- Service Discovery and Alerting: Prometheus will discover your target services automatically and supports alerting if you define the rules, allowing you to notify through numerous channels.
- Grafana:
- Multi-Source Data Visualization: Grafana can also work with the Prometheus data source and provides visualizations that combine a variety of data sources into one dashboard that you can customize.
- Rich Visualization Options: There are many different visualization panels available in Grafana, including graphs, heatmaps, and tables, to represent your data.
- Alerting and Notification: In addition to monitoring, Grafana has alerting options that can notify through multiple channels when specified thresholds are met.
- Extensible with Plugins: Grafana has many plugins available to extend the functionality of the data source and integrate with external systems.
Pricing:
- Prometheus: Prometheus is part of the open-source project and is therefore free, but organizations may have infrastructure/storage costs when they are deploying Prometheus in their environments.
- Grafana (Open Source Edition): The open-source edition of Grafana can be self-hosted and is free for unlimited dashboards and visualizations.
- Grafana Cloud:
- Free Forever: Free for limited metrics/logs/traces for 14-day retention.
- Pro Pay as You Go: Starting at $19 per month for expanded usage for 30-day retention, with usage-based charges on top.
- Advanced: Starting at $299 a month for greater limits, enterprise plugins, and 24×7 support.
What is the best alternative to New Relic?
The choice of the most suitable New Relic alternative boils down to the needs of your organization and your priorities. Each of the tools discussed above certainly has its strengths:
| Tool | Best For | Key Strengths | Considerations |
|---|---|---|---|
| Middleware | Best overall balance for modern teams in 2026 | Full-stack coverage, AI querying, LLM monitoring, affordable pricing | Newer platform, evolving ecosystem |
| Datadog | All-in-one observability with deep features | Rich, integrated UI for metrics, logs, and traces | Higher pricing for full-stack features |
| Dynatrace | Enterprises needing automation & AI-driven insights | Intelligent monitoring with automation, ideal for large-scale environments | Complex setup for smaller teams |
| AppDynamics | Application-centric visibility linked to business impact | Strong APM with end-user and revenue-focused insights | Heavier enterprise tool, less open/customizable |
| Elastic APM | Open-source control with real-time performance monitoring | Cost-effective, integrates with Elastic Stack | Requires more hands-on setup and maintenance |
| Prometheus + Grafana | Fully open-source DIY stack | Customizable, great for infrastructure metrics and visualizations | No built-in tracing or AI features |
| Honeycomb | Modern debugging and high-cardinality observability | Powerful querying for complex issues, modern UX | More niche use-case focus (not full-stack) |
Middleware gives you the full-stack coverage of a Datadog or New Relic, close to an open-source cost transparency, and also innovation in features such as LLM monitoring and AI-driven querying that emerging teams will appreciate. Its ease of deployment and monitoring platform design make it the best overall New Relic alternative for most teams in 2026.