OpenTelemetry Metrics is a standard, open-source framework, part of the OpenTelemetry project, providing tools to collect, aggregate, and process telemetry data from applications.
These metrics are various numbers that indicate the performance or behavior of your application, such as response times, memory usage, or the number of requests handled. Compared to traditional methods, they reduce troubleshooting time by 44.6%.
Before we dive deep into OpenTelemetry metrics, here are the key advantages it offers:
- Connect metrics with other signals: It allows you to connect metrics with traces and logs for better overall OTel observability. For example, you can correlate a spike in response time (metric) with a specific request.
- Supports existing tools: OpenTelemetry integrates well with existing popular tools like Prometheus and Middleware, so users can continue using their preferred systems while benefiting from OpenTelemetry’s features.
- Easy migration: If you are coming from older systems like OpenCensus, you can easily switch to OpenTelemetry without losing any data.
OpenTelemetry Metrics Data Model
Metrics in observability play a key role, allowing teams to track performance, spot issues, and optimize resources. OpenTelemetry offers metrics systems with different metrics types, attributes, and exemplars, making it easy to monitor applications accurately.
Types of OTel Metrics
OpenTelemetry offers four main types of metrics: counter, gauge, histogram, and summary. This section will discuss each in detail.
1. Counter
A Counter will only track values that increase over time, making it suitable for measuring the total number of HTTP requests or database errors. Since Counter uses atomic values, it makes it suitable for getting accurate numbers even in concurrent environments.
Here is a simple example written in Go where a counter will be incremented by one each time the payment API fails:
failed_payments.Add(ctx, 1, attribute.String("endpoint", "/api/checkout"))Organizations also tend to use multi-dimensional counters (tagged with attributes like http.status_code) to improve anomaly detection even further.
2. Gauge
A Gauge captures real-time information about the system, including CPU usage, the number of active connections, and other OpenTelemetry metrics. Unlike Counters, Gauge values can increase or decrease over time.
Here is a simple Python Gauge to monitor memory usage dynamically:
memory_gauge = meter.create_observable_gauge(
    "system.memory.usage",
    callbacks=[lambda: psutil.virtual_memory().percent]
)
3. Histogram
A histogram measures how often values fall into specific bucket ranges, making it essential for monitoring metrics like response times or SLA compliance.
Histogram offers two types of bucket strategies:
- Explicit buckets: Allows precise control over range boundaries.
- Exponential buckets: Lets you optimize storage while maintaining accuracy.
For example, here’s a Java Histogram that can measure API response times using predefined buckets:
Histogram latency = meter.histogramBuilder("http.duration")
    .setUnit("ms")
    .build();
latency.record(245); // Records a 245ms request
4. Summary (Legacy)
Summary is a type of metric that calculates specific percentiles, such as 99th percentile latency, within the application itself. However, it has higher storage costs and aggregation problems, which is why OpenTelemetry has decided to phase out (or deprecate) summaries in favor of Histograms.
OTel Metric Attributes
Metric attributes are key-value pairs that provide additional context to your OpenTelemetry metrics. This way the end result is more useful and interpretable. These attributes are commonly referred to as dimensions or labels.
1. Labels
Labels in OpenTelemetry metrics are key-value pairs (e.g., http.method="GET") attached to metrics to add additional information. By doing so, Labels allows you to have detailed filtering and analysis, such as tracking error rates by endpoint or region.
However, using labels with a large number of unique values, known as high-cardinality labels, can lead to performance loss and increased storage requirements.
To manage this problem, you are advised to:
- Adopt standard naming schemas such as using
http.status_codeinstead of a generic term like status. - Limit the combination of unique labels to prevent cardinality explosion, which can degrade system performance.
Here’s a simple example of the implementation of the above recommendations:
http_errors{method="POST", status="429", region="us-east"}2. Dimensions
Similar to Labels, Dimensions are also key-value pairs that categorize metrics such as production vs. development) or service version. Apart from that, it also assists in isolating performance metrics across different categories, such as latency differences between regions, to enhance overall tracking.
You are recommended to separate dynamic tags from static ones, such as avoiding highly variable identifiers like instance IDs as dimensions, and instead using more stable identifiers like cluster names.
By applying Labels and Dimensions appropriately, you can improve the granularity and actionability of your OTel metrics, leading to more effective monitoring and faster issue resolution.
What Are Exemplars?
Exemplars are additional, individual measurements captured alongside aggregated metric data. They carry details such as the recorded value, timestamp, associated trace and span IDs, and any relevant attributes present during the measurement.
Let’s take an example for better understanding. Consider an application that is monitoring HTTP request duration using a Histogram metric, and here, you can implement Exemplar to record a specific request that experienced higher latency than usual:
http_request_duration_seconds_bucket{le="1.0", method="GET", route="/api/data"} 5
# Exemplar: {trace_id="abc123", span_id="xyz789", value=0.8, timestamp=1627847265000000000}
Collecting and Exporting Metrics
Collecting and exporting metrics is an essential component of observability. It involves gathering data from your application and forwarding it to the backend for analysis.
OpenTelemetry simplifies this process via language-specific SDKs, flexible exporters, and standard communication protocols, which together ensure that your OTel metrics pipeline is both robust and scalable.
OpenTelemetry SDKs
You can find OpenTelemetry SDKs available for almost every production-grade programming language, including Java, Python, Go, JavaScript, and more. By doing so, a user can instrument code efficiently and collect telemetry data (metrics, traces, and OTel logs) with minimal overhead.
Each SDK is developed to integrate well with its target language. For example, the Java SDK uses annotations and interceptors, while the Python SDK uses context managers and decorators for automatic instrumentation.
Apparently, these SDKs are updated and maintained by the community to ensure best practices and new features are incorporated correctly.
OTel Metric Exporters
In OpenTelemetry, metric exporters transmit metrics to monitoring systems or storage backends. There are multiple types of metric exporters, and the way data is sent and stored entirely depends on the choice of exporters.
There are three types of metric exporters, each serving a different purpose.
1. OTLP (OpenTelemetry Protocol)
OTLP is a vendor-neutral protocol optimized for transmitting telemetry data. One key feature of OTLP is that it supports both gRPC and HTTP transport to ensure stable performance over diverse network conditions.
OTLP is a recommended exporter for environments where interoperability and standardization are the top priorities.
2. Prometheus Exporter
Prometheus is one of the most popular and widely adopted open-source monitoring systems. It uses a pull-based model to collect metrics. One of its primary features is its ability to collect and format data so that Prometheus can scrape and store it later. This is particularly helpful in cloud-native environments like Kubernetes clusters.
3. Jaeger Exporter
Although Jaeger is primarily known for distributed tracing, its exporter can be used to correlate trace data with metrics. The link between trace data and metrics is important here as it provides insights into both high-level metric trends and granular trace information.
Metric Collection Protocols
To support secure and reliable connection, OpenTelemetry supports standard protocols for metric collection, including HTTP and gRPC.
1. HTTP
Hypertext Transfer Protocol, short for HTTP, is one of the oldest and most standardized protocols used in multiple monitoring solutions. It is simple to implement and debug, making it suitable for environments where ease of integration is a key priority. However, it might not provide the best performance required in high-throughput systems.
2. gRPC
gRPC reads for Google Remote Procedure Call, a solution from Google offering high-performance, low-latency communication by leveraging HTTP/2. It is particularly useful for high-volume environments where efficiency and error handling are the key priority.
gRPC also supports bi-directional streaming, which can be a huge plus for continuous data transmission and real-time analytics.
Choosing between HTTP and gRPC can be a bit tricky, so here’s a thumb rule to help you find the perfect fit. HTTP may be sufficient for applications with moderate telemetry data and simpler network setups. However, gRPC is often the preferred choice for systems that require high throughput and low latency.
OpenTelemetry Metrics Instrumentation
Instrumentation for OpenTelemetry involves adding code to your application to collect telemetry data such as metrics, traces, and logs. There are two main approaches to instrumentation in OpenTelemetry: automatic and manual.
In this section, we will walk you through both methods, explaining their benefits and use cases. We will also share best practices to help you optimize performance and reduce overhead.
Automatic Instrumentation
OpenTelemetry’s automatic instrumentation allows you to inject telemetry collection into your application without requiring manual code changes. By manipulating bytecode, using dynamic proxies, or using eBPF hooks, you can do this.
It is specifically helpful when one wants to enable observability across multiple devices as quickly as possible.
To support automatic instrumentation, many production-grade programming languages offer auto-instrumentation packages. For example, the OpenTelemetry automatic instrumentation packages for Python or JavaScript can automatically instrument web frameworks, databases, and HTTP clients.
The best part of using automatic instrumentation is it requires minimal configuration and still captures key metrics like request counts, error rates, and latency and attaches relevant context.
For example, if you have automatic instrumentation enabled in Python, all you have to do is run the application with the agent, and it will get the job done:
$ opentelemetry-instrument python app.pyAutomatic Instrumentation using Middleware
Middleware simplifies automatic instrumentation for Kubernetes environments using the OpenTelemetry Operator, which automatically injects instrumentation agents into pods.
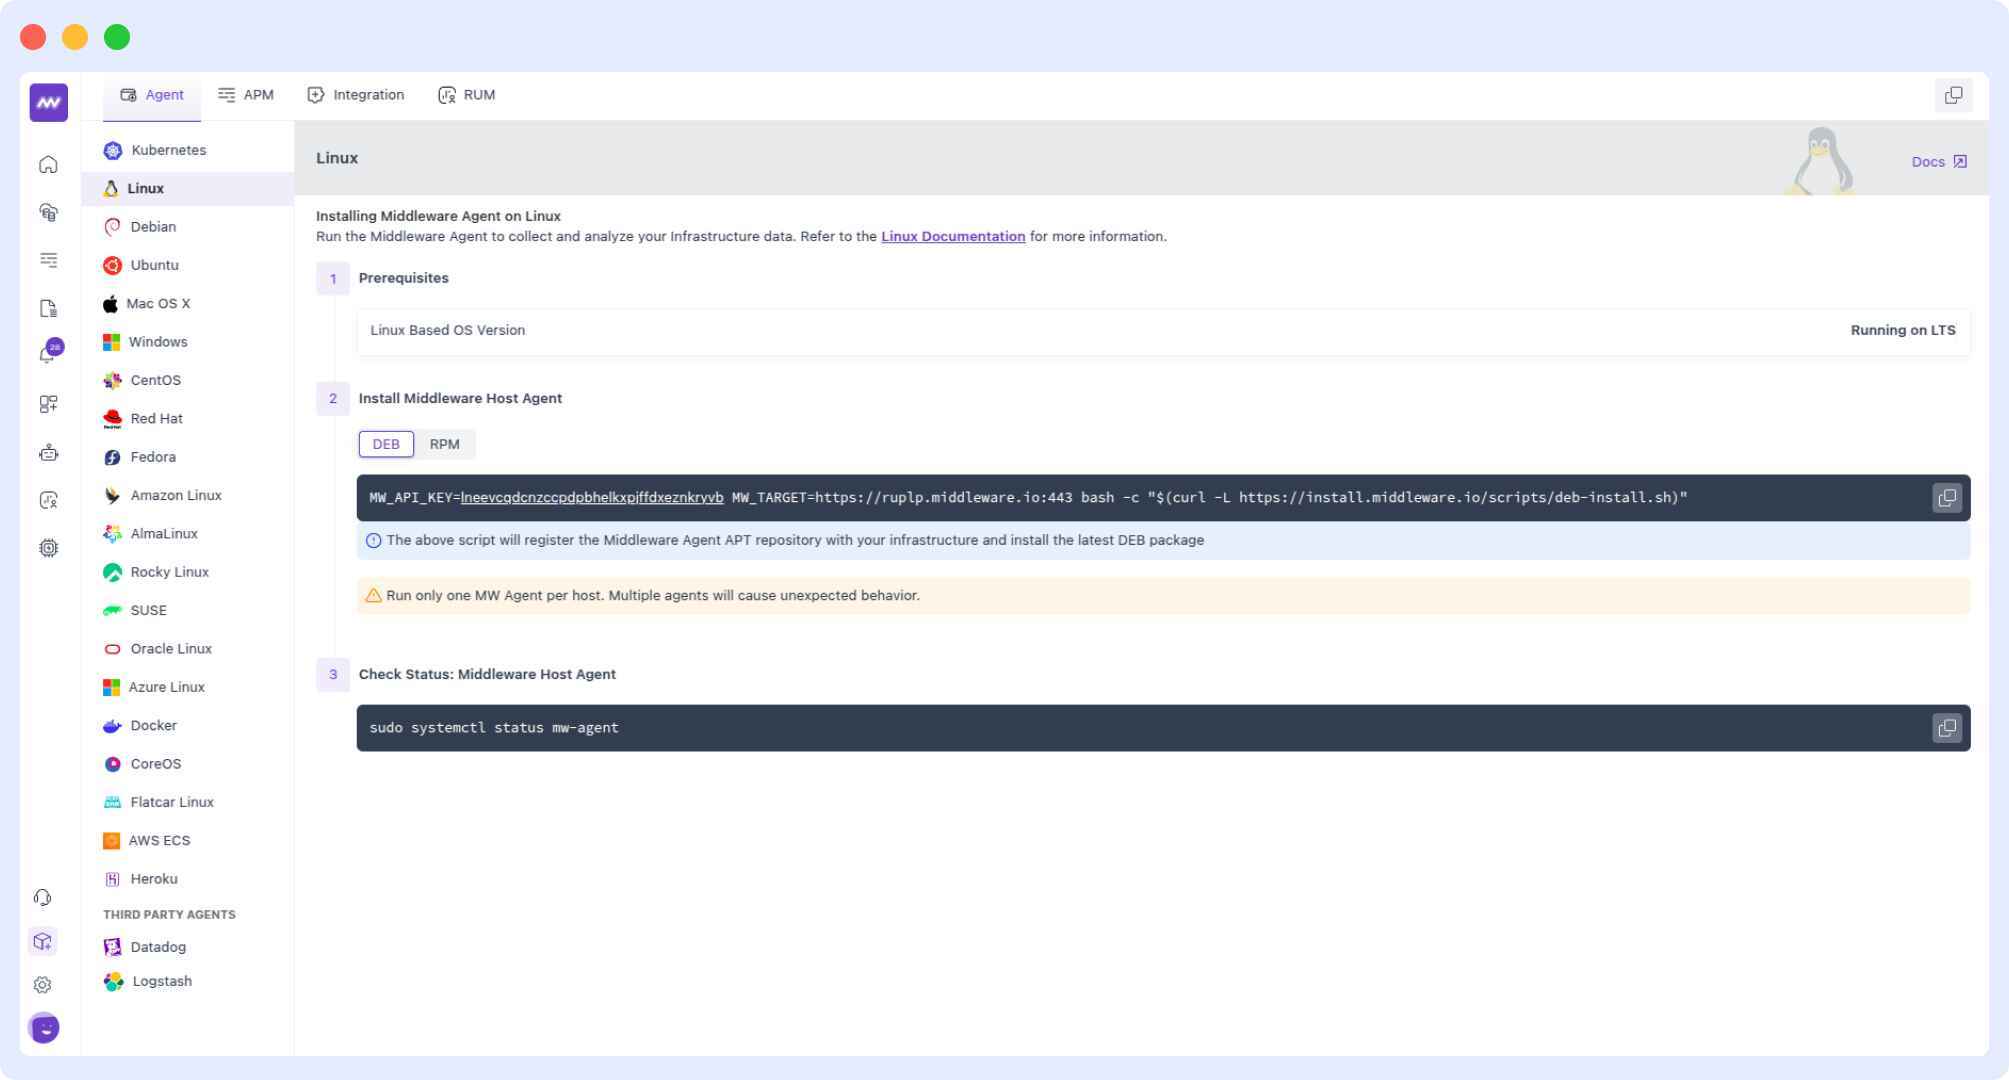
One key feature that makes Middleware stand out is that it uses Helm charts to deploy instrumentation across namespaces and auto-detects languages, including .NET, Java, Node.js, Python, and Go services.
Here are bash commands that uses helm for automatic instrumentation:
helm repo add middleware-labs https://helm.middleware.io
helm install mw-auto middleware-labs/mw-autoinstrumentation \
  --set mw.apiKey=<YOUR_API_KEY> \
  --set mw.target=https://<YOUR_CLUSTER>.middleware.io:443 \
  --namespace mw-autoinstrumentation
Once done, use Middleware’s UI to toggle instrumentation for specific deployments without restarting pods.
Manual Instrumentation
Opposite to automatic instrumentation, manual instrumentation gives you direct control over what and how you want to monitor your applications. By adding code snippets and APIs, you create and collect custom metrics specific to your needs.
OpenTelemetry provides SDKs for creating custom metrics, recording events, and even adding attributes. The manual approach is ideal for those who want total control and need to track specific metrics that might be missed by automatic instrumentation.
Here’s a code snippet written in Go suggesting how you can instrument your code to count transactions while also tagging them with relevant metadata:
// Import the OpenTelemetry SDK and create a meter for custom metrics.
meter := global.Meter("my-service")

// Create a counter metric to track processed transactions.
transactionsCounter, _ := meter.Int64Counter(
    "transactions_processed_total",
    metric.WithDescription("Total number of processed transactions"),
)

// Increment the counter with additional context.
transactionsCounter.Add(ctx, 1, attribute.String("transaction_type", "payment"))
Manual Instrumentation with Middleware SDK
For custom metrics, Middleware provides language-specific SDKs compatible with OpenTelemetry’s API.
Here’s a simple example of how it can be implemented in Python:
from opentelemetry import metrics
from opentelemetry.sdk.resources import Resource
from opentelemetry.sdk.metrics import MeterProvider

# Middleware-specific resource attributes
resource = Resource.create({
"mw.account_key": "<YOUR_API_KEY>",
"service.name": "payment-service",
"mw_agent": "true"
})

# Initialize meter
provider = MeterProvider(resource=resource)
metrics.set_meter_provider(provider)
meter = metrics.get_meter("payment.meter")

# Custom counter
failed_payments = meter.create_counter(
"payment.failed",
description="Total failed payment attempts"
)

# Tag transactions with the gateway context
failed_payments.add(1, {"gateway": "stripe", "env": "prod"})
This code uses the OpenTelemetry Python SDK to manually instrument an application by creating a custom counter, adding Middleware-specific resource attributes (like mw.account_key, service.name, and mw_agent).
Once done, configure the OpenTelemetry Collector to route metrics to Middleware’s endpoint:
# otel-collector-config.yaml
exporters:
  otlp/middleware:
endpoint: "<YOUR_CLUSTER>.middleware.io:443"
headers:
  "mw-api-key": "<YOUR_API_KEY>"

service:
  pipelines:
metrics:
   exporters: [otlp/middleware, prometheus]
Best Practices for Instrumentation
To get the most out of instrumentation, you may want to consider the following practices:
- Balance granularity and overhead: You should only be implementing instrumentation when necessary. You might want to avoid overly fine-grained metrics which do not add much value but increase storage and processing costs.
- Use standard semantic conventions: You are recommended to stick to the established naming convocations such as using http.status_code instead of a generic label like status to ensure consistency and ease of integration with multiple tools.
- Combine automatic and manual instrumentation: You can use the automatic for general coverage and the manual for application-specific needs. This hybrid approach helps you cover both general and custom metrics with comparatively less effort compared to sticking to only one type of instrumentation.
Visualizing and Analyzing Metrics
For actionable insights, metrics are not enough, and the process must include often ignored operations like visualizing, querying, and alerting based on that data. By implementing visualization tools, query languages, and alerting mechanisms, teams can get real-time insights and respond to issues quickly.
Integration with Visualization Tools
OpenTelemetry allows you to integrate your existing workflow with popular visualization tools like:
Middleware
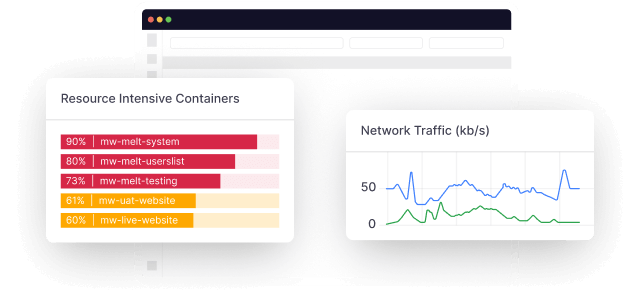
Middleware is an observability platform that brings metrics, logs, and traces all in one dashboard. By adding AI features to its stack, it provides you with dynamic graphs, heatmaps, and tables to track performance over time.
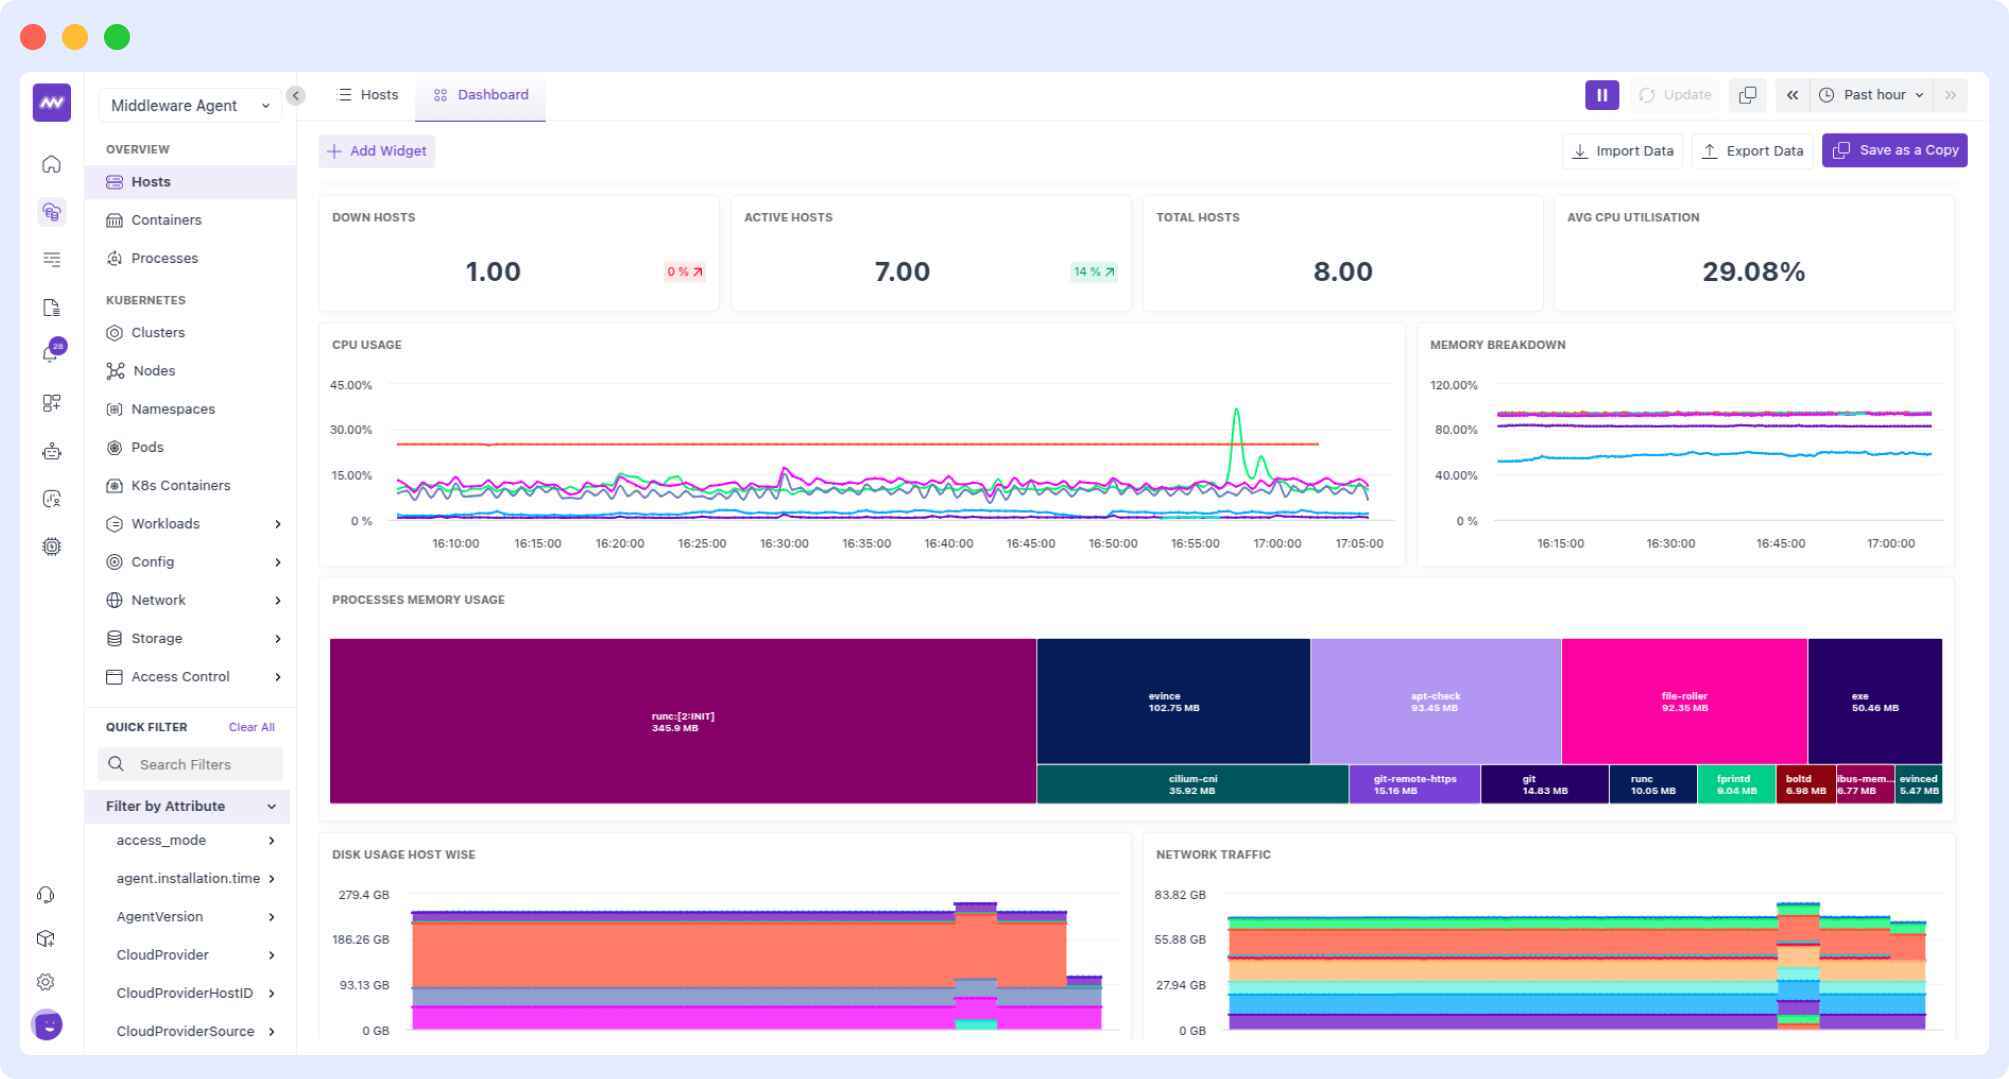
On top of that, Middleware simplifies the integration process by connecting directly with the OpenTelemetry Collector or Middleware’s agent for seamless data ingestion.
Key features of Middleware visualization:
- Custom dashboards for specific teams and projects
- Ability to correlate metrics, logs, and traces in a single timeline to debug issues faster.
- Live mode, which lets you stream data in 5-second intervals for immediate feedback on system performance.
Grafana
Grafana is one of the most popular visualization tools. It has a dynamic dashboard and allows you to display metrics in graphs, heat maps, and other visual formats. The best part is that Grafana also supports sources like Prometheus, enabling you to create interactive, real-time monitoring dashboards.
Prometheus
Unlike Grafana, Prometheus is both a monitoring system and a time-series database. When you pair it with OpenTelemetry, it can scrape and store metrics, allowing for flexible visualization and analysis directly in its interface or through integrations with Grafana.
These integrations ensure that you can customize your visualizations according to your needs and quickly identify performance trends or anomalies.
Querying and Filtering Metrics
To make more sense of the large volumes of metric data, it is necessary to add query language to your workflow:
PromQL (Prometheus Query Language)
As the name suggests, PromQL syncs well with Prometheus as you can directly retrieve and manipulate time-series data from Prometheus. It also allows you to filter metrics by labels, aggregate data over time, and calculate rates or averages. For instance, you can query for the average CPU usage over the last five minutes across all instances.
OTQL (OpenTelemetry Query Language)
OTQL was developed to align well with and sync with the existing ecosystem of OpenTelemetry. It simplifies data navigation by allowing you to filter metrics based on attributes and perform aggregations essential for performance analysis.
Using the query language, teams can isolate specific issues, compare performance across different dimensions and generate actionable insights.
Alerting and Notification
An alerting system is essential for maintaining system health. Integrating alerting tools with metrics allows for quick identification of potential issues.
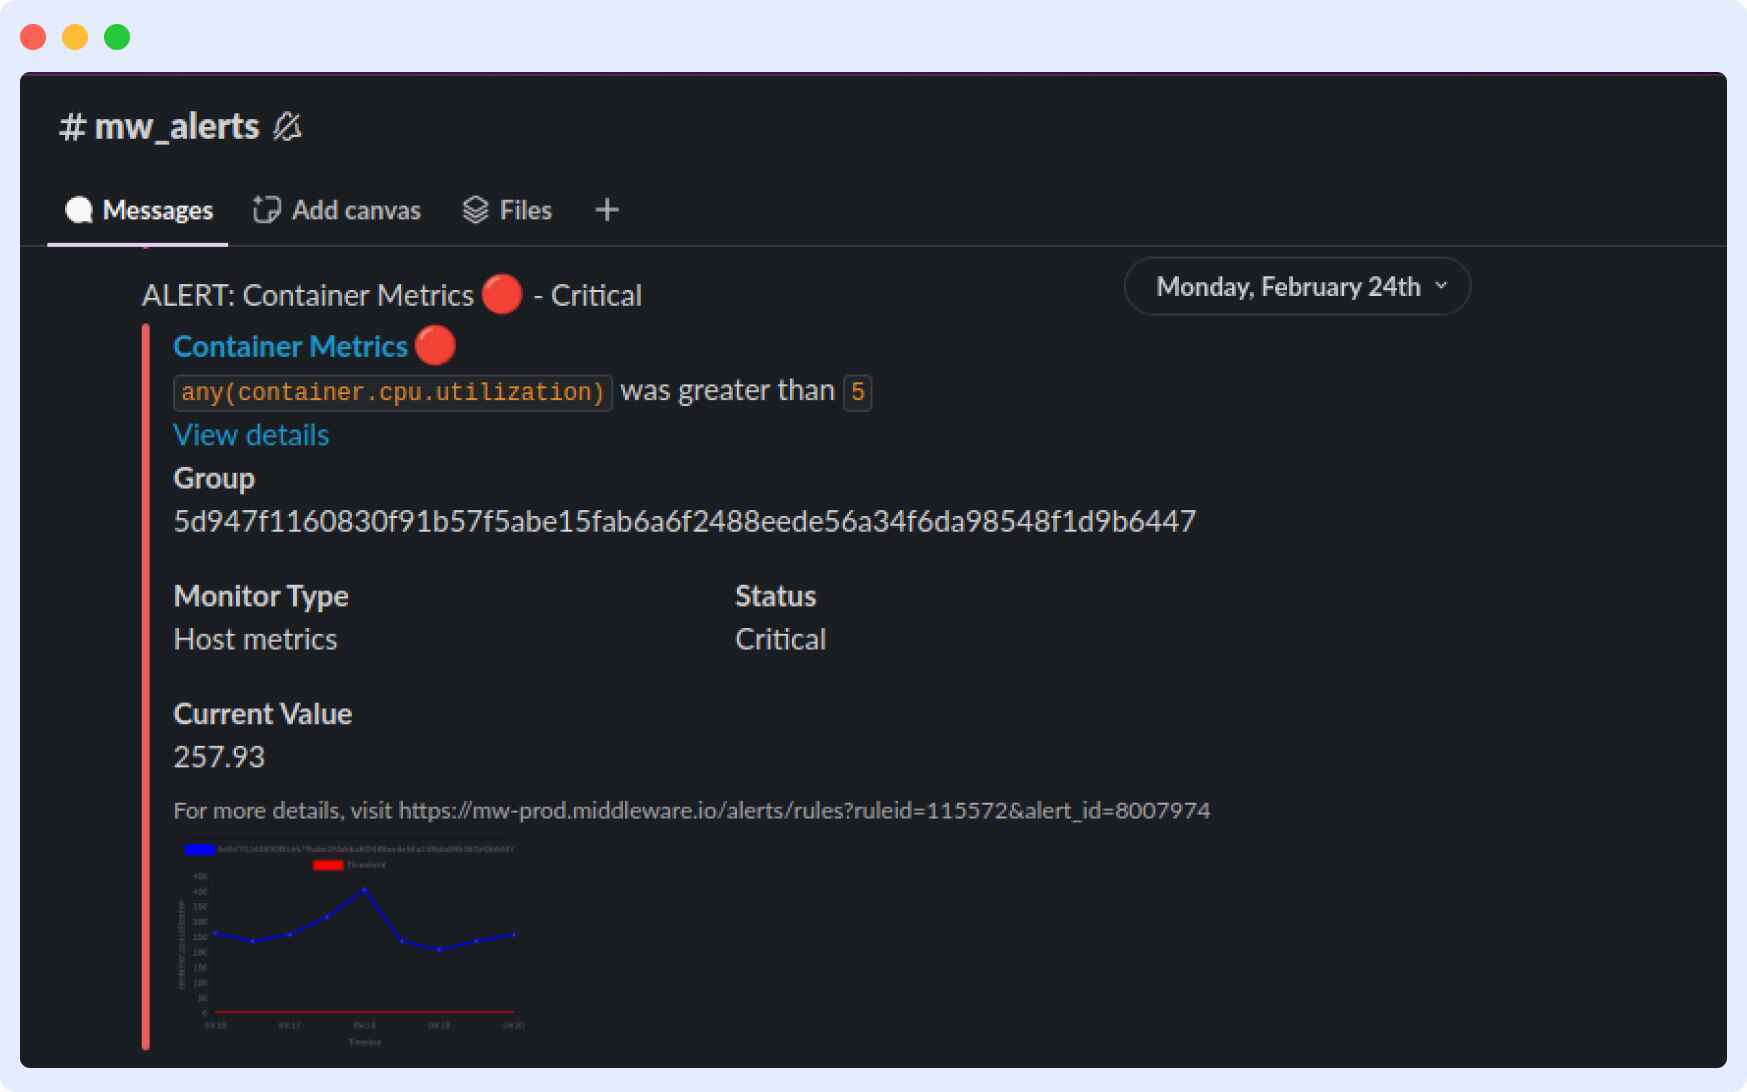
Middleware
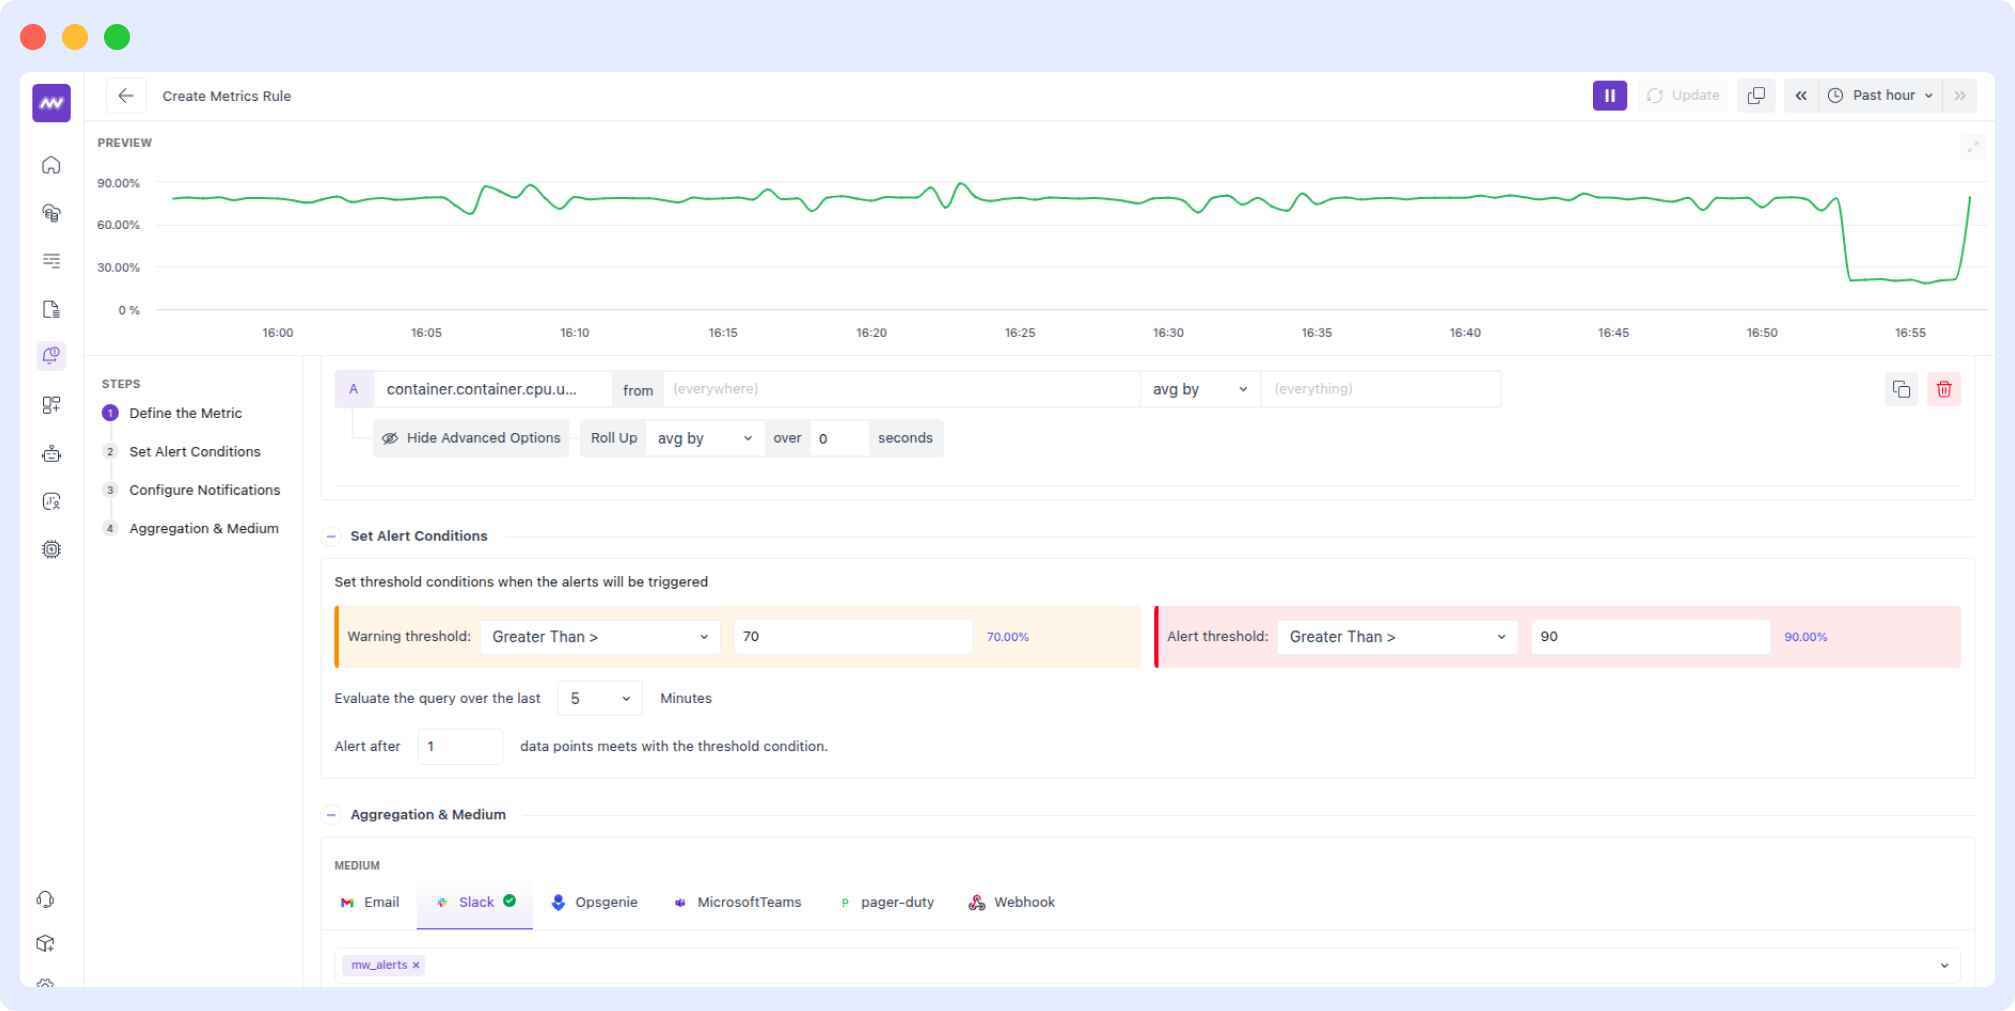
Middleware’s alerting system is seamless, especially when using it with OpenTelemetry metrics. It supports threshold-based alerts, AI-driven anomaly detection, and multi-channel notifications via Slack, PagerDuty, or email. Alerts in Middleware are linked directly to relevant metrics and traces, enabling faster root cause analysis.
Learn how to set up alerts and customize alerts for better monitoring and incident response with Middleware.
Alertmanager
Alertmanager is usually paired with Prometheus and can handle alerts by deduplicating, grouping, and routing them to the proper channels. It also allows multiple ways to receive notifications, including email, Slack, or other communication platforms, so you won’t miss out on any critical alerts.
PagerDuty
PagerDuty is a widely adopted alerting tool and integrates well with multiple monitoring systems. It allows you to automatically escalate alerts, ensuring that the right team members are notified immediately when performance thresholds are breached.
Implementing an alerting system ensures that anomalies and critical incidents are promptly identified and addressed, reducing downtime and minimizing the impact on users.
Conclusion
In short, OpenTelemetry metrics are the most complete way to monitor system performance. By providing flexible metric types, they ensure seamless data collection that is straightforward to analyze and insightful enough to tackle possible issues.
OpenTelemetry metrics will further develop in the coming months and beyond. These include anything from automated instrumentation developments to the best approaches for data aggregation to increasing the standard observability practices we’re accustomed to seeing.
In other words, it will provide greater interoperability and scalability and equip organizations with a more functional, integrated, and unified way to monitor ever-developing complexities in a cloud-native spirit.