Summary: OpenTelemetry tools are observability backends that ingest, store, and query telemetry data – metrics, logs, and traces – collected using the OpenTelemetry standard. OpenTelemetry (OTel) itself is a CNCF project that defines how applications emit telemetry: language SDKs for instrumentation, the OTel Collector for processing, and OTLP as the wire protocol for delivery. The tools in this guide are where that data lands.
TL;DR
- Full-stack cloud-native teams: Middleware – OTel-native, unified signals, OpsAI SRE agent, $0.30/GB
- Open-source composability: Grafana LGTM Stack – no vendor lock-in, strong OTel contributions, operational overhead
- Enterprise integration breadth: Datadog – 1,000+ integrations, powerful, expensive
- Usage-based SaaS without per-host billing: New Relic – 100 GB free, per-GB and per-seat model
- AI-driven autonomous observability: Dynatrace – Davis AI, Gartner Leader, enterprise-grade
- Security-first observability: Splunk Observability Cloud – deep SIEM overlap
- Elastic Stack shops: Elastic Observability – OTel-native, strong log search
- High-cardinality trace exploration: Honeycomb – purpose-built, SaaS-native OTLP ingestion
- AWS-native observability: Amazon CloudWatch – full OTLP support (metrics preview April 2026), no new vendor required for AWS teams
- Low-cost OTel APM: Uptrace – ClickHouse-backed, simple, no frills
- Open-source Datadog alternative: SigNoz – unified signals, $0.30/GB on cloud
- Zero-cost metrics and tracing foundation: Prometheus + Jaeger – free, battle-tested
Choosing the wrong backend is expensive to undo. Your instrumentation stays portable because it is OTel-based, but your dashboards, alert logic, and query language stay behind when you switch. This guide cuts through vendor marketing to tell you which platforms actually work well with OpenTelemetry, what they cost in practice, and who each one is actually built for.
Quick comparison: 12 OpenTelemetry tools at a glance
| Tool | OTel native? | Signals | Starting price | Self-hosted? | AI remediation |
|---|---|---|---|---|---|
| Middleware | Yes | Metrics, Traces, Logs, RUM, Synthetics | $0.30/GB after 14-day trial | Yes (Enterprise BYOC / on-prem) | OpsAI – auto RCA and PR generation |
| Grafana LGTM | Yes | Metrics, Traces, Logs | Free OSS / $19/month Cloud | Yes | None (Cloud ML only) |
| Datadog | No (compatible) | All signals + SIEM | $15/host/month | No | Watchdog (anomaly detection) |
| New Relic | No (compatible) | All signals | Free 100 GB then $0.30/GB | No | NRAI (query assistant) |
| Dynatrace | No (compatible) | All signals | $0.01/GiB-hour | Yes (managed) | Davis AI – causal RCA |
| Splunk | Yes | All signals + SIEM | Custom enterprise | Yes | IT Service Intelligence |
| Elastic | Yes | All signals | $95/month Cloud | Yes | ML anomaly detection |
| Honeycomb | Yes | Traces, Events, Metrics | Free then $130/100M events | No | BubbleUp |
| Amazon CloudWatch | Partial (OTLP preview) | Metrics, Traces, Logs | Pay-per-use | No | AIOps (detection only) |
| Uptrace | Yes | Metrics, Traces, Logs | Free OSS / usage-based Cloud | Yes | None |
| SigNoz | Yes | Metrics, Traces, Logs | Free OSS / $0.30/GB Cloud | Yes | None |
| Prometheus and Jaeger | Yes | Metrics, Traces | Free | Yes | None |
What to check before picking an OpenTelemetry backend
Five things that actually differentiate tools in this category:
- OTel-native vs. compatible. Native means your data is stored as-is in the OTel schema – attributes intact, no mapping. Compatible means OTLP is accepted but the backend rewrites it into a proprietary model. You may lose attributes, rename fields, or find that certain OTel features have no equivalent in the destination schema.
- Which signals are unified. If traces land in one tool, metrics in another, and logs in a third, you will spend incident time switching contexts rather than diagnosing the problem. A single backend that handles all three is meaningfully faster to work with.
- Query language lock-in. NRQL, DQL, and Splunk SPL are all proprietary. If you build 200 dashboards in NRQL and later need to move, you rebuild from zero. PromQL, SQL, and open standards transfer.
- How pricing behaves at scale. Per-host pricing punishes autoscaling. A Kubernetes cluster that scales from 10 to 60 pods during a traffic spike should not generate a surprise bill. Per-GB models are predictable; per-host models are not.
- Whether the platform takes action or only shows data. Most tools alert. Few diagnose. Only a handful attempt to fix. If your team is on-call and wants to sleep, that distinction matters.
1. Middleware
Best for: Cloud-native DevOps and SRE teams who want full-stack observability with AI-driven auto-remediation
Middleware is a full-stack observability platform built for cloud-native engineering teams. It combines infrastructure monitoring, APM, log management, RUM, Kubernetes observability, and the OpsAI SRE agent in a single OpenTelemetry-native platform.
OpsAI is an AI SRE agent that detects, diagnoses, and auto-resolves production issues using first-party access to Middleware’s full observability stack – APM traces, RUM sessions, Kubernetes telemetry, logs, and metrics – without external API hops or schema translation. When OpsAI reaches a confidence threshold, it generates a GitHub pull request with a clean diff.
Key features
- OTLP ingestion over gRPC and HTTP for metrics, traces, and logs – no schema translation
- Auto-instrumentation for Python, Node.js, Java, .NET, and Go using standard OTel SDKs
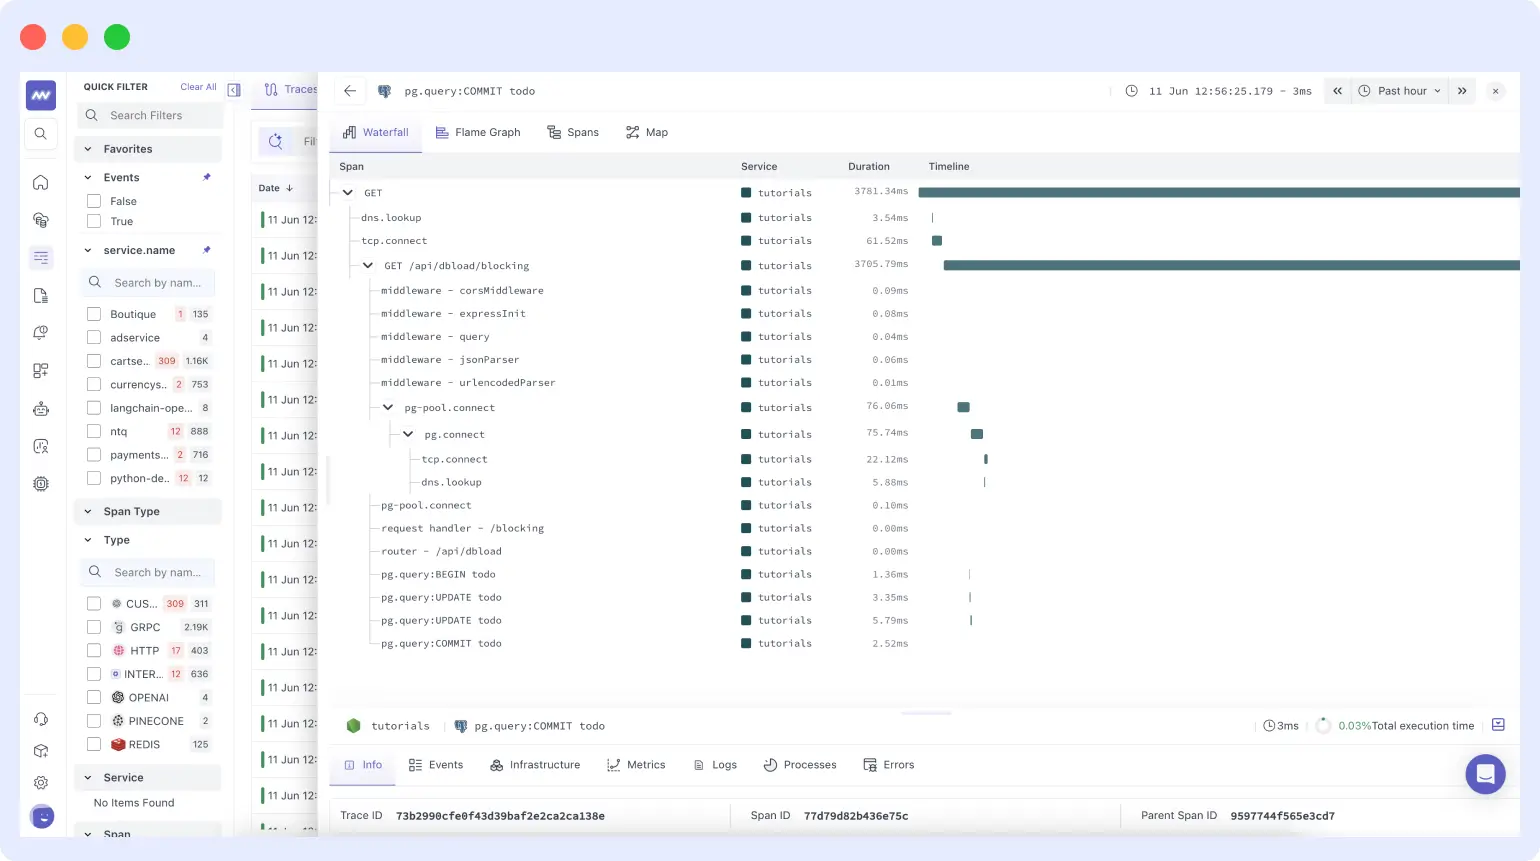
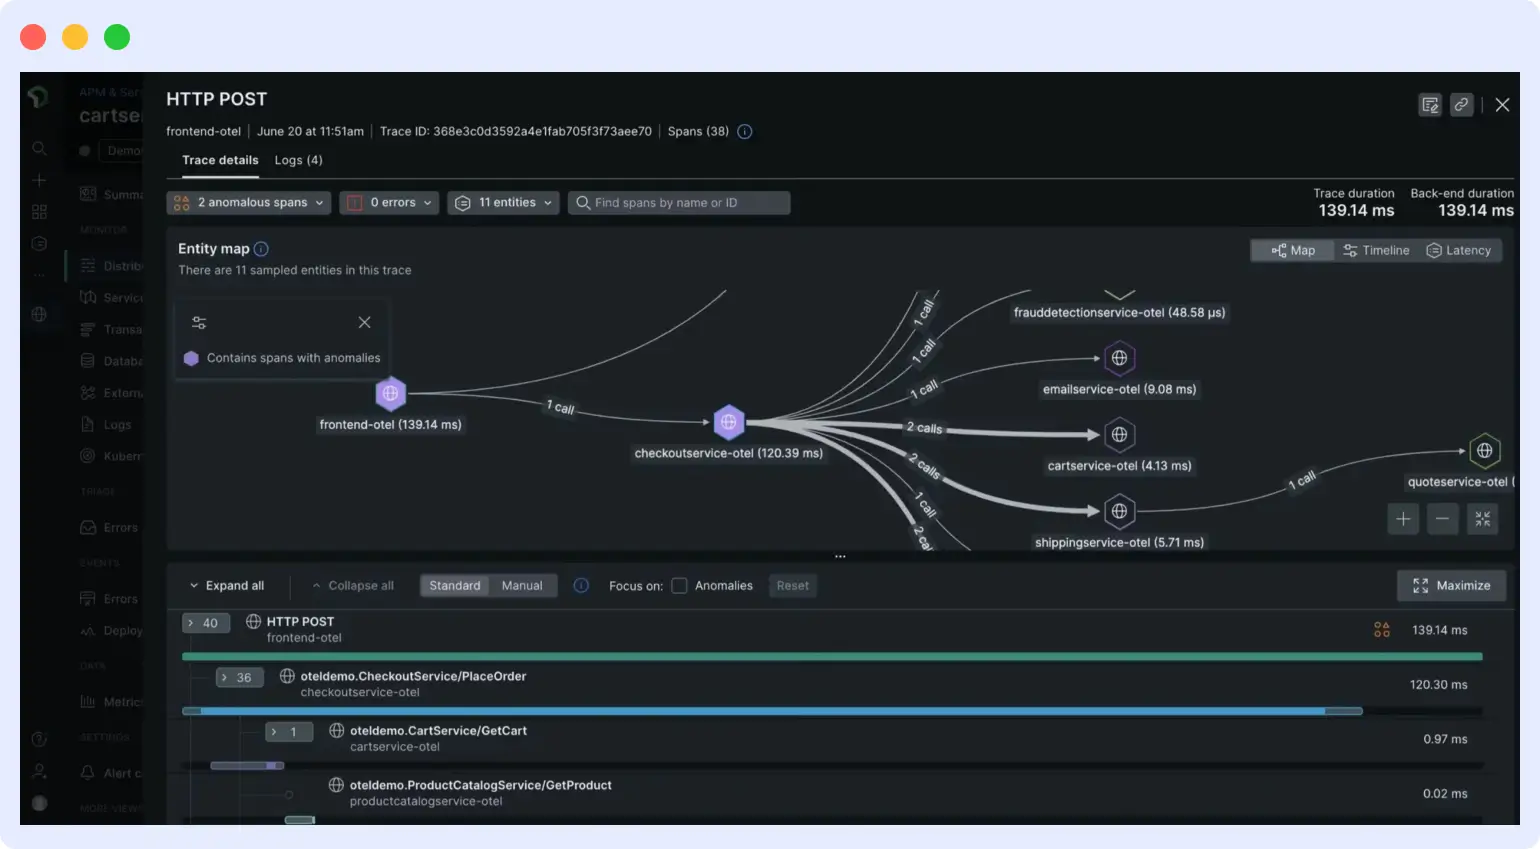
- APM with distributed tracing, service maps, and slow query detection
- Kubernetes monitoring with node, pod, and namespace dashboards and OpsAI Auto Fix for OOMKilled and CrashLoopBackOff
- OpsAI root cause analysis with GitHub MCP integration and automated PR generation
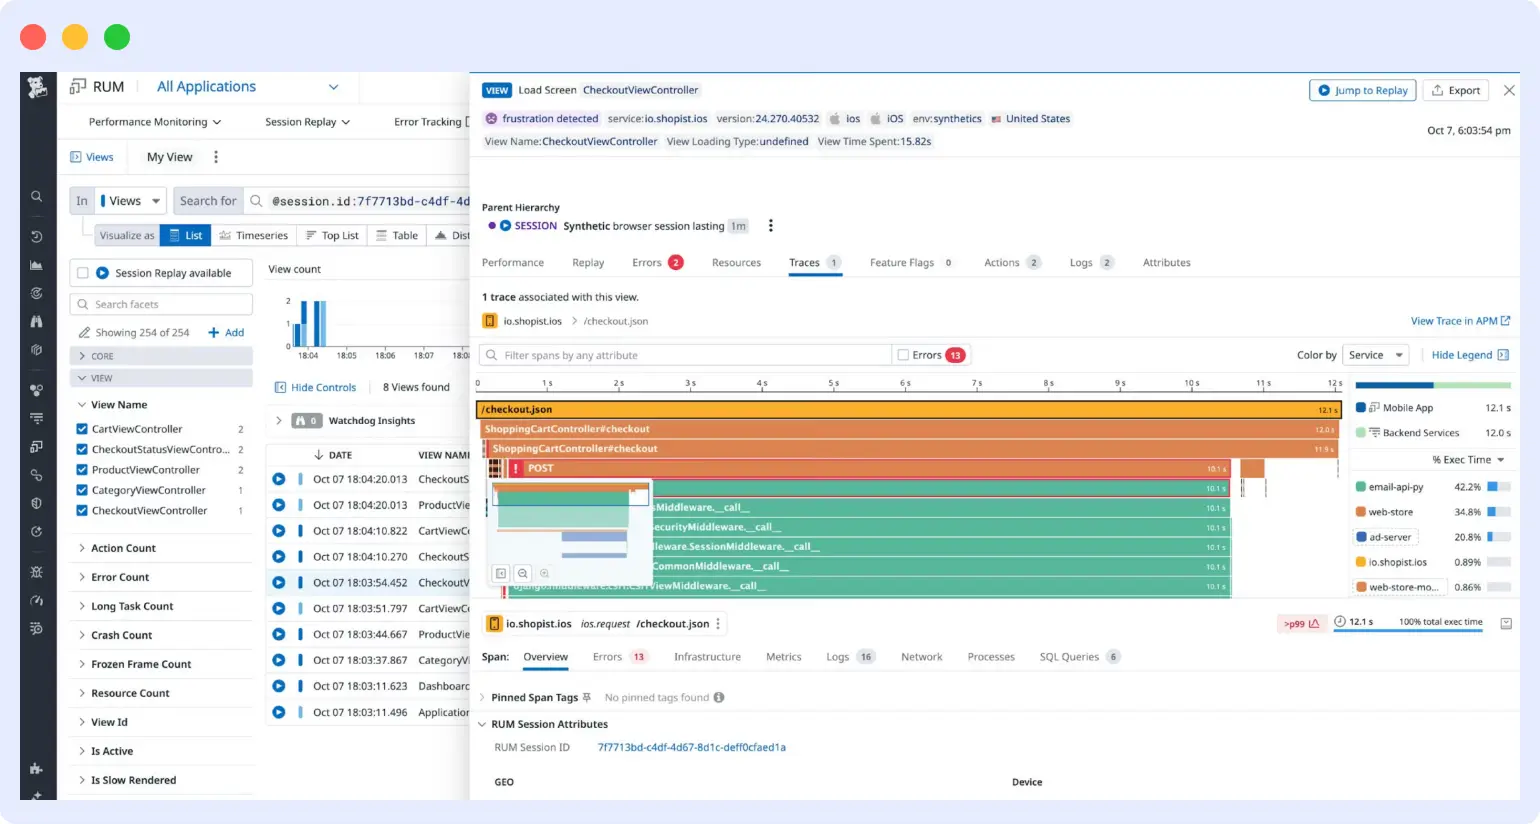
- Real User Monitoring with session replay, Core Web Vitals, and trace correlation to backend spans
- Synthetic monitoring for uptime and API checks
- AI-powered anomaly detection on response time, error rate, and infrastructure signals
OpenTelemetry support
Middleware is OTel-native at the data model level. OTLP is the primary ingestion path. Traces, metrics, and logs are stored and queried in the OTel schema – no attribute translation on the way in. The OTel Collector works directly in the collection pipeline. Full setup instructions for all languages: Middleware OTel getting started guide.
What’s good
- OpsAI has first-party access to all five signal types on the same platform. External AIOps tools that call your APM via API are slower and work with less context. Middleware’s agent does not need to cross an API boundary to correlate a frontend RUM error with a backend trace and a Kubernetes restart.
- Full signal coverage in one product means you are not switching between Datadog for APM, Grafana for infrastructure, and a third tool for RUM during an incident.
- No per-host billing. A 60-pod Kubernetes deployment costs the same per-GB as a 10-pod one.
- OpsAI connects to Datadog and Grafana, so teams with existing investments can try agentic remediation before fully migrating.
The catch
- The platform is newer, so the integration catalog is smaller than Datadog’s 1,000+ list – though the OTel Collector covers most gaps
- OpsAI’s agentic workflows have a ramp-up period for teams new to AI-assisted remediation
Pricing
- Free Trial: 14 days, unlimited data ingestion, unlimited RUM sessions, unlimited synthetic checks, 14-day retention
- Pay As You Go: $0.30/GB for metrics, logs, and traces
- RUM: $1 per 1,000 sessions
- Synthetic monitoring: $1 per 5,000 checks
- No per-host fees, no per-seat charges
Verdict
Middleware is the strongest option for cloud-native DevOps and SRE teams who want unified observability and AI-driven remediation without managing multiple tools. OTel-native ingestion, predictable GB-based pricing, and OpsAI’s automated RCA-to-PR workflow put it in a separate category from platforms that only surface problems.
2. Grafana LGTM Stack
Best for: Platform engineering teams who want full open-source control with zero vendor lock-in
The Grafana observability stack – Loki, Grafana, Tempo, and Mimir, commonly called LGTM – is the most widely deployed open-source observability platform for Kubernetes-native environments. Grafana Labs surpassed $400M ARR with more than 7,000 customers as of late 2025 and was recognized as a Gartner Magic Quadrant Leader. Each component handles one signal type: Loki for logs, Tempo for traces, Mimir or Prometheus for metrics, and Grafana for unified dashboards and alerting.
Key features
- Tempo: OTel-native trace storage with TraceQL for span-level querying
- Loki: log aggregation with LogQL, designed for low-cost storage at scale
- Mimir: horizontally scalable Prometheus-compatible metrics backend with PromQL
- Grafana Alloy: OTel Collector distribution with built-in pipelines replacing the legacy Grafana Agent
- Adaptive Metrics on Grafana Cloud to automatically reduce metric cardinality and cost
- 600+ data source plugins including external databases, cloud services, and SaaS tools
- Grafana Cloud IRM for incident management (replaced Grafana OnCall OSS which was archived March 2026)
OpenTelemetry support
All four LGTM components accept OTLP directly. Tempo is purpose-built around the OTel trace model – spans land without translation. Grafana Alloy is a full OTel Collector distribution so you can use the same Collector config across the entire stack. PromQL, LogQL, and TraceQL are all open query languages.
What’s good
- Zero vendor lock-in. Your dashboards use Grafana’s open JSON format. Your queries use PromQL and LogQL. Your traces use the OTel model. If you leave, you take all of it.
- Grafana Cloud free tier covers real workloads: 10,000 active metric series, 50 GB each of logs, traces, and profiles, 500 VUh k6 testing, 3 users, no credit card required.
- Grafana Cloud Pro starts at $19/month – significantly below the minimum spend threshold on Datadog, Dynatrace, or Splunk.
- The plugin ecosystem is the largest in observability. If a data source exists, there is almost certainly a Grafana plugin for it.
The catch
- Self-hosting LGTM means operating four services plus object storage (S3 or equivalent). That is a real ongoing cost in engineering time, not just infrastructure spend.
- Cross-signal correlation – jumping from a metric spike to its correlated trace – requires explicit query work. Unified platforms surface these connections automatically.
- Grafana OnCall OSS was archived in March 2026. Teams on the self-hosted path now have no official open-source incident management option from Grafana Labs.
Pricing
- OSS: Free under AGPLv3 (infrastructure costs apply)
- Grafana Cloud Free: 10,000 active metric series, 50 GB logs, 50 GB traces, 50 GB profiles, 500 VUh k6 load testing, 3 users, 14-day retention – no credit card required
- Grafana Cloud Pro: From $19/month platform fee; metrics at $8/1,000 active series, logs/traces/profiles at $0.50/GB written after the free 50 GB; 13-month metric retention, 30-day log and trace retention
- Enterprise: Annual commit starting at $25,000/year with volume discounts, custom retention, premium support, and deployment flexibility
Verdict
If open standards and no lock-in are non-negotiable, LGTM is the answer. It is operationally demanding to self-host but Grafana Cloud removes that burden at a reasonable price. Teams that want cross-signal correlation handled automatically will find the manual query work frustrating.
3. Datadog
Best for: Large enterprises that need the broadest technology coverage and can absorb premium pricing
Datadog is the market-defining commercial observability platform. It surpassed 1,000 integrations – a milestone covering infrastructure, cloud services, security platforms, SaaS applications, and AI tooling, including NVIDIA GPU monitoring, OpenAI, Anthropic, and vector databases like Weaviate. Datadog generated $3.43 billion in revenue in FY2025, serving more than 32,700 customers. For enterprise teams with a budget to match, Datadog is often the default choice.
Key features
- 1,000+ integrations including NVIDIA GPU monitoring, OpenAI, Anthropic, Weaviate, and the full major cloud provider catalog
- APM with distributed tracing, continuous profiler, and service dependency maps
- Infrastructure monitoring covering hosts, containers, Kubernetes, serverless, and network performance
- SIEM and Cloud Security Posture Management
- RUM with session replay and Core Web Vitals
- LLM Observability for AI application monitoring added 2025
- Watchdog AI for automated anomaly detection across the platform
OpenTelemetry support
OTLP is accepted via the Datadog Agent or a direct OTLP endpoint. Data is remapped into Datadog’s schema on arrival. OTel attributes that do not have a Datadog equivalent may be dropped or stored in a generic field. The platform is built around Datadog’s own agents and SDKs; OTel is an additional ingestion path, not the foundation.
What’s good
- 1,000+ integrations means you rarely encounter a technology that Datadog does not already monitor.
- Strong compliance certifications across SOC 2, HIPAA, FedRAMP, and PCI DSS – relevant for regulated industries.
- Watchdog flags anomalies across the platform automatically, without requiring teams to define thresholds for every service.
- The UI and documentation quality are consistently high. New team members get productive quickly.
The catch
- Per-host billing for infrastructure and APM means that Kubernetes autoscaling events generate unpredictable costs. A traffic spike that creates 50 additional pods can add meaningful dollars to a monthly bill.
- Log pricing has three dimensions: ingestion ($0.10/GB), indexing ($1.70/million events), and retention. Teams who log verbosely pay at every layer.
- Even when you instrument with OTel SDKs, your queries, dashboards, and alerts are written in Datadog’s proprietary query language. The instrumentation is portable; the observability investment is not.
Pricing
- Infrastructure Monitoring Pro: $15/host/month (billed annually)
- APM Pro: $31/host/month (billed annually)
- Log Management: $0.10/GB ingested, plus $1.70/million log events indexed (retention fees apply)
- Free tier: Up to 5 hosts with 1-day metric retention
- Enterprise: Custom pricing with negotiated rates; large deployments typically run six to seven figures annually
Verdict
Datadog is the right choice when breadth of coverage is the top priority and budget is not a constraint. If you are adopting OpenTelemetry specifically to reduce vendor lock-in, Datadog somewhat undermines that goal – your instrumentation becomes portable, but everything else stays proprietary.
4. New Relic
Best for: Mid-market teams who want full-stack observability on a consumption model without per-host charges
New Relic restructured its pricing model several years ago to eliminate per-host charges, moving to a model based on data ingested and user seats. This was a deliberate counter-positioning against Datadog, where autoscaling costs are unpredictable. The result is a full-stack observability platform – APM, infrastructure, logs, RUM, synthetics – where your bill scales with data volume, not with the number of pods your cluster spins up.
Like Datadog, New Relic accepts OTLP but is not OTel-native. Data is stored in NRDB (New Relic Database) and queried with NRQL, a proprietary language. The OTel data model does not persist through ingestion.
Key features
- NRDB: single database for all telemetry types – query metrics, events, logs, and traces with one language
- APM covering server-side, browser, and mobile in the same platform
- Infrastructure monitoring with no per-host charge
- LLM observability and AI monitoring added in 2025
- New Relic AI (NRAI) for natural language queries and anomaly explanation
- 500+ integrations
- Distributed tracing with infinite tracing and tail-based sampling
OpenTelemetry support
New Relic accepts OTLP for all three signal types. The data is mapped into NRDB on arrival. NRQL is the only query interface for stored data. You can send OTel traces and they will show up in New Relic’s trace UI, but you are querying a proprietary representation, not the original OTel model. Switching backends later means keeping the instrumentation but losing the dashboards.
What’s good
- No per-host charges. A 100-pod Kubernetes environment and a 10-pod one at the same data volume pay the same.
- 100 GB/month free with one full user – enough for a real engineering team to evaluate the platform, not just run a demo.
- Browser and mobile APM in the same platform as server-side APM. End-to-end visibility from a frontend click to the backend database query is genuinely unified.
- Infinite tracing with tail-based sampling keeps the most interesting traces regardless of volume, without requiring you to decide sampling rates upfront.
The catch
- The Standard plan caps at 5 full users at $99/user/month. The moment you need a 6th full user, you move to Pro at $349/user/month – a steep jump that catches growing teams off guard.
- NRQL is powerful but proprietary. If your team becomes fluent in NRQL, that skill does not transfer to any other platform.
- SaaS only. Teams with data residency requirements have no self-hosted path.
Pricing
- Free: 100 GB/month, 1 full user, unlimited basic users
- Standard: $99/user/month (up to 5 full users); data ingestion at $0.30/GB (Original) or $0.50/GB (Data Plus with 90-day retention)
- Pro: $349/user/month (annual) or $418.80/month (monthly); same per-GB data rates
- Enterprise: Custom pricing. Volume discounts of 15–30% are common above 1 TB/month
- Core users: $49/user/month across all paid tiers
Verdict
New Relic solves the Datadog autoscaling billing problem cleanly. The practical danger is the full-user pricing cliff – map out your team’s access needs before signing up for Pro, because the jump from Standard is significant and often discovered too late.
5. Dynatrace
Best for: Large enterprises running complex multi-cloud environments where AI-driven auto-discovery justifies premium pricing
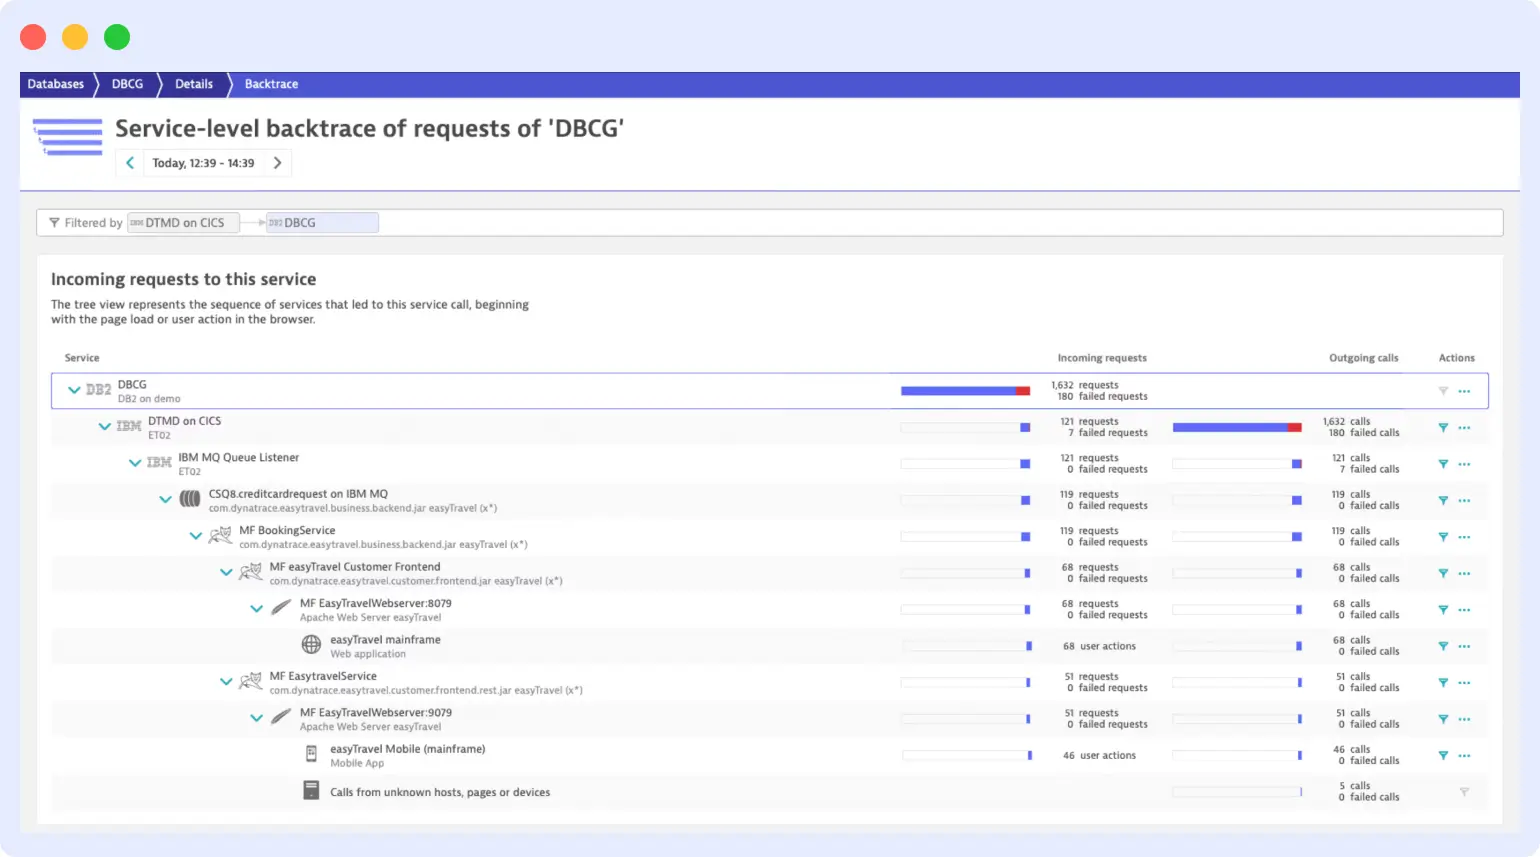
Dynatrace built its platform around a fundamentally different idea than most observability tools: instead of asking you to configure what to monitor, it discovers everything automatically. OneAgent – a single host agent – instruments all processes, maps all dependencies, and builds a real-time topology model called Smartscape. Davis AI has been running on top of this topology since 2018, longer than any comparable AI engine in the market.
The result is that Dynatrace catches things other tools miss, particularly cascading failures where the root cause is several hops away from the symptom. The tradeoff is cost, complexity, and the fact that OTel is a secondary ingestion path – the platform was designed around OneAgent, not around the OTel data model.
Key features
- Davis AI: causal AI engine for automated root cause analysis and anomaly detection, investing in this area since 2018
- OneAgent: single deployment for full-stack auto-instrumentation and auto-discovery
- Smartscape: real-time topology map showing dependencies across services, processes, hosts, and containers
- Grail data lakehouse: unified storage for logs, metrics, and traces
- OpenPipeline: ingestion and processing layer for OTel and third-party data
- DQL (Dynatrace Query Language) for cross-signal querying via Grail
- 600+ technologies supported across on-premises, cloud, and Kubernetes
- Unlimited user seats at no additional cost – billing is infrastructure-based, not seat-based
OpenTelemetry support
Dynatrace accepts OTLP via OpenPipeline for all three signals. OTel traces, metrics, and logs appear in the platform alongside OneAgent data. However, Davis AI’s topology-aware RCA depends on the entity model that OneAgent builds. OTel data goes into Grail but does not automatically populate Smartscape. If you go fully OTel without OneAgent, you get the storage and query capability but lose the automatic topology context that makes Davis AI distinctive.
What’s good
- Davis AI has been doing topology-aware RCA longer than any competitor. When a payment service fails because a shared database connection pool was exhausted by a background job, Davis finds that – not by alerting on everything, but by tracing the causal chain.
- Unlimited user seats. Growing engineering teams do not trigger cost increases, unlike New Relic and Datadog.
- OneAgent removes the instrumentation burden for heterogeneous environments where you cannot standardize on OTel across every service.
- Compliance coverage is comprehensive: SOC 2, ISO 27001, FedRAMP, HIPAA, PCI DSS.
The catch
- Pricing is multi-dimensional and hard to predict. You pay separately for Full-Stack Monitoring ($0.01/GiB-hour), log ingestion ($0.20/GiB), Davis AI ($3.60/host/month), RUM sessions, synthetic actions, and security features. A 100-host environment at 8 GiB average will spend roughly $5,840/month on FSM alone before logs or AI.
- DQL is a powerful but proprietary query language. Investment in Dynatrace dashboards and automation does not transfer to other platforms.
- No permanent free tier. Only a 15-day trial. You need a sales conversation before seeing real costs for your environment.
- OTel-only deployments lose Smartscape context, which limits how much of Davis AI’s RCA capability you actually get.
Pricing
- Infrastructure Monitoring: ~$21/host/month (per 8 GiB host, annually)
- Full-Stack Monitoring: $0.01/GiB-hour (approximately $58/host/month for an 8 GiB host at list price)
- Log ingest: $0.20/GiB ingested
- Digital Experience Monitoring: starts at $11/month (annually)
- Davis AI: $3.60/host/month additional on top of observability spend
- Median enterprise annual contract: $182,883 based on third-party transaction data; multi-year commits typically reduce list prices by 20–40%
Verdict
Dynatrace is worth the cost for large enterprises where the complexity of the environment makes manual root cause analysis genuinely slow and expensive. Below roughly 100 hosts, the per-unit costs become hard to justify against alternatives.
6. Splunk Observability Cloud
Best for: Organizations already in the Splunk ecosystem or those requiring combined SIEM and observability from one vendor
Splunk Observability Cloud – which absorbed SignalFx and AppDynamics capabilities – is Cisco’s enterprise observability platform. Splunk holds approximately 63% market share in SIEM, making it dominant for organizations that want observability and security investigations to share the same data pipeline. The Cisco acquisition continues to consolidate the product portfolio in 2026.
Key features
- Infrastructure monitoring powered by SignalFlow – a streaming analytics engine built for real-time metric processing
- APM with distributed tracing and AlwaysOn Profiling for continuous CPU and memory analysis
- Log Observer for log correlation with traces and metrics
- RUM and synthetic monitoring
- Splunk OTel Collector: an actively maintained OTel Collector distribution with Splunk-specific processors
- Direct OTLP ingestion – Splunk committed to OTel as the primary collection mechanism
- Splunk Enterprise Security integration for cross-domain incident investigation
OpenTelemetry support
Splunk contributed its APM Java and Python agents to the OTel project and maintains its own Collector distribution. OTLP is the recommended ingestion path for Splunk Observability Cloud – this is a genuine architectural decision, not a marketing claim. Splunk’s OTel Collector distribution includes processors that enrich spans with Splunk-specific metadata before forwarding.
What’s good
- SIEM plus observability in one vendor relationship. When a security event and a service outage are related, you investigate without switching tools.
- SignalFlow handles streaming metric analytics at a scale that most observability platforms handle through pre-aggregation. You get real-time alerting on full-resolution data.
- Splunk’s OTel Collector distribution is actively maintained and well-documented – lower setup friction for OTel deployments than most enterprise platforms.
The catch
- No public pricing. Every deployment requires a sales conversation. This makes it impossible to budget without a formal quote and creates friction for teams that want to try before they buy.
- The Cisco acquisition has added organizational complexity. Customers report slower roadmap execution and more friction navigating licensing across the combined product portfolio.
- For teams that do not already use Splunk for security, the primary differentiator disappears. At that point you are paying enterprise prices for observability capabilities that competitors deliver for less.
Pricing
- Custom enterprise pricing – no public rates available
- Pricing is host-based and data-volume-based across multiple product SKUs
- Production enterprise contracts typically run six figures and above
Verdict
If you run Splunk Enterprise Security, adding Observability Cloud unlocks cross-domain correlation that no other tool on this list provides. If you do not, evaluate Middleware, Grafana, or New Relic first – the cost premium is hard to justify for observability alone.
7. Elastic Observability
Best for: Teams with existing Elastic Stack deployments or workloads with heavy unstructured log analysis requirements
Elastic Observability sits on top of Elasticsearch and covers logs, APM traces, infrastructure metrics, RUM, synthetics, and continuous profiling. Elasticsearch’s full-text search engine is the reason people pick Elastic for observability – if your logs are messy, inconsistently structured, or contain free-form error messages you need to search across, Elasticsearch handles that better than any other backend on this list. Elastic contributed its Universal Profiling agent to the OpenTelemetry project in 2024, one of the more significant enterprise upstream OTel contributions.
Key features
- Elasticsearch full-text and structured log search – handles unstructured log data that other platforms struggle with
- APM with distributed tracing, service maps, and span-level analysis
- Infrastructure monitoring for hosts, Kubernetes, and cloud services
- Universal Profiling: continuous code-level profiling now contributed to the OTel project
- ESQL: a modern SQL-like query language for cross-signal analysis introduced in recent versions
- ML-powered anomaly detection built into the Elastic Stack at no additional cost on self-hosted
- Full data control with self-hosted deployment option
OpenTelemetry support
Elastic is genuinely OTel-native at the data layer. OTLP data lands in Elasticsearch without schema translation. Elastic APM agents now emit OTel-compatible telemetry. The Universal Profiling agent is now an OTel upstream contribution. ESQL provides a portable, SQL-like query interface that is far less proprietary than NRQL or DQL.
What’s good
- Log search quality is unmatched on unstructured data. If your error messages are inconsistent and you need to find all instances of a specific pattern across three months of logs, Elasticsearch does this faster and more flexibly than purpose-built time-series stores.
- Self-hosted deployment option. Your data stays in your infrastructure, which matters for GDPR, HIPAA, and air-gapped environments.
- ESQL reduces the proprietary query language problem. SQL skills transfer.
The catch
- Running Elasticsearch in production is operationally demanding. Shard sizing, index lifecycle management, and cluster scaling require dedicated attention. Teams without Elastic expertise consistently underestimate this.
- The BSL license Elastic introduced in 2021 broke the Apache 2.0 promise. Some teams prefer OpenSearch, which forked at that point and remains Apache-licensed.
- Elastic Cloud starts at $95/month but grows quickly with data volume and retention. Long retention periods on high-volume log workloads can get expensive.
Pricing
- Open source (BSL): Free for self-hosted non-competitive use
- Elastic Cloud Observability: From $95/month; scales with data volume and retention
- Enterprise: Custom pricing with additional security and compliance features
Verdict
Elastic Observability earns its place when Elasticsearch is already in your stack or when log search quality is the deciding factor. For teams starting fresh with a primary need for APM and distributed tracing, you will reach value faster with Middleware, Grafana, or New Relic.
8. Honeycomb
Best for: Engineering teams that debug production issues primarily through distributed trace exploration
Honeycomb was purpose-built for high-cardinality observability before the concept had a name. Founded by Charity Majors and Christine Yen – with roots in database engineering – Honeycomb pioneered sending wide, high-cardinality events rather than pre-aggregated metrics. In March 2026, Honeycomb reached general availability with Honeycomb Metrics, adding native time series metrics to its existing traces and events platform. It remains one of the few SaaS observability platforms that ingests OTLP without any schema translation.
Key features
- Columnar storage engine (Retriever) designed for high-cardinality trace and event data
- Honeycomb Metrics: GA as of March 2026, adding time series metrics with introductory pricing from $2 per 1,000 series/month
- BubbleUp: automatically identifies dimensions that correlate with slow or failing traces
- Query Builder with arbitrary Group By – any attribute combination, no pre-aggregation required
- SLO management with burn rate alerting
- AI Agent Observability with LLM observability and MCP integrations for AI development tools
- OTel-native ingestion – OTLP is the primary path, no schema translation, no attribute loss
OpenTelemetry support
Honeycomb is the SaaS-native OTel platform on this list. OTLP is ingested without any mapping – your OTel attributes arrive exactly as your SDK sends them and are immediately queryable. Honeycomb maintains some of the clearest OTel SDK documentation available.
What’s good
- Group By any attribute combination across millions of spans. Finding that 94% of slow requests come from users on mobile in the EU, running firmware version 3.2.1, is a single query.
- BubbleUp removes the need to know which dimension to investigate first. It compares the distribution of attributes in slow requests against the baseline and shows you what is statistically different.
- No attribute loss on OTLP ingestion. This sounds basic but is not common – most platforms drop, rename, or truncate OTel attributes during ingestion.
The catch
- Infrastructure monitoring is not Honeycomb’s focus. Host metrics, Kubernetes node health, and network monitoring are not what the platform was built for – even with Metrics GA, this remains a traces-first product.
- No self-hosted option. SaaS only.
- Teams that need log management, RUM, synthetic monitoring, and infrastructure monitoring from one tool will need to pair Honeycomb with something else.
Pricing
- Free: 20 million events/month, 60-day retention
- Free: 20 million events/month and 100 million time series data points, 60-day retention, 2 triggers
- Pro: $130 per 100 million events/month (up to 1.5B events); 500 million time series data points (up to 7.5B); 60-day retention
- Metrics add-on: Introductory pricing from $2 per 1,000 time series/month (promotional rate through end of June 2026)
- Enterprise: Custom pricing; base allowance of 10 billion events/year with flexible capacity additions
- No per-user or per-host fees across any tier
Verdict
Honeycomb is the strongest tool on this list for trace-driven debugging of high-cardinality production systems. If your team’s primary debugging workflow is “open a trace, filter by attributes, find the pattern,” nothing else compares. If you need a full-stack platform, Honeycomb works best as a dedicated tracing backend alongside a broader observability tool.
9. Amazon CloudWatch
Best for: AWS-native teams who want OpenTelemetry observability without leaving the AWS ecosystem
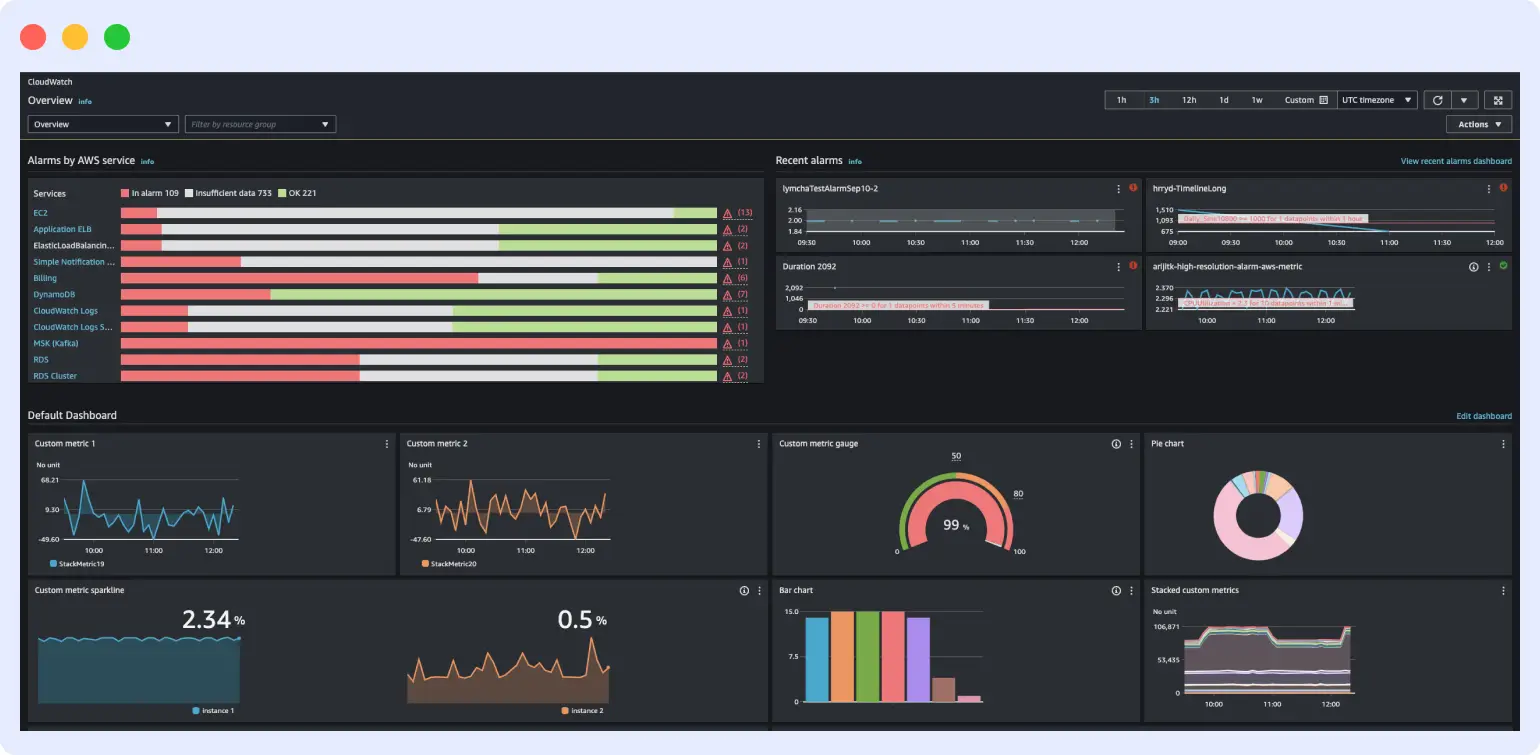
CloudWatch is AWS’s built-in monitoring and observability service. It has existed since 2009, primarily as a metrics and log aggregation tool for AWS services. In April 2026, AWS completed full OpenTelemetry support across all three signals with native OTLP endpoints for metrics (public preview), traces, and logs. It also launched OTel Container Insights for EKS and added PromQL to CloudWatch Query Studio.
This is significant because AWS simultaneously put its X-Ray SDKs into maintenance mode in February 2026, with end-of-support in February 2027. AWS is officially migrating its own tracing infrastructure to OpenTelemetry. AWS Distro for OpenTelemetry (ADOT) is the recommended OTel Collector distribution for AWS workloads.
Key features
- Native OTLP ingestion for traces and logs (stable) and metrics (public preview as of April 2026)
- PromQL support in CloudWatch Query Studio for metric queries
- OTel Container Insights for EKS: enriched Kubernetes metrics with up to 150 custom labels
- ADOT: AWS-managed OTel Collector distribution with pre-built pipelines for EKS, ECS, Lambda, and EC2
- CloudWatch Application Signals: SLO tracking for OTel-instrumented services
- Cross-account and cross-region observability from a single dashboard
- Native integration with Amazon Managed Grafana and Amazon Managed Service for Prometheus
OpenTelemetry support
CloudWatch’s new high-cardinality metrics store retains OTel metric types – counters, histograms, gauges, and up-down counters – without conversion. It supports up to 150 labels per metric versus the 30-dimension limit on standard CloudWatch custom metrics. ADOT is the recommended path for all new AWS workloads. The OTLP metrics endpoint is in public preview; traces and logs have had OTLP endpoints longer.
What’s good
- No new vendor, no new billing relationship, no new access controls. For AWS teams, CloudWatch charges go through existing AWS accounts and budget structures.
- Deep integration with 70+ AWS services that emit metrics and logs to CloudWatch automatically without any configuration.
- ADOT instrumentation is portable. Teams that later want to move to Middleware, Grafana, or another OTLP backend do not re-instrument – they update the Collector exporter.
- OTel Container Insights for EKS with PromQL is a meaningful improvement over the previous Container Insights experience.
The catch
- OTLP metrics support is in public preview as of June 2026, not GA. Running preview features in production carries risk.
- CloudWatch billing has more dimensions than almost any other tool on this list. Log ingestion, log storage, log query scans (Logs Insights), custom metrics, dashboards, and API calls each bill separately. Uncontrolled Logs Insights queries against large log groups are the most common source of unexpected bills.
- AWS-only. CloudWatch is not useful for monitoring workloads running on GCP, Azure, or on-premises infrastructure.
- AIOps features detect anomalies but do not take remediation actions.
Pricing
- Custom metrics: $0.30/metric/month for the first 10,000, then $0.10, $0.05, and $0.02 at higher tiers
- Log ingestion: $0.50/GB ingested; $0.03/GB/month for storage
- Logs Insights queries: $0.005 per GB of log data scanned
- Dashboards: 3 free; $3/dashboard/month beyond that
- OTLP metrics (preview): No additional cost during preview in the initial available regions
- Free tier: 10 custom metrics, 5 GB log ingestion, 3 dashboards, and basic alarms monthly
Verdict
The right default for AWS-only teams who want to avoid adding a vendor. ADOT instrumentation is portable so you are not locked in even if you later decide to move to a dedicated observability platform. The multi-dimensional billing model requires active management – unchecked Logs Insights usage against large log groups will surprise you.
10. Uptrace
Best for: Small teams and startups that want lightweight OTel-native APM at low cost
Uptrace is an open-source observability platform built on ClickHouse. It was designed with a single constraint: OTLP is the only ingestion path. There are no proprietary SDKs, no agents to deploy, no schema translation on arrival. If you have already instrumented with OTel SDKs, pointing your Collector at Uptrace and getting traces, metrics, and logs in a clean UI takes minutes. Available as open-source self-hosted or Uptrace Cloud.
Key features
- Native OTLP ingestion for traces, metrics, and logs – the only ingestion path
- ClickHouse as the storage backend for fast aggregation on high-cardinality data
- Pre-built dashboards for common OTel-instrumented frameworks and runtimes
- Alerting via Slack, PagerDuty, and webhooks
- Service graphs and span-level trace exploration
- Available as open-source self-hosted or Uptrace Cloud managed SaaS
OpenTelemetry support
Uptrace was built entirely around OpenTelemetry. OTLP is the only ingestion path – there is no proprietary agent. What your SDK sends is exactly what you query, with no intermediate translation layer.
What’s good
- Setup is fast if you already have OTel instrumentation. Update the Collector exporter, restart, done.
- ClickHouse makes trace queries on high-cardinality data noticeably faster than platforms backed by traditional time-series databases.
- No per-host or per-seat charges.
- Self-hosted option puts all data in your own infrastructure.
The catch
- Uptrace covers APM and tracing well. It does not cover infrastructure monitoring, RUM, or synthetic monitoring. Teams that need those signals need additional tools.
- Self-hosting means managing both ClickHouse and Uptrace. ClickHouse is operationally straightforward but it is still another component to run.
- The community is smaller than Grafana or SigNoz, which means fewer third-party guides and integrations.
Pricing
- Open source: Free (self-hosted; infrastructure costs apply)
- Uptrace Cloud: Usage-based per GB ingested – no per-host or per-user fees; contact for current per-GB rate
Verdict
A solid choice for small teams who are already on OTel and want a simple, fast APM backend without paying for features they do not use. If your needs expand to infrastructure monitoring or RUM, you will outgrow it and need to migrate or add additional tooling.
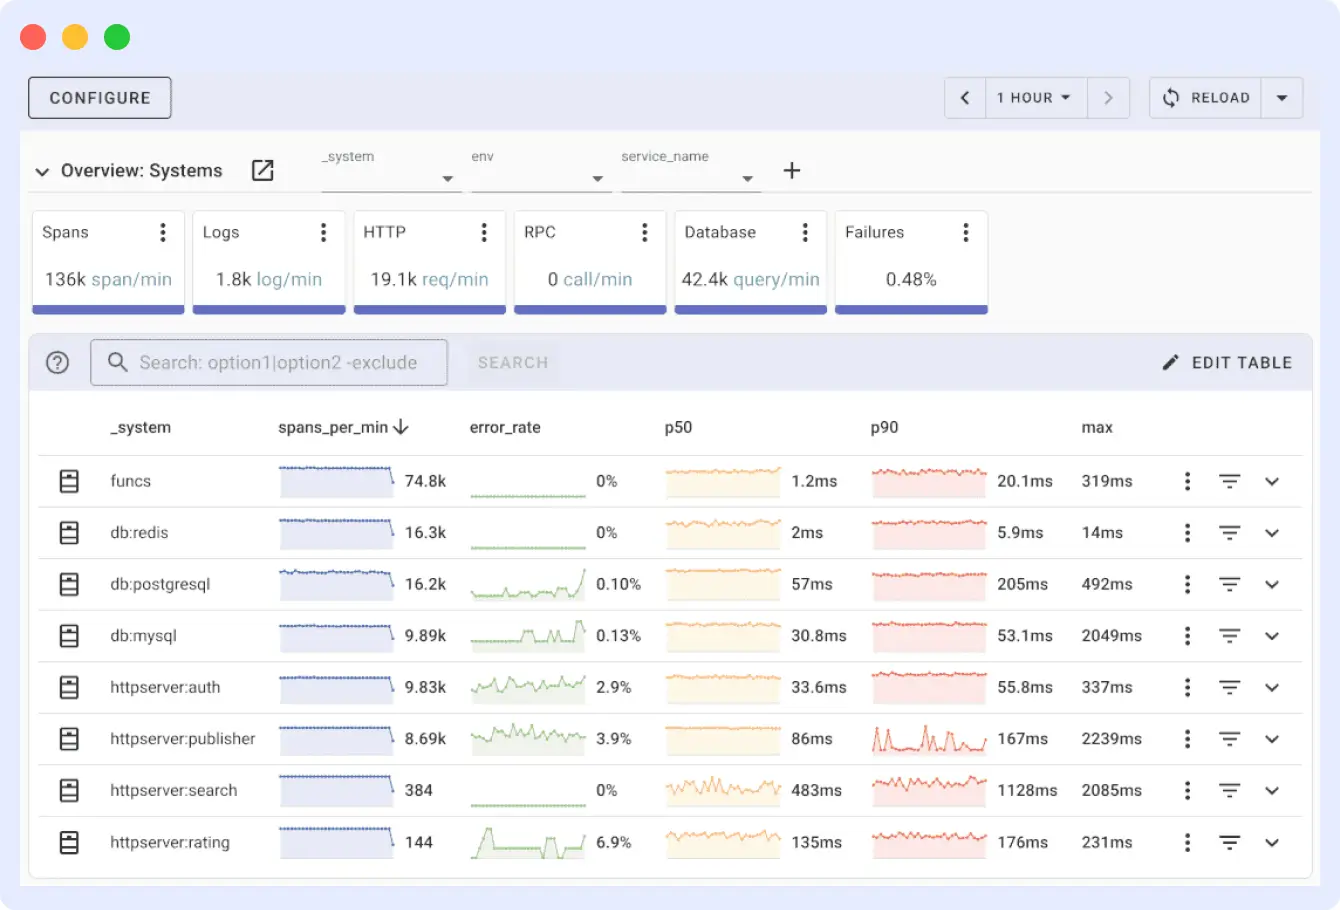
11. SigNoz
Best for: Teams wanting a full-signal open-source observability platform with self-hosted data control
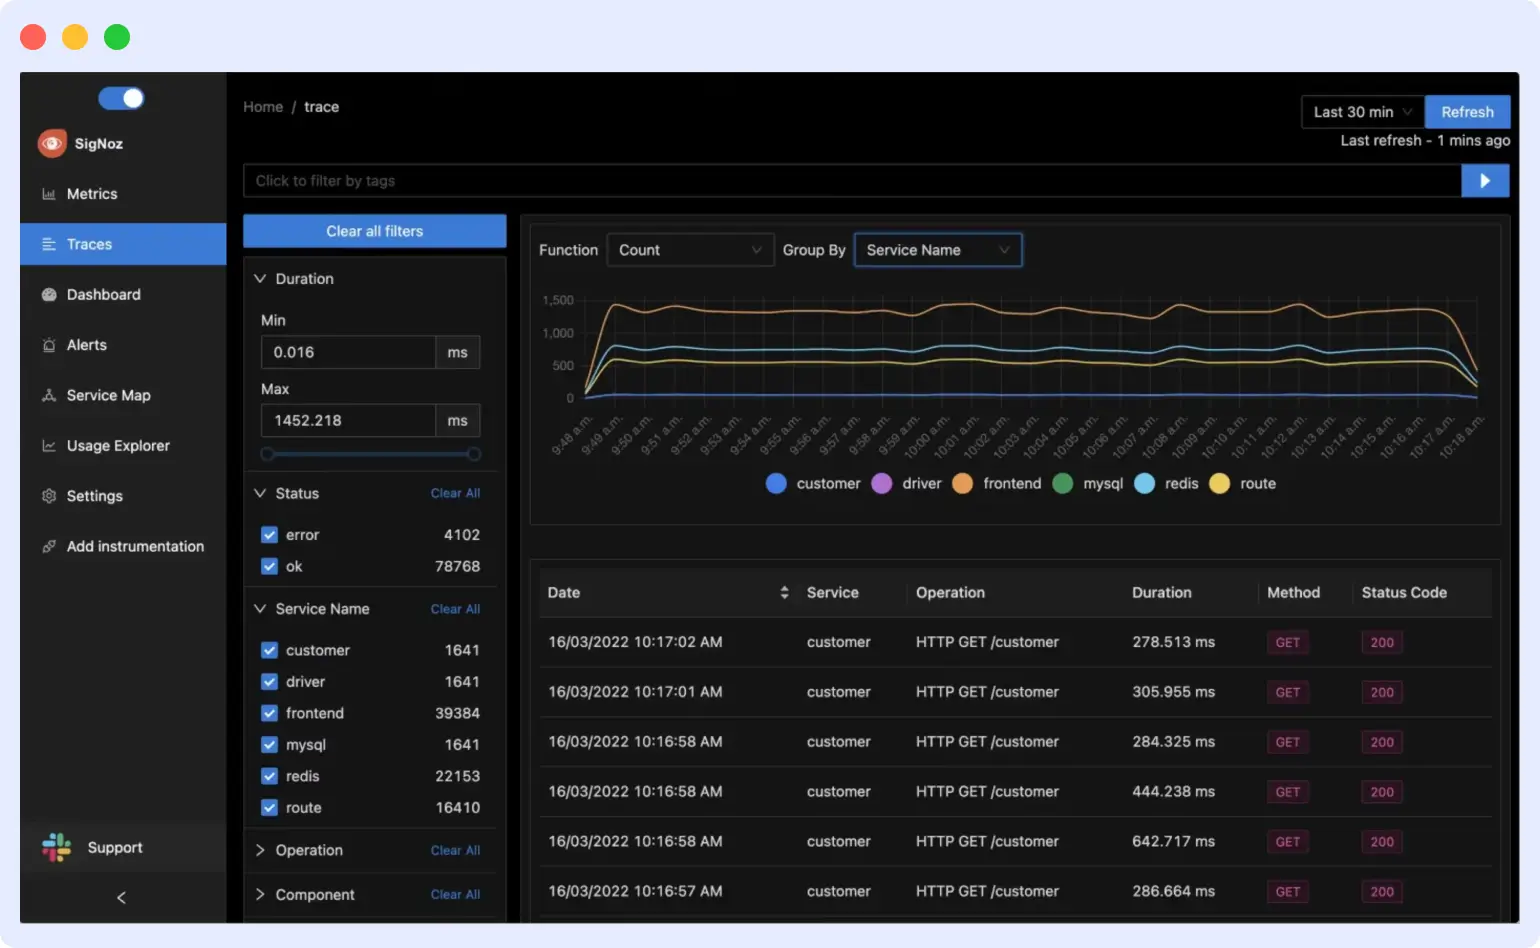
SigNoz is an open-source, OpenTelemetry-native observability platform that positions itself as the open alternative to Datadog. It uses ClickHouse as its storage backend and provides a unified interface for metrics, traces, and logs. SigNoz is a CNCF Sandbox project with a growing contributor base and is available as a self-hosted community edition or a managed SaaS.
Key features
- Unified metrics, traces, and logs in one interface
- Native OTLP ingestion – no proprietary agents
- ClickHouse backend for fast high-cardinality queries
- APM with service health, latency percentiles, and error rate tracking
- Distributed tracing with flame graphs and span-level attribute exploration
- Alerts via Slack, PagerDuty, and OpsGenie
- Available as community OSS or SigNoz Cloud managed SaaS
OpenTelemetry support
SigNoz is one of the strongest OTel-native platforms available. OTLP is the only ingestion path. The project contributes to the OTel ecosystem and its instrumentation documentation is consistently cited as among the clearest in open-source observability.
What’s good
- Unified metrics, traces, and logs in one self-hosted platform
- Modern UI that teams migrating from Datadog find immediately familiar
- Self-hosted option satisfies GDPR, HIPAA, and internal data residency policies
- SigNoz Cloud pricing at $0.30/GB is competitive with Middleware and far below Datadog and New Relic at volume
- CNCF Sandbox project status signals community backing and vendor-neutral governance
The catch
- Self-hosting requires managing ClickHouse and SigNoz services – teams without platform engineering resources should consider SigNoz Cloud instead
- No RUM, no synthetic monitoring, and no AI remediation in either the OSS or Cloud tiers
- Integration ecosystem is smaller than enterprise platforms
Pricing
- Community (self-hosted): Free under MIT license
- SigNoz Cloud: $0.30/GB for traces, metrics, and logs; $0.50/GB for logs with 90-day retention
- No per-seat or per-host fees on either tier
Verdict
SigNoz is the strongest option if self-hosted data control and a unified three-signal interface are the requirements. SigNoz Cloud at $0.30/GB competes directly with Middleware on price. The gap versus full-stack commercial platforms is RUM, synthetics, and AI remediation.
12. Prometheus + Jaeger (open-source stack)
Best for: Teams who want a zero-cost, battle-tested foundation for metrics and tracing in Kubernetes environments
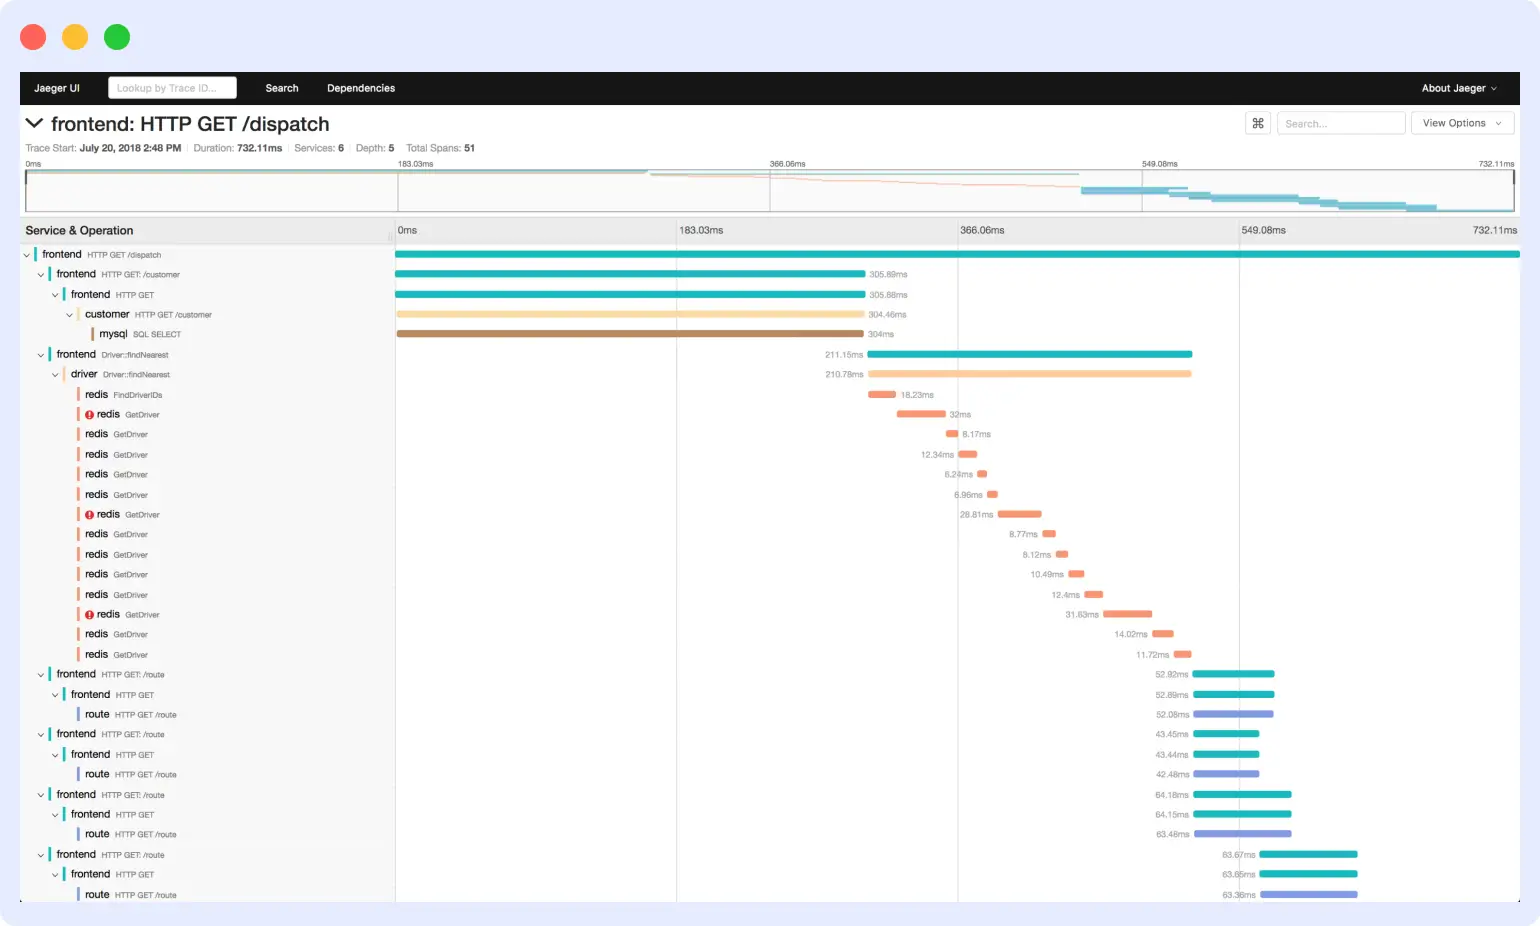
Prometheus is the CNCF Graduated standard for Kubernetes metrics. It scrapes metrics endpoints on a pull model, stores them as time series, and queries them with PromQL. Virtually every Kubernetes component, cloud service, and open-source application ships a Prometheus metrics endpoint. Jaeger was developed at Uber and donated to CNCF as the reference distributed tracing implementation. Together with Grafana for dashboards, these three tools form the most widely deployed open-source observability stack in production.
Both have solid OTel integration. The OTel Collector can scrape Prometheus metrics and forward OTLP traces to Jaeger. Jaeger now accepts OTLP directly without the legacy Thrift agents. The combination is the standard starting point for teams building toward a more managed solution.
Key features
- Prometheus: Multi-dimensional time-series metrics, PromQL, Alertmanager, and native Kubernetes service discovery
- Jaeger: Distributed tracing with span-level visualization, dependency graphs, and multiple storage backends including Cassandra, Elasticsearch, and ClickHouse
- Both are CNCF Graduated projects – proven in production at hyperscale
- OTel Collector integrates natively with both: OTLP to Prometheus Remote Write and OTLP to Jaeger are standard pipelines
- Jaeger has native OTLP support – you can send OTel traces directly without the legacy Thrift or gRPC Jaeger agents
OpenTelemetry support
Both tools have solid OTel integration. The OTel Collector can scrape Prometheus metrics, receive OTLP traces and forward them to Jaeger, and handle log pipelines. The combination is the standard OTel pipeline foundation for teams building toward a managed platform.
What’s good
- Zero licensing cost – infrastructure is the only spend
- PromQL is the most widely known observability query language – no learning curve for most SRE teams
- Prometheus has the largest exporter ecosystem – nearly every infrastructure component has a Prometheus exporter
- No data leaves your infrastructure
The catch
- Prometheus struggles with high-cardinality metrics at scale – cardinality management is an ongoing operational discipline
- No unified interface – Grafana dashboards, Prometheus Alertmanager, and a separate Jaeger UI require context-switching during incidents
- No log management built in – Loki or another aggregation solution is required for the full signal set
- No RUM, no synthetic monitoring, no AI remediation
- High-availability Prometheus, Thanos or Cortex for long-term storage, and sharding strategies add significant operational surface area at scale
Pricing
- Prometheus: Free (Apache 2.0)
- Jaeger: Free (Apache 2.0)
- Infrastructure costs vary by deployment scale and storage backend
Verdict
The right starting point for teams with platform engineering resources and a zero-licensing-cost requirement. OTel-instrumented services can migrate to any managed backend later by updating the Collector exporter – nothing else changes. Teams that hit cardinality limits or operational overhead frequently move to Grafana Cloud, Middleware, or SigNoz Cloud.
How to pick the right OpenTelemetry tool
Run through these four questions in order:
Which signals do you need in one place?
Traces only: Honeycomb or Jaeger are sufficient and purpose-built.
Metrics, traces, and logs together: Middleware, Grafana LGTM, New Relic, Datadog, or SigNoz.
Add RUM and synthetic monitoring: Middleware, Datadog, New Relic, or Elastic.
If you are not sure, start with a unified platform – splitting signals across tools is harder to undo later than combining them.
Can data leave your infrastructure?
If the answer is no – due to HIPAA, GDPR, FedRAMP, or internal policy – your options are: Grafana LGTM, Elastic, SigNoz, Uptrace, Prometheus, and Jaeger. All others are SaaS-only. Dynatrace has a managed option that can run in your VPC but is not fully self-hosted.
What is your realistic monthly spend ceiling?
Zero licensing cost: Prometheus and Grafana OSS, or SigNoz OSS. Under $50/month managed: Grafana Cloud Pro. Predictable per-GB SaaS: Middleware and SigNoz Cloud at $0.30/GB. No per-host charges: New Relic, Middleware, SigNoz Cloud. Per-host acceptable: Datadog, Dynatrace, parts of Splunk. Enterprise budget required: Dynatrace, Splunk.
Do you need the platform to fix things, or only to show them?
If your team is on-call and you want to reduce the number of incidents that require human intervention, the options narrow significantly. Middleware OpsAI is the only platform that has first-party access to all five signal types and generates fix PRs automatically. Dynatrace Davis AI is the strongest option for automated root cause analysis at enterprise scale without code-level remediation. Everything else alerts, summarizes, or explains – but does not act.
Start monitoring with Middleware – free for 14 days
Middleware gives you OpenTelemetry-native observability across metrics, traces, logs, RUM, and Kubernetes in one platform. OpsAI detects issues, performs root cause analysis, and generates fix PRs automatically. No per-host fees, no proprietary agents required.
FAQs
What is OpenTelemetry?
OpenTelemetry is a CNCF vendor-neutral standard for collecting observability data. It provides language SDKs for instrumentation, the OTel Collector for processing and routing, and OTLP as the wire protocol for delivery. Traces and metrics specifications reached stable status in 2023, logs in 2024. It is now the default instrumentation standard in cloud-native engineering.
What is the difference between OTel-native and OTel-compatible?
OTel-native means the platform stores data in the OTel data model as it arrives – attributes intact, no translation. OTel-compatible means OTLP is accepted but the data is converted into a proprietary internal schema. The practical difference: native platforms return exactly what your SDK sent when you query; compatible platforms may drop, rename, or merge attributes depending on how the schema mapping was written.
Do I need the OTel Collector?
No, but you should use it in production. SDKs can export OTLP directly to a backend endpoint. The Collector adds sampling, filtering, attribute enrichment, and the ability to fan out to multiple backends from a single pipeline without touching application code. Most production OTel deployments include one.
Which OpenTelemetry tool is best for Kubernetes?
Middleware covers Kubernetes natively with node, pod, and namespace dashboards and OpsAI Auto Fix for OOMKilled and CrashLoopBackOff failures. Grafana with kube-prometheus-stack is the standard open-source approach. Datadog and Dynatrace both offer Kubernetes auto-discovery. Amazon CloudWatch with OTel Container Insights is the right choice for EKS-only environments.
What is the most cost-predictable OpenTelemetry backend?
Per-GB models with no per-host or per-seat dimensions are the most predictable for autoscaling environments. Middleware and SigNoz Cloud charge $0.30/GB flat. Grafana Cloud’s free tier is the most generous starting point in managed SaaS. Per-host models from Datadog and Dynatrace produce unpredictable bills when Kubernetes pods scale during traffic events.