Real User Monitoring (RUM) tools collect real-time data from actual user sessions to measure application performance, interactions, and errors across browsers, devices, and networks.
RUM provide visibility into page load speed, Core Web Vitals, network conditions, and frontend issues across different devices, browsers, and locations revealing performance gaps that are not visible in backend monitoring or test environments.
This guide compares the top 8 Real User Monitoring (RUM) tools, their features, pricing models, and use cases to help identify the right solution for different observability needs.
Related Read: Guide to understanding What is Real User Monitoring
How Do Top RUM Tools Compare?
Real User Monitoring tools differ based on how deeply they capture user experience, correlate frontend with backend systems, and scale with application complexity.
Below is a side-by-side comparison of widely used real user monitoring tools based on core capabilities.
| Tools | Session Replay | Core Web Vitals | Backend Correlation | Pricing Model | Best For |
| Middleware | Yes | Yes | Strong | Usage-based | Full-stack observability and RUM in one platform |
| Raygun | Limited | Yes | Moderate | Subscription-based | Frontend performance and error tracking |
| Datadog | Yes | Yes | Strong | Usage-based | Enterprise teams in the Datadog ecosystem |
| Sentry | Yes | Yes | Moderate | Usage-based | Teams focused on error tracking and performance |
| New Relic | Yes | Yes | Strong | Usage-based | Full-stack monitoring with strong frontend and backend correlation |
| Elastic RUM | Limited | Yes | Strong | Usage-based | Teams already on the Elastic Stack who want open-source flexibility |
| Speedcurve | Limited | Yes | Limited | Subscription-based | Frontend performance and Core Web Vitals |
| Pingdom | No | Yes | Limited | Subscription-based | Uptime monitoring and RUM combined |
What This Comparison Shows
- Session Replay helps visualize user behavior and identify UX issues.
- Core Web Vitals support is standard across most tools for performance measurement.
- Backend correlation is the key differentiator for debugging complex issues.
- Pricing models vary between usage-based (scales with data) and subscription-based (predictable but limited).
Each tool takes a different approach:
- A few are optimized for specific ecosystems or use cases (e.g., Elastic RUM, Pingdom)
- Some tools focus primarily on frontend performance and user behavior (e.g., SpeedCurve, Raygun)
- Others provide full-stack observability with backend correlation (e.g., Middleware, Datadog, New Relic)
RUM tools mainly differ in three areas session visibility, backend correlation, and pricing model making tool selection dependent on how deeply performance needs to be analyzed.
1. Middleware
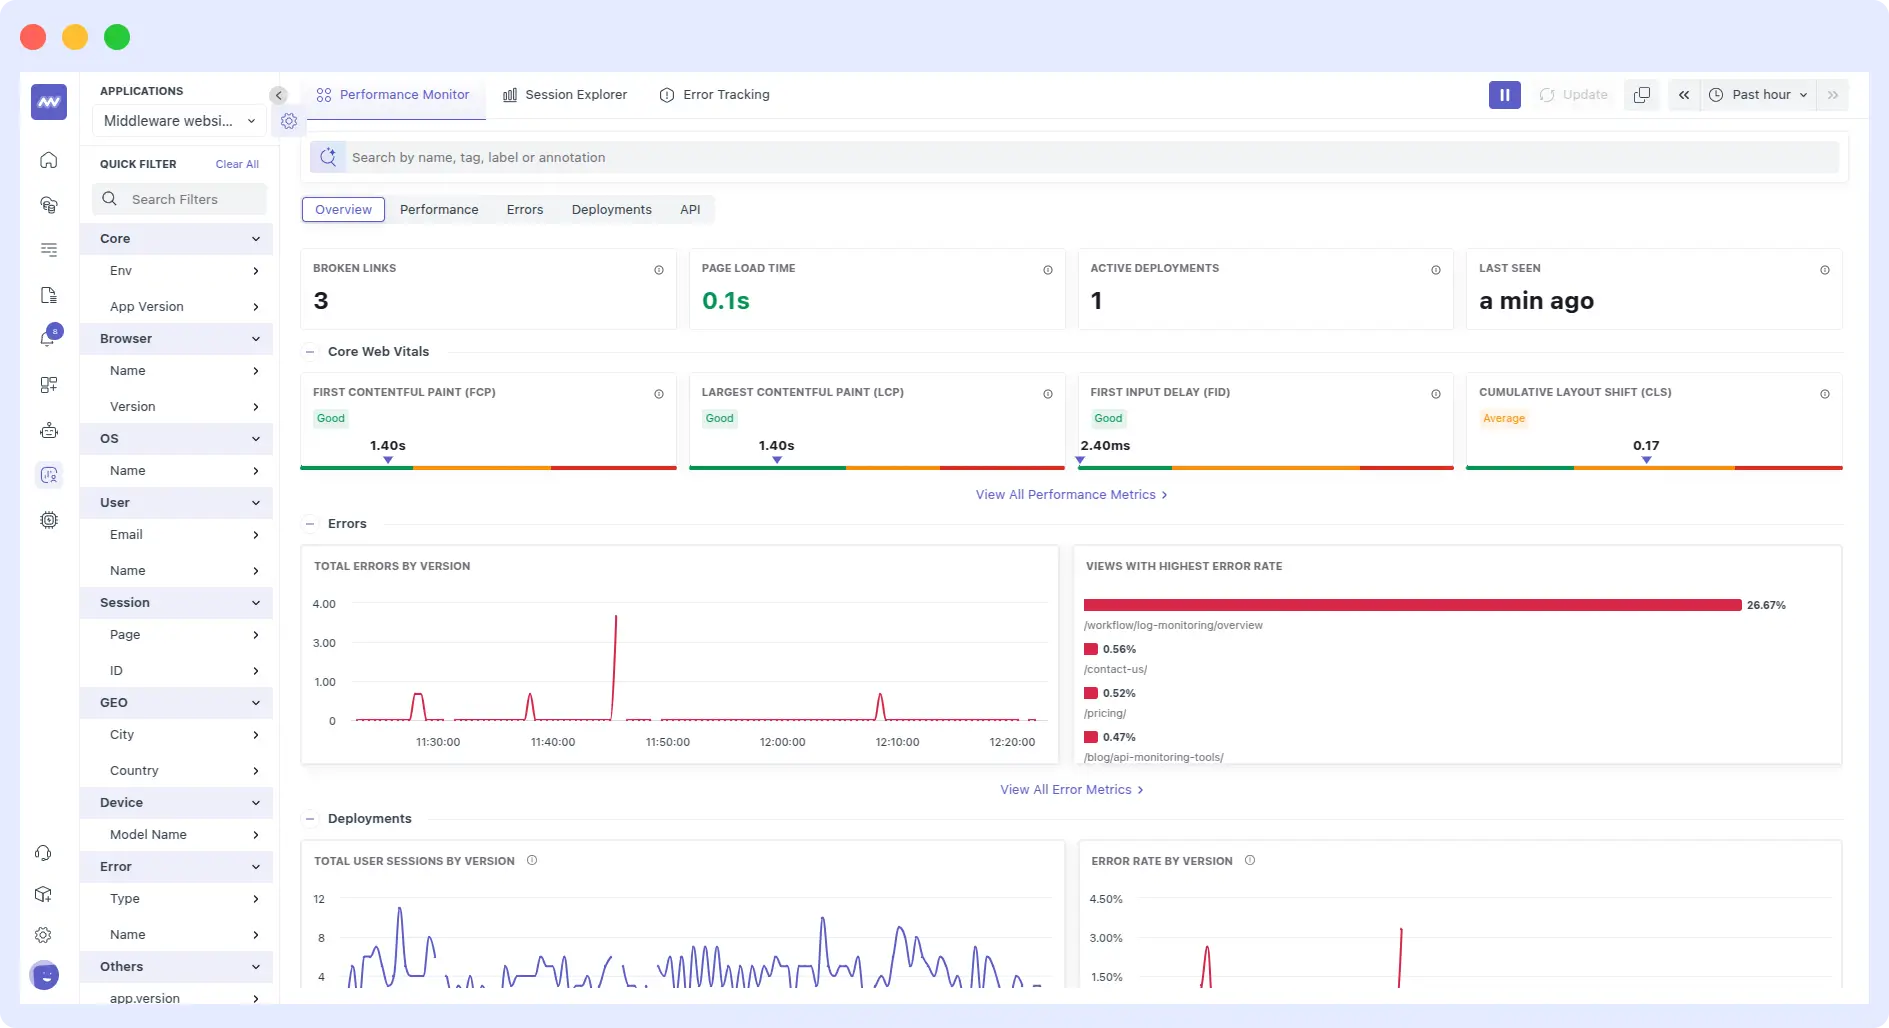
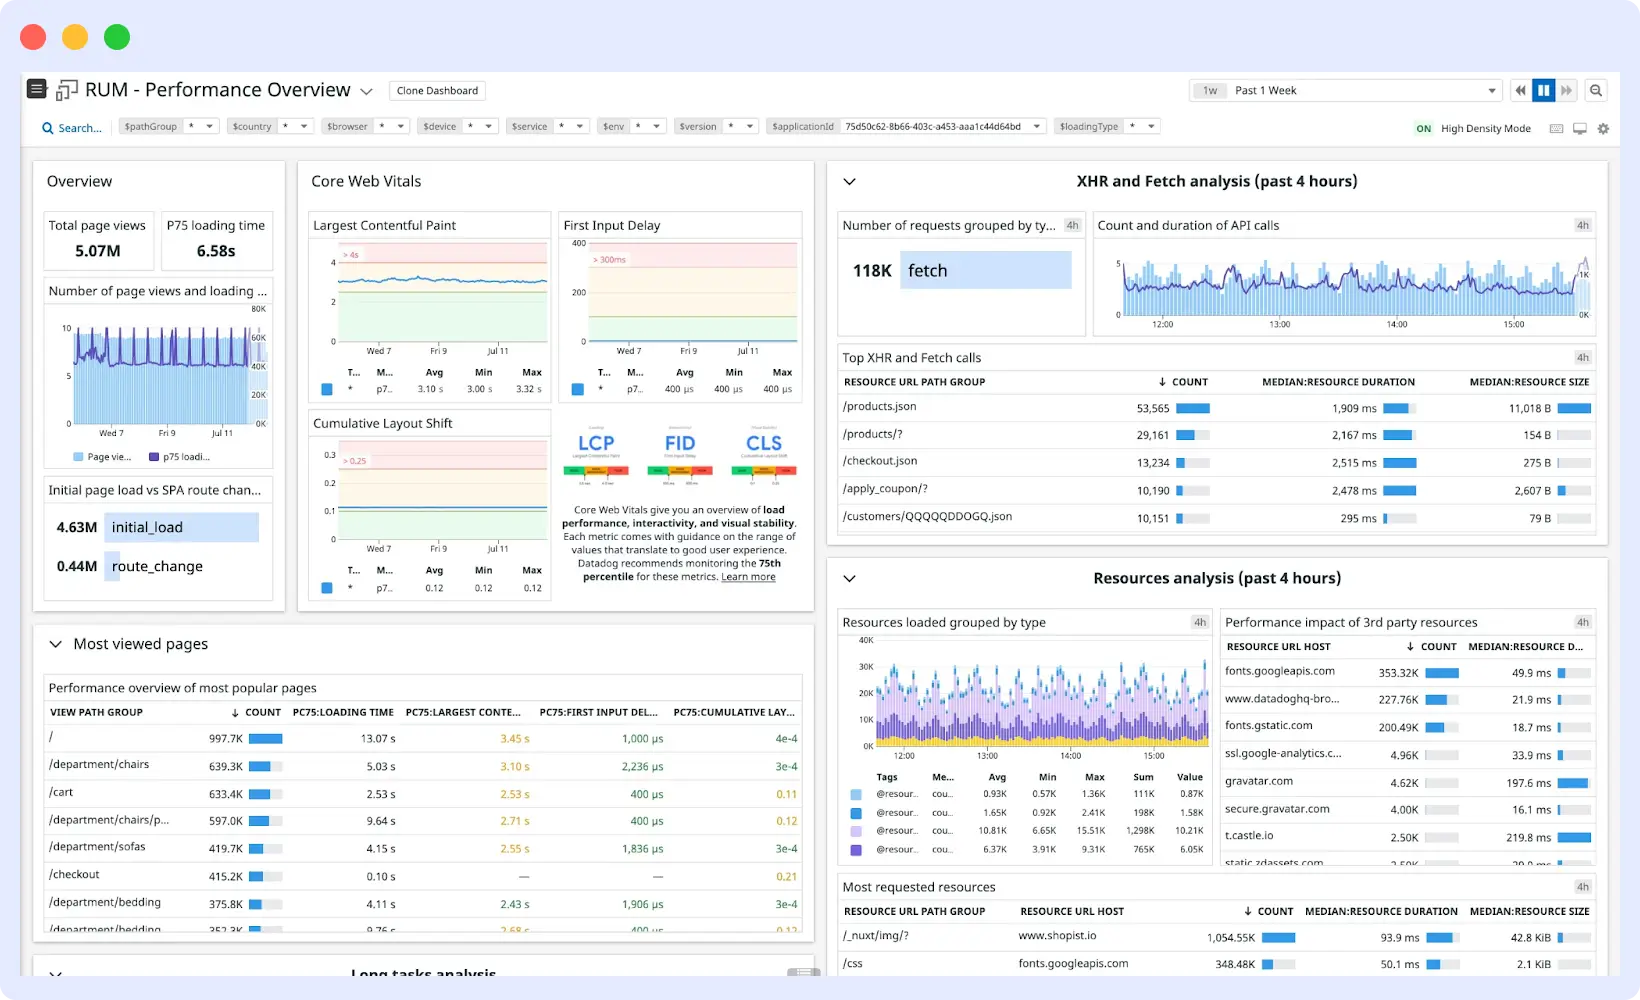
Middleware is a full-stack observability platform that combines Real User Monitoring (RUM), APM, distributed tracing, logs, and infrastructure monitoring in a single system.
Unlike standalone RUM tools, it connects frontend user sessions directly with backend traces and logs. This allows performance issues to be traced from user interactions such as a slow page load or failed request to the exact service or API causing the problem, without switching between tools.
At the user level, Middleware captures Core Web Vitals along with page load performance, resource timing, and interaction delays across real sessions. These metrics can be segmented by page, device, location, and percentiles (p50, p75, p95), making it easier to identify patterns that appear only under specific conditions.
Session replay adds visual context by showing how users interact with the application, including clicks, navigation, console errors, and network activity. This helps connect performance data with actual user behavior, making debugging more actionable. Sensitive inputs are masked by default to ensure data privacy.
When issues occur, JavaScript error tracking captures exceptions with stack traces, source files, and affected sessions. Combined with source map support, this enables accurate debugging of production errors. Network request monitoring further breaks down each request into detailed timing phases, helping identify slow APIs or third-party dependencies.
This visibility extends beyond web applications. Middleware also supports mobile RUM, capturing app start time, screen load performance, API calls, and crashes across iOS, Android, and React Native all unified in a single view alongside backend data.
Key Features
- Core Web Vitals tracking, including FCP, LCP, FID, and CLS, along with page load times, error rates, and session counts
- Session replay across web and mobile, capturing clicks, load events, console errors, and network activity
- Native support for web, Android, iOS, and React Native applications
- Backend correlation linking frontend sessions directly to traces and logs for faster root cause analysis
- Source map support to unminify JavaScript stack traces and pinpoint errors to exact lines of code
- Lightweight setup with minimal instrumentation required to start collecting RUM and backend data
- Data pipeline controls to manage ingestion and reduce unnecessary spend
- AI-assisted insights to surface anomalies and performance issues
Tradeoffs
Middleware combines multiple observability capabilities into a single platform, which simplifies workflows. Teams that prefer a mix of specialized tools may need to adjust how they integrate and manage their existing setup.
Pricing
Middleware offers flexible, usage-based pricing that scales with your data and RUM sessions, making it ideal for teams of all sizes.
- Free Forever plan: Up to 100 GB data, 1,000 RUM sessions/month, 14-day retention, core observability features
- Paid plans: Start at $0.30/GB for logs, metrics, traces, and ~$1 per 1,000 RUM sessions; includes ingestion controls, security, 30-day retention
- Enterprise plan: Custom pricing, extended retention, on-prem deployment, and dedicated support
Best For
- Teams needing end-to-end observability across frontend and backend
- Applications with complex microservices or API dependencies
- Organizations looking to reduce tool sprawl and centralize monitoring
- Engineering teams prioritizing faster root cause analysis
Middleware stands out by combining RUM with backend correlation, allowing teams to trace user experience issues directly to APIs, services, and infrastructure in one platform.
2. Raygun
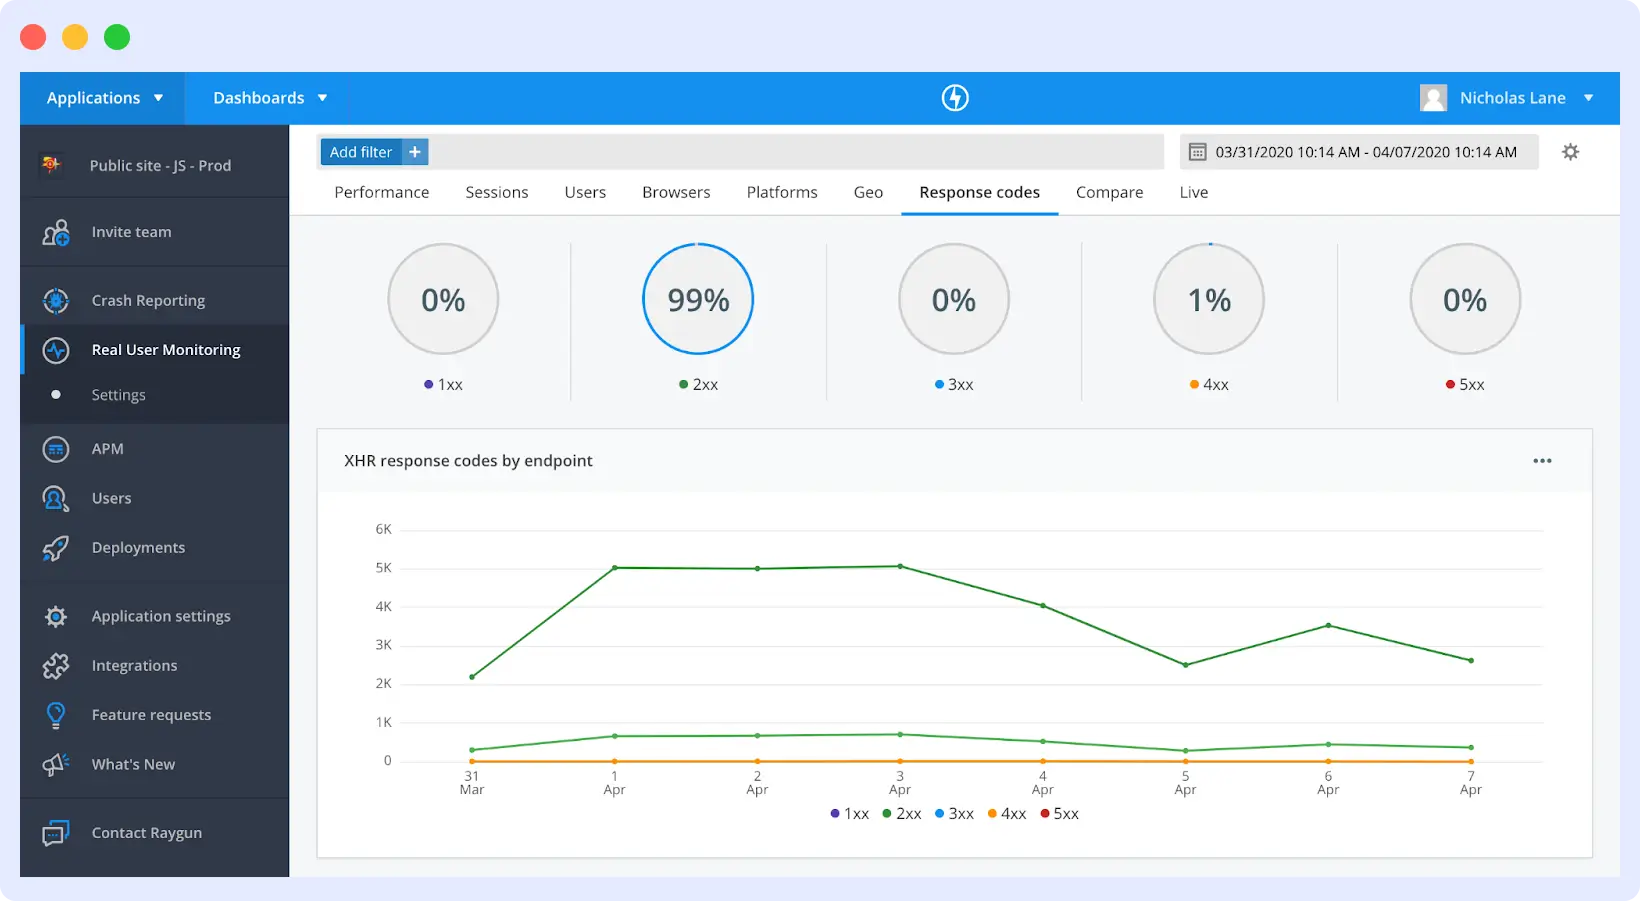
Raygun is an application monitoring tool that combines real user monitoring, crash reporting, and performance analytics to help teams understand how users experience frontend performance and errors.
Its RUM capabilities are primarily focused on the frontend, providing visibility into how users interact with pages, where performance slows down, and how errors impact real sessions. While it supports backend error tracking, its strength lies in connecting user experience data directly with frontend issues.
Raygun also emphasizes release monitoring, allowing teams to track how deployments affect performance and quickly identify regressions introduced in new versions.
Key Features
- Real User Monitoring combined with error monitoring and crash reporting
- Core Web Vitals monitoring with filtering by location, device, and browser
- Deployment tracking that flags performance regressions after every release
- Error tracking with stack traces linked directly to affected user sessions
- AI-assisted error resolution that surfaces fixes alongside reported issues
- Automated daily performance summaries with Slack integration
Tradeoffs
Raygun provides strong visibility into frontend performance and user experience, but backend correlation is limited.
- Less suitable for deep full-stack observability use cases
- Tracing issues from frontend to backend services typically requires additional tools
- Session replay is not fully native and may depend on integrations
Pricing
Raygun follows a subscription-based pricing model:
- Basic plan starts at $60/month (100,000 sessions)
- Team plan at $120/month
- Business plan at $600/month
Best For
- Small to mid-sized teams focused on frontend performance
- Product and UX teams analyzing user behavior and errors
- Applications needing simple monitoring without full observability complexity
Raygun is best suited for frontend-focused monitoring, where understanding user interactions and error impact is more important than deep backend correlation.
3. Datadog
Datadog is a full-stack observability solution that includes Real User Monitoring features, infrastructure monitoring, logs, and distributed tracing. It tracks real user interactions directly from the browser and correlates them with backend service calls, providing insights into how frontend performance affects the entire system.
Key Features
- Core Web Vitals tracking with 30+ performance metrics and long-term retention
- Session replay with user interaction tracking, including rage clicks and friction points
- Seamless pivot from RUM data to backend traces and logs for full-stack troubleshooting
- Custom data collection for user IDs, key actions, and workflow completion
- Full session capture with flexible retention controls
Tradeoffs
- High cost at scale: RUM, Session Replay, and other features are billed separately, making total spend unpredictable.
- Complex setup: Teams new to Datadog may take time to explore all features effectively.
- Feature overload: Full suite may feel overwhelming if only basic RUM is needed.
- Scaling charges: Additional costs for session replay, long-term data retention, and custom metrics.
Pricing
Datadog Pricing as:
- Scales quickly: Costs increase with enabled features and higher usage.
- Usage-based model: RUM starts at ~$0.15 per 1,000 sessions.
- Additional fees: Session Replay and data retention billed separately.
Best For
- Teams requiring full-stack observability with detailed RUM insights.
- Organizations willing to invest time and budget into exploring Datadog’s extensive feature set.
Datadog provides comprehensive RUM and full-stack observability, but its high costs and complex pricing structure can be a barrier, and the platform may feel overly complex for teams without prior Datadog experience.
4. Sentry
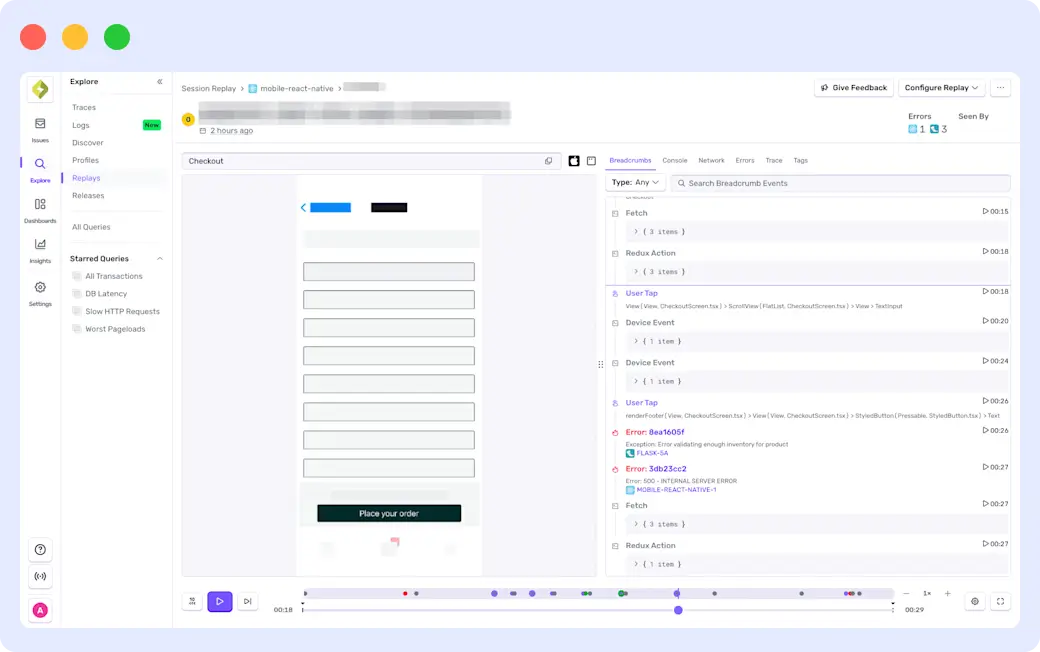
Sentry is an application monitoring tool widely recognized for its strong focus on error tracking and performance monitoring. Its Real User Monitoring (RUM) features help teams understand how errors and slow performance impact the user experience, providing actionable insights for improving applications.
Key Features
- Session replay linked to errors and performance issues for clear context
- Detailed error tracking with stack traces and contextual information
- Performance monitoring for slow transactions and user-impacting issues
- Unified dashboard combining errors, performance metrics, and user sessions
- Core Web Vitals tracking for frontend performance
- Instant alerts for slow pages, error spikes, and downtime, with smart routing and anomaly detection
Tradeoffs
- Primarily focused on application-level monitoring; lacks deep infrastructure observability
- Backend tracing and infrastructure correlation require additional infrastructure monitoring tools
- Pricing can become complex at scale, as usage is split across errors, replays, and performance data
Pricing
- Free plan available for basic monitoring
- Paid plans: Team at $26/month, Business at $80/month (billed annually)
- Enterprise pricing available on request
Best For
- Developer-focused teams seeking error tracking, performance monitoring, and session replay in a single platform
- Teams that prefer a lightweight alternative to full enterprise observability suites
Sentry excels at error and performance monitoring, with session replay tied to real user issues. Its focus is on applications, so backend observability and infrastructure monitoring are limited, and costs may grow with scale.
5. New Relic
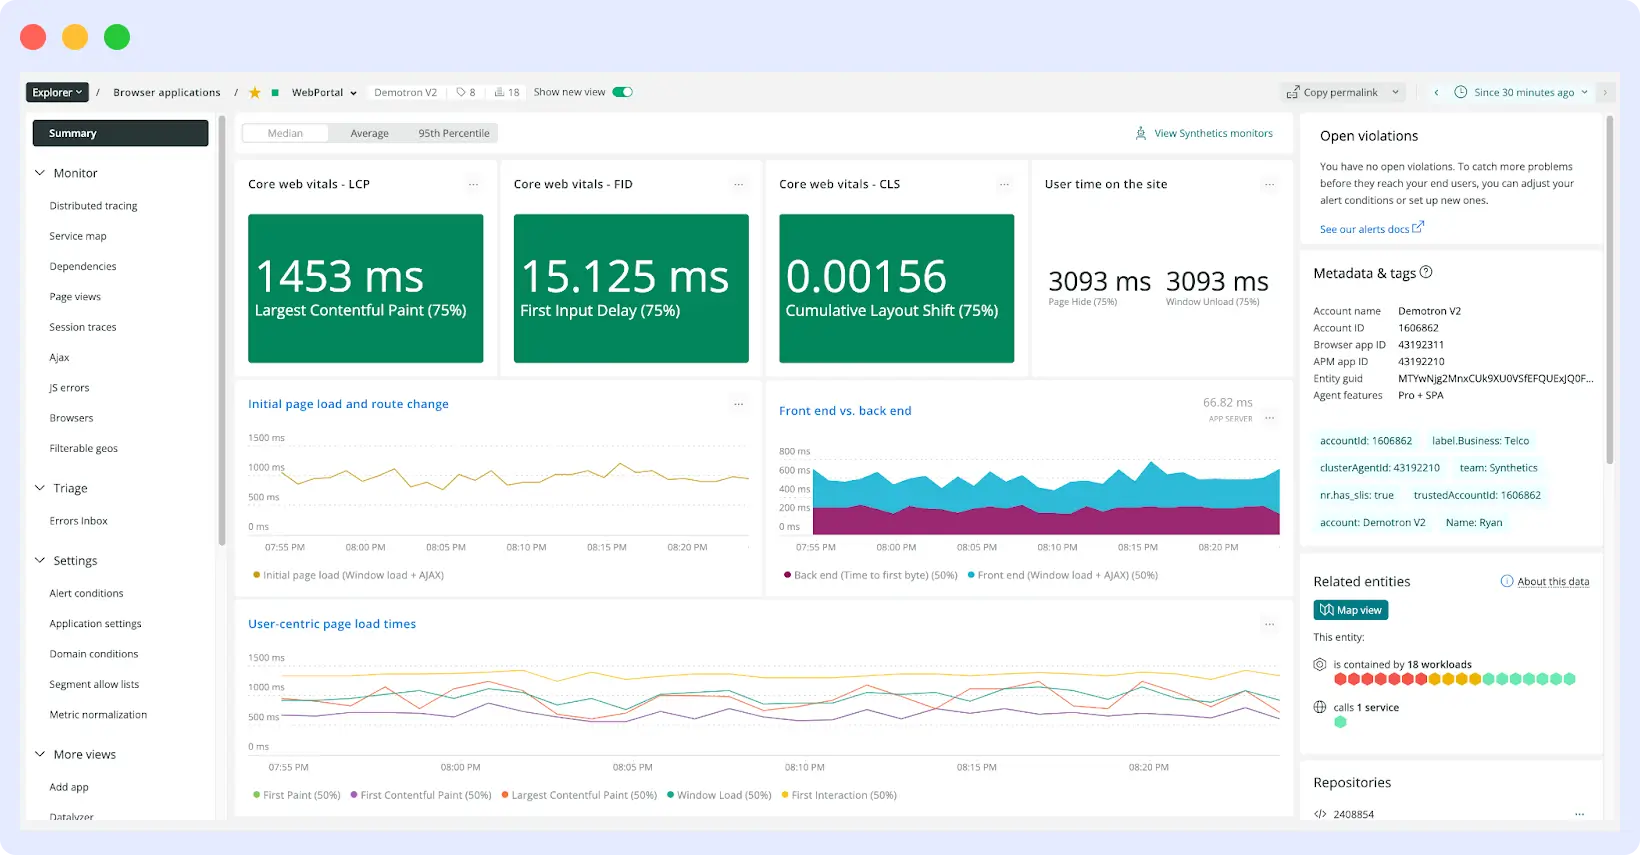
New Relic is a full-stack observability platform that combines Real User Monitoring with backend monitoring, logs, and distributed tracing. Its browser monitoring captures real user interactions and frontend performance data, helping teams pinpoint slow pages and errors.
Key Features
- Real User Monitoring for tracking frontend performance and user interactions
- Core Web Vitals tracking, including LCP, INP, and CLS
- Session replay with user interaction playback and debugging context
- Strong backend correlation with traces, logs, and APM data
- Unified platform for frontend and backend monitoring
Tradeoffs
- Pricing is data ingest-based, making costs hard to predict at scale
- Telemetry volume growth can lead to rapidly rising costs for larger teams
- Per-user pricing on higher tiers may make New Relic expensive for extended monitoring
Pricing
- Free tier: 100 GB of data ingest per month
- Paid plans: Data billed at $0.40/GB beyond the free tier
Best For
- Teams that want full-stack observability with strong frontend and backend correlation in a single platform.
New Relic provides comprehensive frontend and backend monitoring, but its data-based pricing can become costly at scale, especially for larger engineering teams.
6. Elastic RUM
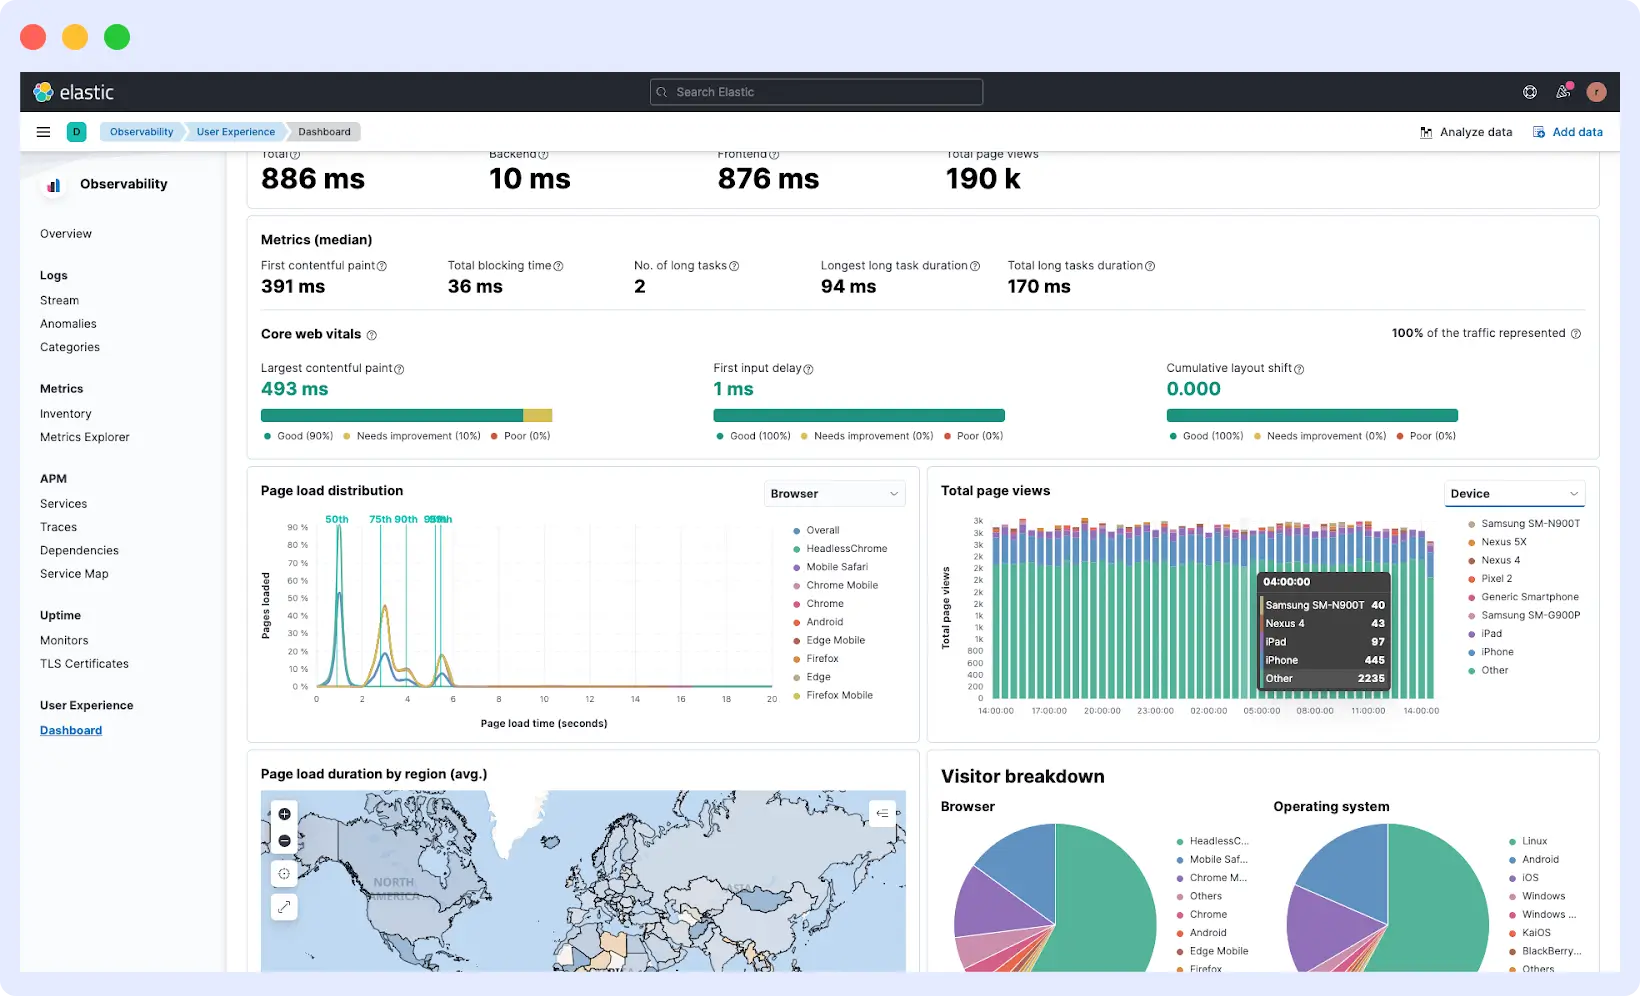
Elastic RUM is part of Elastic’s Observability platform and focuses on capturing how real users experience your web application. Instead of looking at performance in isolation, it connects frontend activity with backend logs, metrics, and traces, giving teams a more complete picture of what’s happening across their system.
Key Features
- Real User Monitoring for tracking frontend performance and user interactions
- Core Web Vitals tracking for measuring user experience
- JavaScript RUM agent for page loads, Core Web Vitals, and user interactions
- Native integration with Elastic APM for tracing frontend issues to backend services
- Kibana dashboards for visualization, alerting, and analysis
- Flexible deployment with self-managed and Elastic Cloud options
Tradeoffs
- Works best within the Elastic ecosystem, requiring setup and maintenance effort
- Session replay is limited compared to other RUM platforms
- Deep insights often depend on proper configuration of other Elastic components
Pricing
- Elastic RUM is free when self-hosted.
- On Elastic Cloud, the serverless Observability plan is usage-based, starting at around $0.09/GB for data ingestion and $0.19/GB per month for retention.
Best For
- Teams already running the Elastic Stack, or organizations in regulated industries that need full data ownership and want to unify frontend monitoring with their existing logs, metrics, and traces in one platform.
Elastic RUM offers strong frontend-backend correlation but can be complex to set up, with limited session replay and dependence on the Elastic ecosystem for full insights.
7. SpeedCurve
SpeedCurve is a performance monitoring tool focused on frontend performance and user experience. It combines real user monitoring with synthetic testing to help teams track how performance changes over time and how it affects real users.
Key Features
- Tracks Core Web Vitals, Lighthouse, as well as custom performance metrics
- Connects page performance with business metrics like bounce rate and conversion
- Traffic sampling to capture user journeys without excessive data volume
- Deployment tracking with CI integrations like Jenkins, GitHub, and CircleCI
- Performance budgets with real-time alerts when thresholds are exceeded
Tradeoffs
- Limited to frontend performance monitoring; no backend correlation
- No session replay, so tracking detailed user behavior is not possible
- Not suitable for teams seeking an all-in-one observability platform
Pricing
- Subscription-based: Starter plan at $90/month, Growth plan at $576/month
- Pricing scales with page views; free trial available
Best For
- Frontend teams focused on UX and performance optimization who want a specialist tool rather than a full-stack solution
SpeedCurve excels at frontend performance insights, but lacks backend correlation and session replay, limiting visibility into complete user experience.
8. Pingdom
Pingdom is a website monitoring tool that specializes in website uptimes, performance, and user experience. It uses a mix of Real User and synthetic monitoring to help users better understand how their application is performing in different locations.
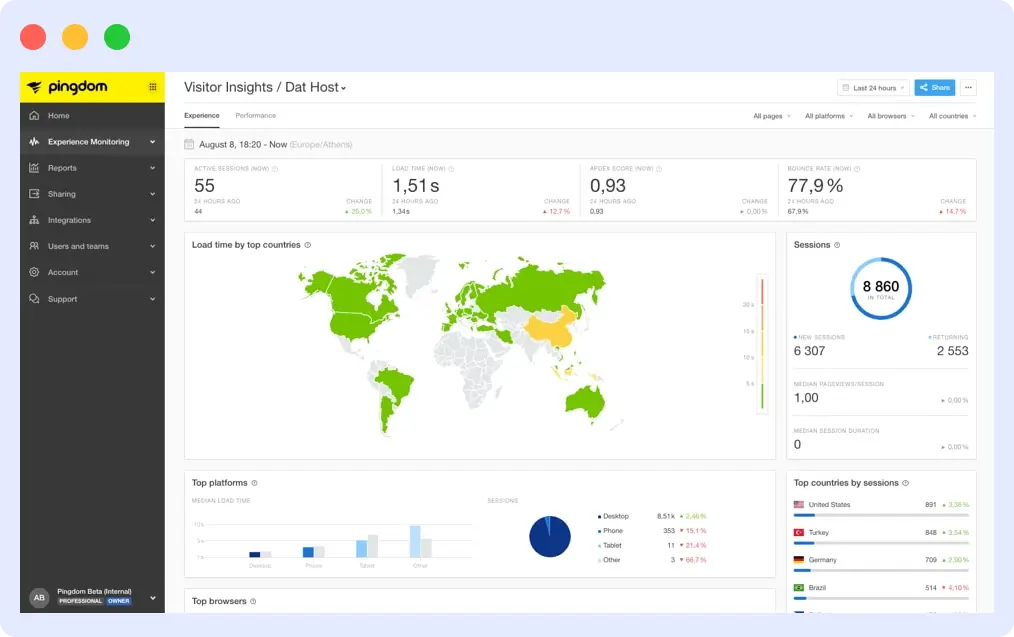
Key Features
- RUM based on pageviews with real-time performance metrics across browsers, devices, and locations
- Live map displaying users’ locations and regional performance metrics
- Page-level metrics including load time, DNS time, backend time, and frontend time
- User behavior metrics including top pages, bounce rate, active sessions, and time spent on pages
- Reports can be customized and filtered based on different users’ requirements
Tradeoffs
- Primarily an uptime and performance tool, so RUM capabilities are limited
- No session replay; tracing backend issues is difficult
- Not suited for teams needing full-stack observability
Pricing
- Primarily an uptime and performance tool, so RUM capabilities are limited
- No session replay; tracing backend issues is difficult
- Not suited for teams needing full-stack observability
Best For
- Teams needing basic uptime monitoring with some RUM insights without managing a complex observability platform
Pingdom provides basic RUM and uptime monitoring, but lacks session replay and backend correlation, limiting its usefulness for full-stack performance analysis.
What to Look for in a RUM Tool
With so many Real User Monitoring (RUM) tools available, the right choice depends on your team’s monitoring goals, complexity tolerance, and budget. Focus on these key factors:
1. Session Replay
Session replay shows exactly how users interact with your application, including clicks, scrolls, and navigation paths. While metrics highlight performance issues, replay reveals what the user actually experienced, making it essential for debugging UX problems and understanding drop-offs.
2. Core Web Vitals
Core Web Vitals like LCP, INP, and CLS measure real user experience. A strong RUM tool tracks these alongside page load times, interaction delays, and responsiveness, helping teams understand how performance affects usability and conversions.
3. Backend Correlation
RUM metrics may show a slow page, but backend correlation identifies the root cause. Tools that connect frontend sessions with traces, logs, and API requests make it faster to locate bottlenecks and reduce user-impacting issues.
4. Ease of Setup
Some tools can be added with a simple script, while others require more setup and configuration. If you need quick visibility, ease of setup matters. More complex tools may offer deeper control, but take longer to get value from.
5. Platform Support
If your application spans web and mobile, make sure the tool supports all your platforms. Some tools focus only on web, while others support iOS, Android, and frameworks like React Native.
6. Pricing
Some tools charge per session, others per event or data volume. Choose a model that fits your traffic and scales in a way that stays predictable as your usage grows.
Wrapping Up
The right RUM tool is both a technical and a business decision. Performance issues don’t just affect metrics; they affect user behavior and conversions. The best choice depends on your stack, team size, and how deeply you need to understand your application.
If you need a unified view across frontend and backend, Middleware is a solid option. It brings RUM, APM, logs, and metrics together in one platform without the usual complexity.
Middleware delivers complete RUM and observability, combining session replay, performance metrics, backend correlation, and AI insights so teams can understand, analyze, and improve the real user experience efficiently.
FAQs
How do I choose between a standalone RUM tool and an all-in-one observability platform?
If your focus is frontend performance and quick setup, a standalone RUM tool like SpeedCurve or Raygun may be enough. If you need to connect frontend data to backend services, logs, and infrastructure, an all-in-one platform like Middleware, Datadog, or New Relic reduces tool sprawl and speeds up debugging.
Does RUM affect my website’s performance or load time?
Most modern RUM tools are lightweight and load asynchronously, so they don’t block rendering or noticeably affect load time. It’s still worth checking the size and loading behavior of the SDK, especially for performance-sensitive applications.
What data does RUM collect from users?
RUM collects page load times, Core Web Vitals, JavaScript errors, network requests, and user interactions like clicks and navigation. It also captures device type, browser, and location. Some tools include session replay, which shows how users move through your application. Most tools support data masking to protect sensitive information.
What features should I look for in a RUM tool?
Key features include session replay, Core Web Vitals tracking (LCP, INP, CLS), backend correlation, mobile support, and customizable alerts for performance issues.
How is Middleware different for RUM Tool?
Middleware provides end-to-end visibility from user interactions to backend services, making it a comprehensive RUM solution.