
A sluggish app. Frustrated users. Downtime during peak traffic.
Most of the time, the root cause is simple: a server that wasn’t being monitored closely enough. Server health is critical for keeping IT environments stable, responsive, and secure. Without it, the very backbone of your applications, content delivery, and user services becomes a single point of failure.
This post covers the fundamentals of server health monitoring, why it matters, which metrics to track, and how to do it effectively. We’ll also look at how platforms like Middleware make the process easier, providing real-time insights and alerts so your team can prevent downtime before it happens.
What Is Server Health Monitoring?
Server health monitoring is the practice of continuously tracking a server’s performance, availability, and resource usage to spot potential issues before they turn into outages. In short, it’s like checking the vital signs of your infrastructure.
A few crucial indicators that are usually measured are:
- CPU usage: the amount of processing power being utilized
- Memory usage: how much RAM is in use and how efficiently
- Disk usage: free storage and I/O performance
- Network activity: traffic, throughput, and latency
- Service responsiveness: if critical applications or services are responsive and performing well
Ignoring these signals doesn’t just slow things down; it often leads to unscheduled reboots, lost productivity, revenue impact, and even security vulnerabilities when systems aren’t patched or resources are maxed out.
💡 Pro tip: Instead of juggling multiple tools, you can use a unified platform like Middleware to track CPU, memory, disk, network, and application health in real time. Start monitoring in minutes →
To prevent these failures, let’s explore how server health monitoring works in practice and the different approaches teams use to keep systems running smoothly.
How Server Health Monitoring Works
Server monitoring involves gathering and interpreting real-time information about your servers, using either agent-based or agentless methods. They follow performance measures, issue warnings, and usually include dashboards to visualize any trends.
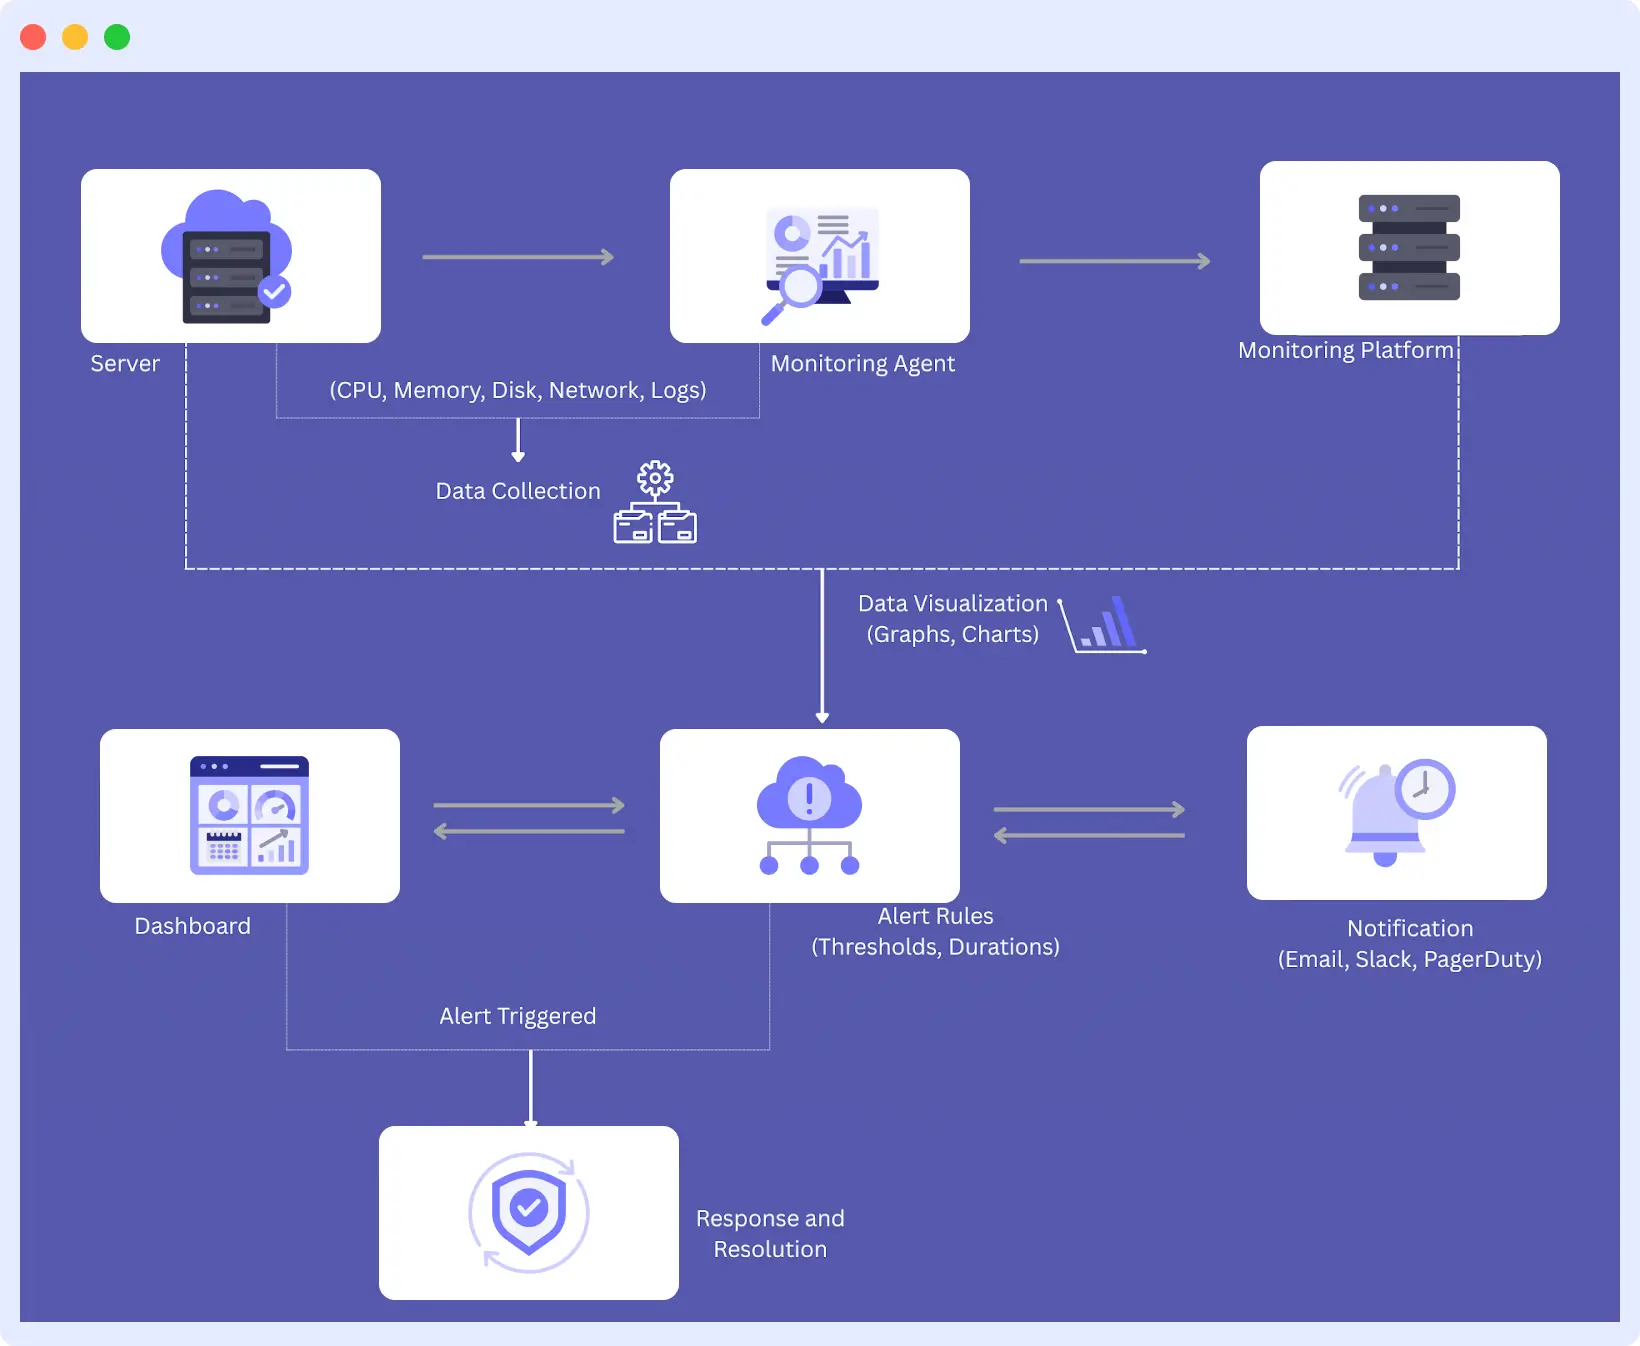
This is the breakdown of each stage:
1. Data Collection
Firstly, the process of monitoring begins with the collection of data on servers. This involves measurements such as CPU usage, memory consumption, disk I/O, network activity, as well as the state of services or applications. This data is constantly collected by monitoring agents, scripts or built-in OS tools.
With agent-based or agentless monitoring, Middleware automatically collects these metrics across on-premise, cloud, or hybrid environments without heavy manual setup.
2. Data Transmission
The data so collected is transmitted to a central monitoring system. This may be a cloud-based platform or an internal server specialized in monitoring. The transmission protocols ensure that data is transmitted safely and effectively, eliminating the risk of compromise or ineffectiveness, even when the system under observation spans multiple environments.
Example: During peak traffic, Middleware ensures you can still track metrics instantly without delays.
3. Data Analysis
Data entering the system is analyzed to give it meaning. It explicitly compares data to preset limits, searches for patterns or sharp rises, and identifies trends. Once again, as an example, when the usage of the CPUs continues to increase over time, it might be an indication of a memory leak or resource stall.
For example, a continuous increase in CPU usage might indicate a memory leak or unoptimized code.
4. Data Visualization
On analysis, the information is transformed into visual data such as graphs, dashboards and heatmaps. Such visuals enable teams to quickly grasp the health of the systems, isolate anomalies, and delve deeper into specific measures when resolving these problems.
Pro Tip: Dynamic dashboards help you drill down from high-level server health to specific containers or services in seconds.
👉 Explore Middleware’s free server monitoring dashboard to see your metrics in real time.
5. Warning/Alert
In the event of a problem occurring, such as a service failing or a memory limit being reached, the monitoring system triggers alerts. Such alerts may be delivered by various sources (email, Slack, SMS, etc.) and may be ordered by priority, which assists teams in responding promptly.
6. Response
System administrators or DevOps engineers are alerted, analyze the issue, and respond to it. This may include restarting the services, upscaling infrastructure, changing the settings, and looking at the logs to identify the cause of the incident. Rapid reactive action eliminates idle time and keeps systems working fine.
Best Practice: Automate routine responses (like auto-scaling or restarting failed services) to prevent repeat downtime.
👉 Learn more about Log Monitoring and Analysis to see how logs play a key role in faster troubleshooting.
Core Components to Track in Server Health Monitoring
Effective server health monitoring goes beyond checking whether a server is simply “up” or “down.” It involves tracking multiple system components to ensure smooth performance and quick detection of anomalies.
Here are the core components you should monitor:
1. System Resource metrics
These indicators inform you about the functioning of the basic framework of the computer and the operating system.
- CPU Usage: Monitor the overall CPU usage and scaling according to the number of cores to detect bottlenecks in the processing. Constant heavy usage of the CPU (over 80%) can be an indication of optimization or scaling.
- Memory Use (RAM): Monitor both free and utilized memory, along with the swap usage. Application slowdowns and crash occurrences may arise from low RAM or from memory leaks.
- Disk Space: Monitor the space of all mount points. Disk space exhaustion can bring activities to a complete stop, and monitoring growth trends is also helpful for performing capacity planning.
- Disk I/O Performance: Measure read/write speed, the number of queues, and Input/Output Operations Per Second (IOPS).
📖 Related Read: What Is Infrastructure Monitoring? A Complete Guide
2. Application Performance Indicators
These show how your app performs from the user and backend perspectives.
- Response Times: Keep a track of how fast your application responds to a request. Response time is a critical part of the user experience; hence, it can serve as a sign of a problem.
- Throughput: Employ requests per second or transactions per minute to measure the app’s capacity and notice traffic surges.
- Error Rates: Monitor HTTP error codes (4xx, 5xx), app exceptions, and failing transactions.
- Request Queues: Monitor pending requests and queue lengths to identify when your app is getting overwhelmed.
📖 Related Read: What Is Application Performance Monitoring? A Complete Guide
3. Infrastructure Dependencies
Infrastructure dependencies are the external systems, services, or resources with which your server communicates to perform well. While independent of the server itself, they are very critical for performance and reliability.
- Database Connections: Active connections between the database and application systems. Keep an eye on connection pool usage, the execution speed of queries, and accessibility. Database issues may cause the application to crash or hang.
- Availability of External API: Monitors the third-party API service on which your app is reliant for responsiveness and health indicators like response time and error rate. Downtime or lag in this aspect can, in fact, disable essential functionality.
- Message Queues: Message queues process asynchronous communications by buffering and routing messages between services. So, track queue depth, processing rate, and consumer health to avert bottlenecks.
- Load Balancers: Split incoming traffic among several servers to avoid overloading. Track traffic splitting, health checks, and failover operations to maintain smooth and efficient routing.
4. Network Performance
The network metrics allow you to measure how healthy your application is and how fast and reliably it communicates with other systems, users, and services. Even the fastest of servers may seem sluggish or even offline when network connectivity is weak.
- Bandwidth Usage: This refers to the data being transferred and received on the network. This heavy use may represent a flood of traffic or a loss of data.
- Packet Loss: This occurs when packets of information transmitted along your network cannot reach their destination, either due to congestion or a failing hardware component. A common indication of unreliable connections.
- Latency: This is the period or time the data packet takes to move between the source and the destination and is usually measured in milliseconds. Poor latency impacts app responsiveness and real-time abilities.
- DNS Resolution Time: It is the duration that domain names take to resolve to IP addresses.
- Connection Errors: Tracks errors in trying to establish or continue a connection, such as timeout messages and resets. Moreover, recurring problems can be indications of unreliable network routes or congested services.
5. Security and Access Indicators
In addition to performance metrics, access monitoring and security can assist in tracing activities and patterns that may indicate threats, unauthorized access, or compliance issues affecting your system and data security.
- Authentication Failures: Failure to log in that may seem to suggest genuine user mistakes or a brute-force attack.
- Access Violations: Access attempts made by invalid users or systems to files or functions that they are not allowed to access. Therefore, monitor malicious access to valuable resources or the features of administrator accounts.
- Certificate Expiration: Monitors the validity of certificates protecting network conversations through the network with SSL/TLS. It helps avoid the problem of invalid or improperly configured certificates.
- Unusual Traffic Patterns: Abnormalities in regular network traffic that can be a sign of a security attack, for instance, consisting of spikes from uncommon locations or abnormal request patterns.
Middleware for Server Health Monitoring: Faster, Smarter, and Developer-Friendly
While understanding server monitoring fundamentals is crucial, choosing the right platform can make the difference between reactive firefighting and proactive system management. Middleware offers a comprehensive observability platform specifically designed to address the complex challenges modern development teams face with server health monitoring.
Want to understand the bigger picture? Read our full guide on Observability vs. Monitoring.
Unified Full-Stack Visibility
With middleware, you have end-to-end visibility in the complete infrastructure stack. You no longer have to deal with all the different tools and interfaces between them, but rather have a central portal that provides you with all the details of your servers, containers and applications.
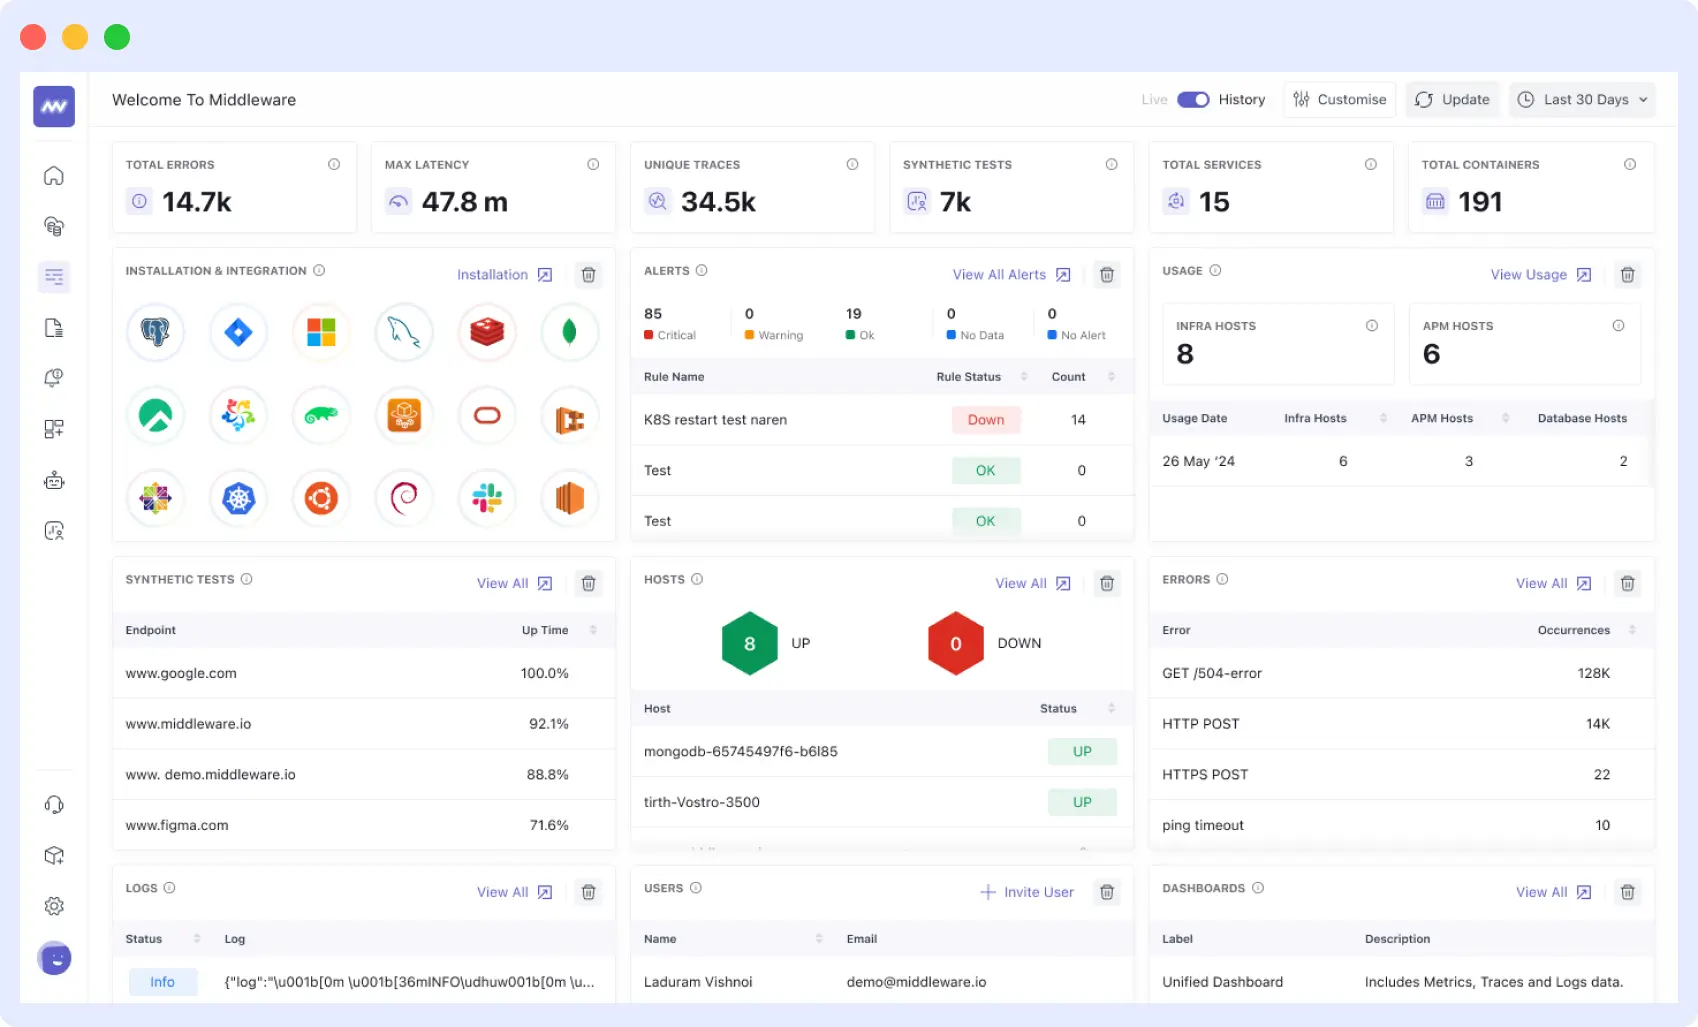
Automatic Infrastructure Discovery
The platform automatically detects and lists all the hosts that are up and running in your infrastructure. It shows important server health indicators such as CPU, memory utilization and server status in real time.
Running physical servers, virtual machines or containerized infrastructure, Middleware provides you with immediate insights into the health and performance of each of the members. If you specifically want to go deeper into Windows environments, check out our guide on Windows Server Monitoring.
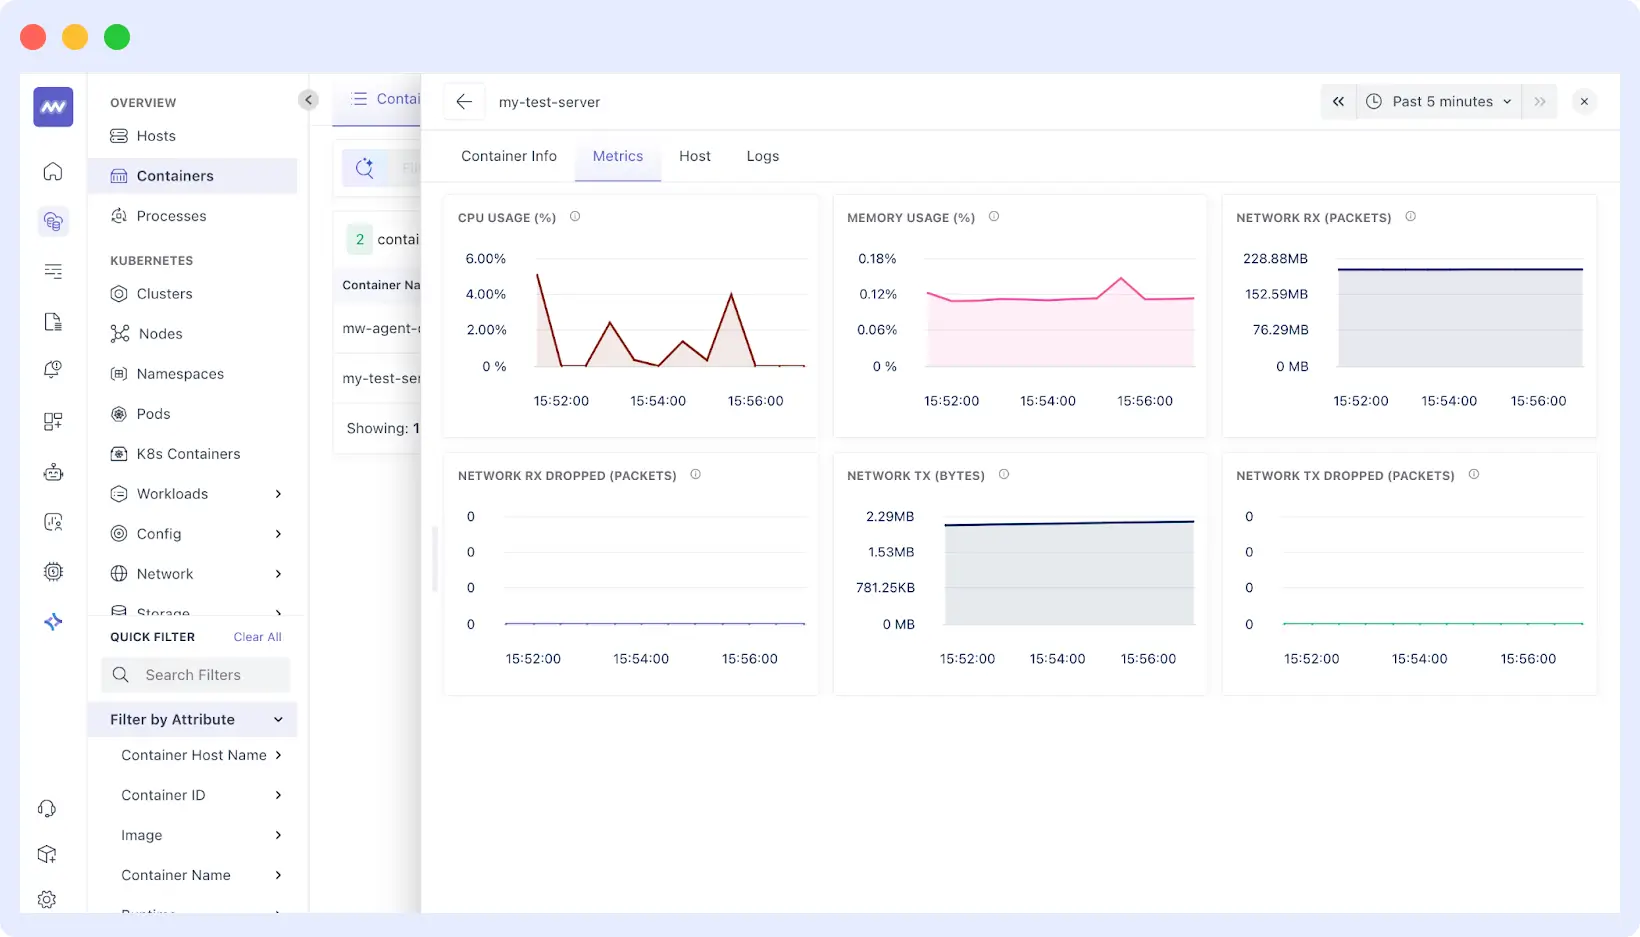
Real-Time Monitoring of System Resources
In addition, Middleware detects all the vital enterprise system resource parameters we had discussed above using lightweight agents that monitor system resources at the desired (default is 10 seconds) time intervals. The platform tracks:
- CPU metrics: General usage, per core usage, 1min, 5min, 15min load averages, and CPU steal time
- Memory monitoring: Used/available, swap usage, buffer/cache usage, and memory pressure measures
- Disk monitoring: Disk space available across mount objects, I/O operations per second (IOPS), read/write throughput, and disk queue depths.
- Network performance: Bytes sent/received, packet loss rates, connection states and network interface usage
Built-in and Customizable Alerting
Middleware addresses one of the biggest challenges in server health monitoring — creating meaningful alerts without overwhelming your team. The platform provides:
Predefined Alert Templates
Middleware comes with built-in alerts for common server health scenarios, including high CPU usage, memory exhaustion, disk space warnings, and service availability issues.
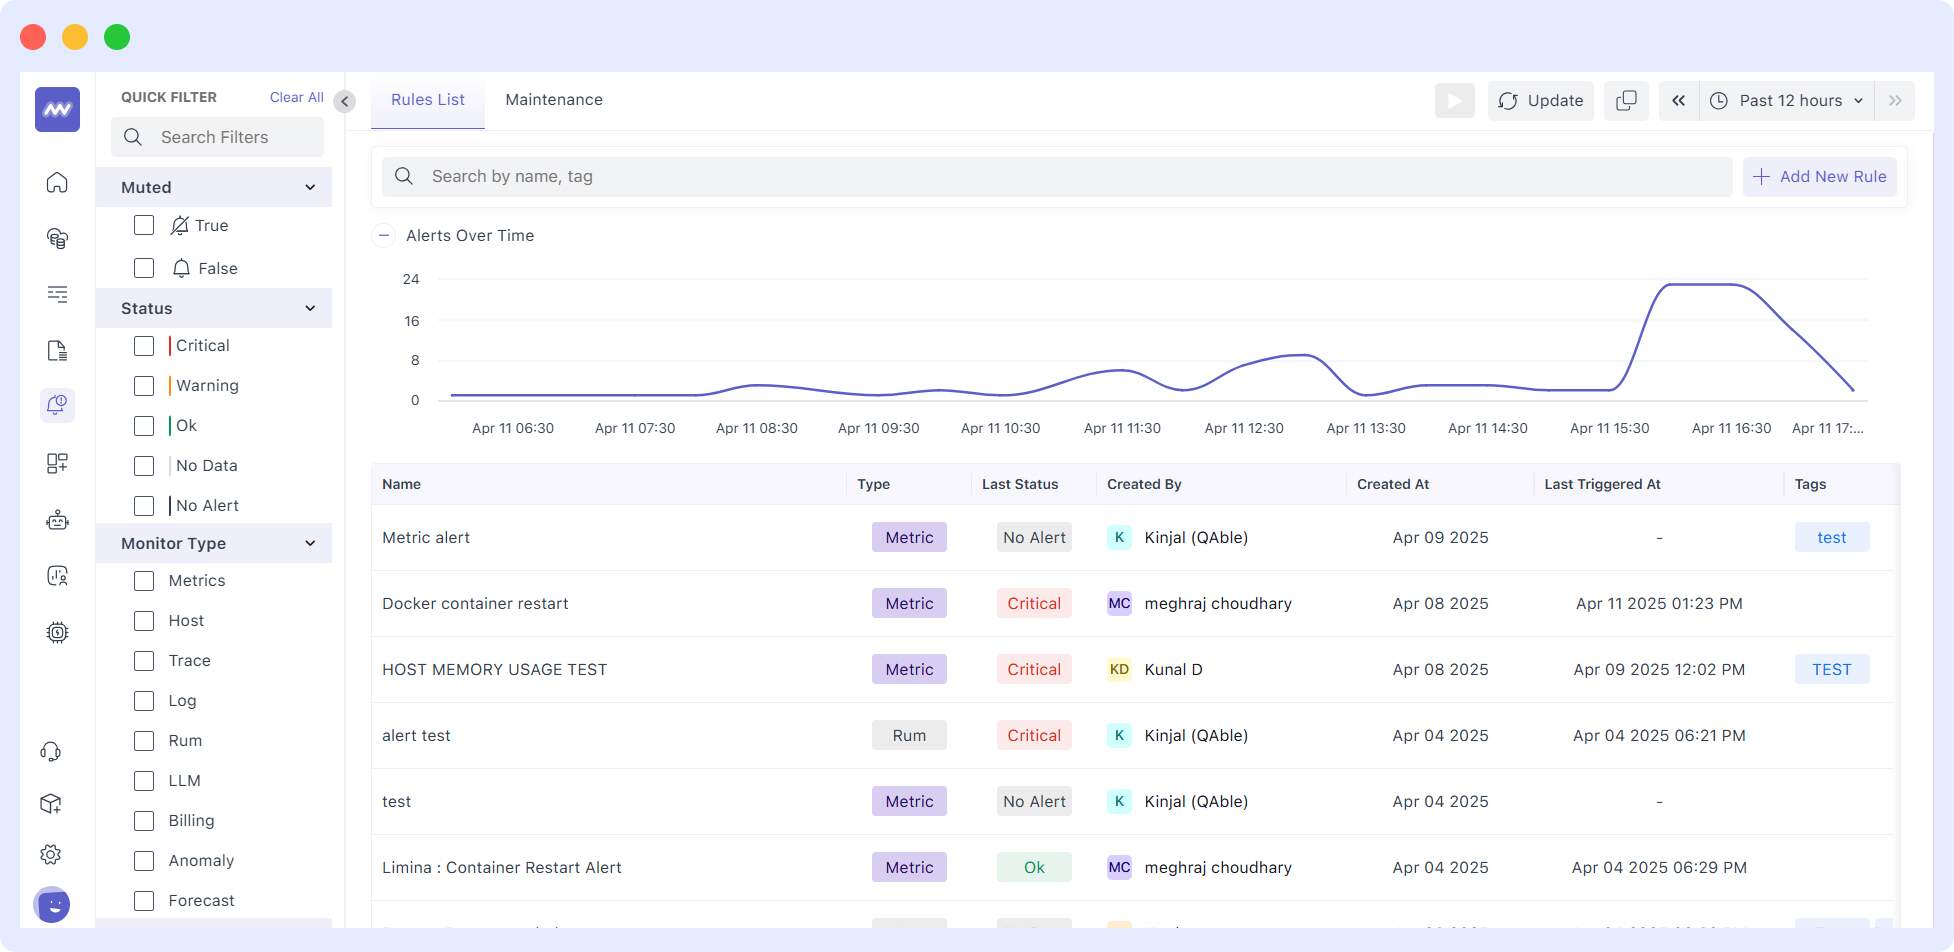
Custom Alert Configuration
If you have custom needs, we can create alerts tailored to your infrastructure requirements. Set thresholds using your server baselines, configure multi-condition alerts, and outline escalation processes that are consistent with the workflows in your organization.
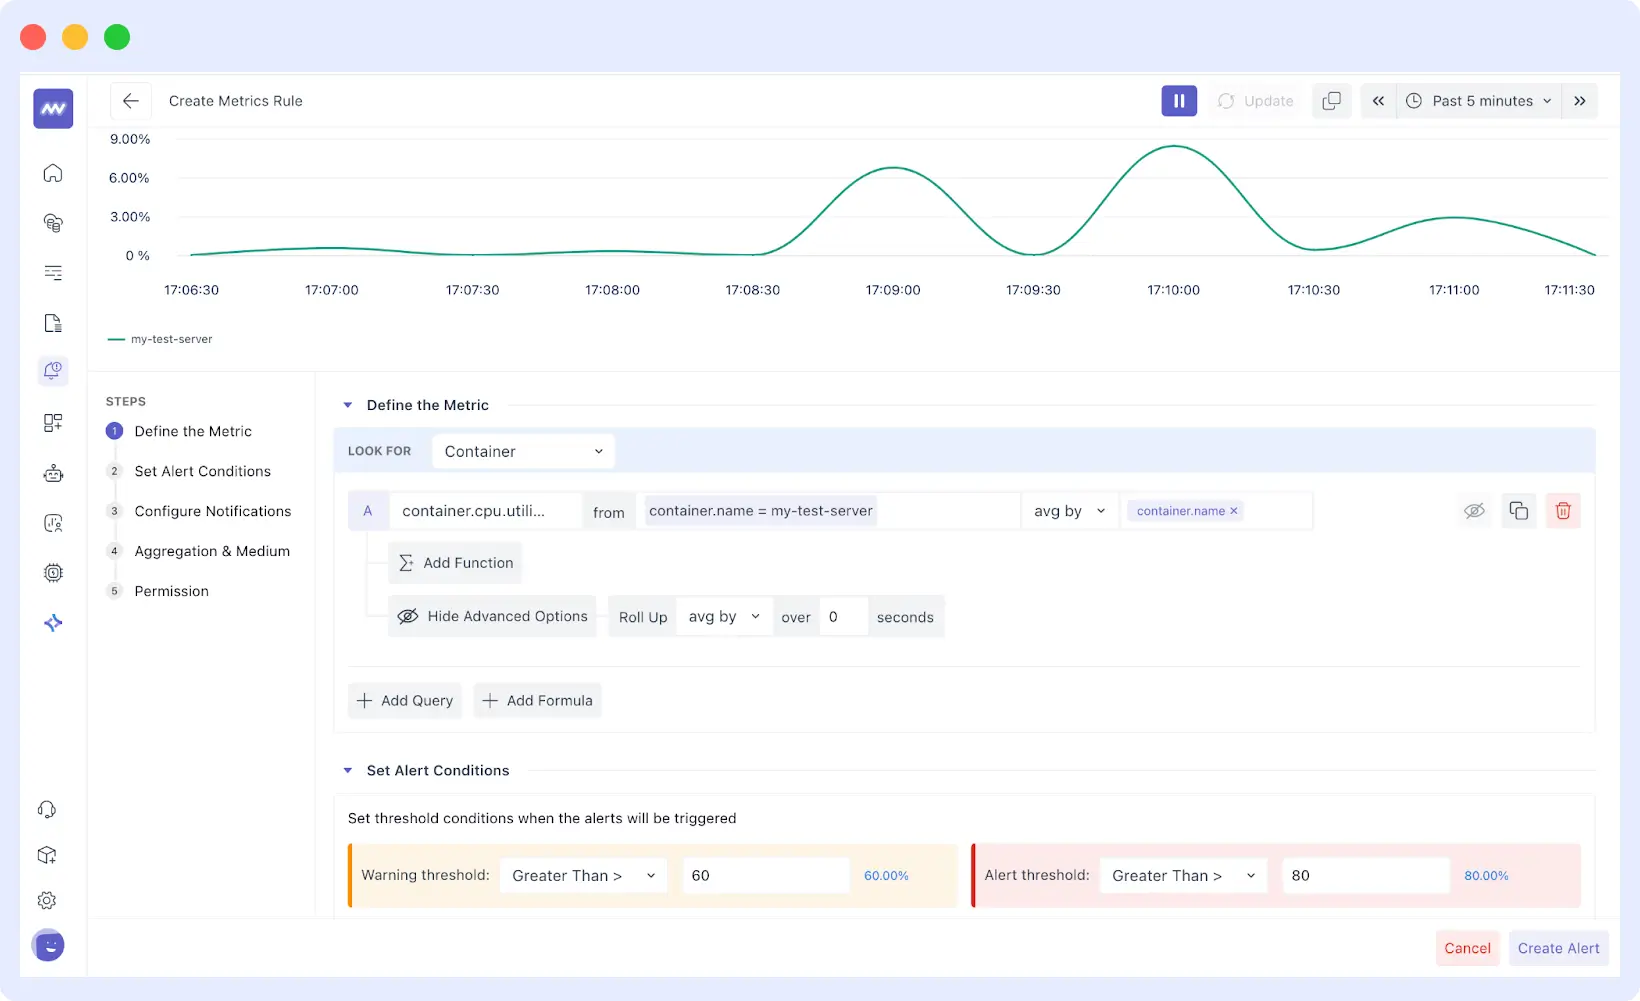
Intelligent Alert Management
The alerting system enables minimizing false alerts and alert fatigue by allowing you to configure severity levels, time-related circumstances, and correlation guidelines, thereby ensuring you are notified of real issues occurring within your server.
Dashboards That Give You Insights at a Glance
Middleware provides both default dashboards for immediate value and customization options for specific needs:
Pre-Built Dashboards for Faster Monitoring
Pre-built dashboards include all the key elements of your infrastructure, such as physical servers, virtual machines, containers, and cloud infrastructure instances. These dashboards show the critical server health indicators that we have talked about: buffers, CPU, memory, disk, and network performance, as well as application indicators.
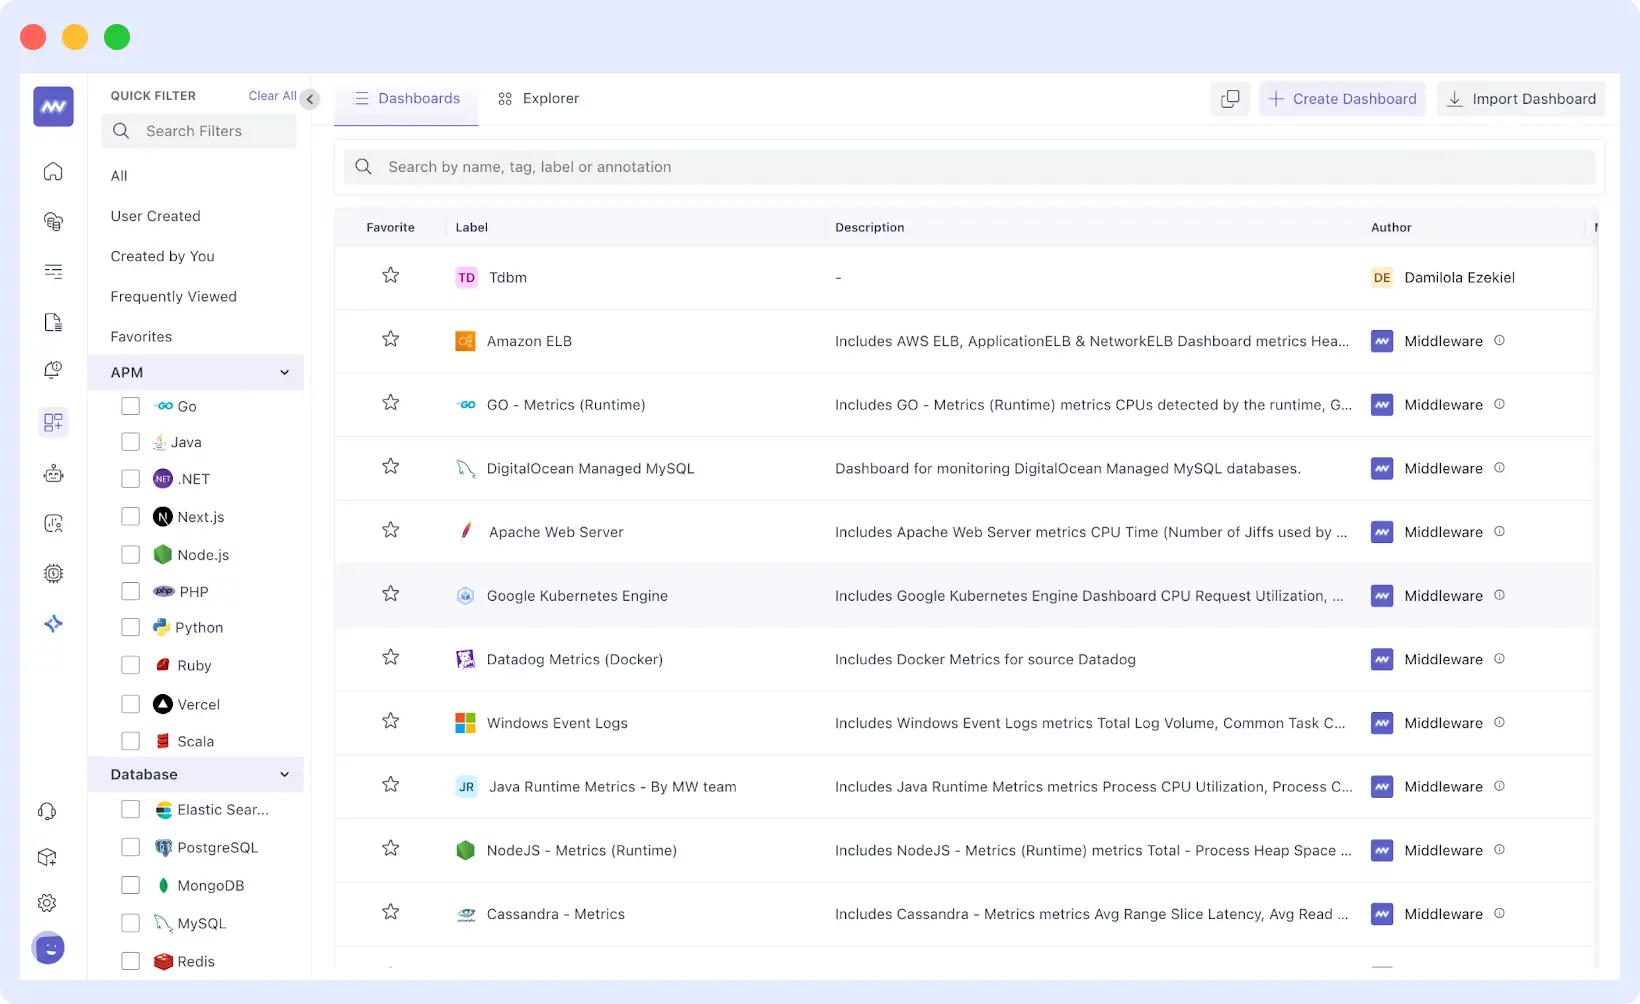
Personalized Monitoring with Custom Views
Middleware lets you create dashboards from scratch, tailored to your monitoring needs. You can also import existing dashboards from tools like Datadog, making migration simple. Track application performance, monitor specific server groups, and display only the metrics that matter to your team.
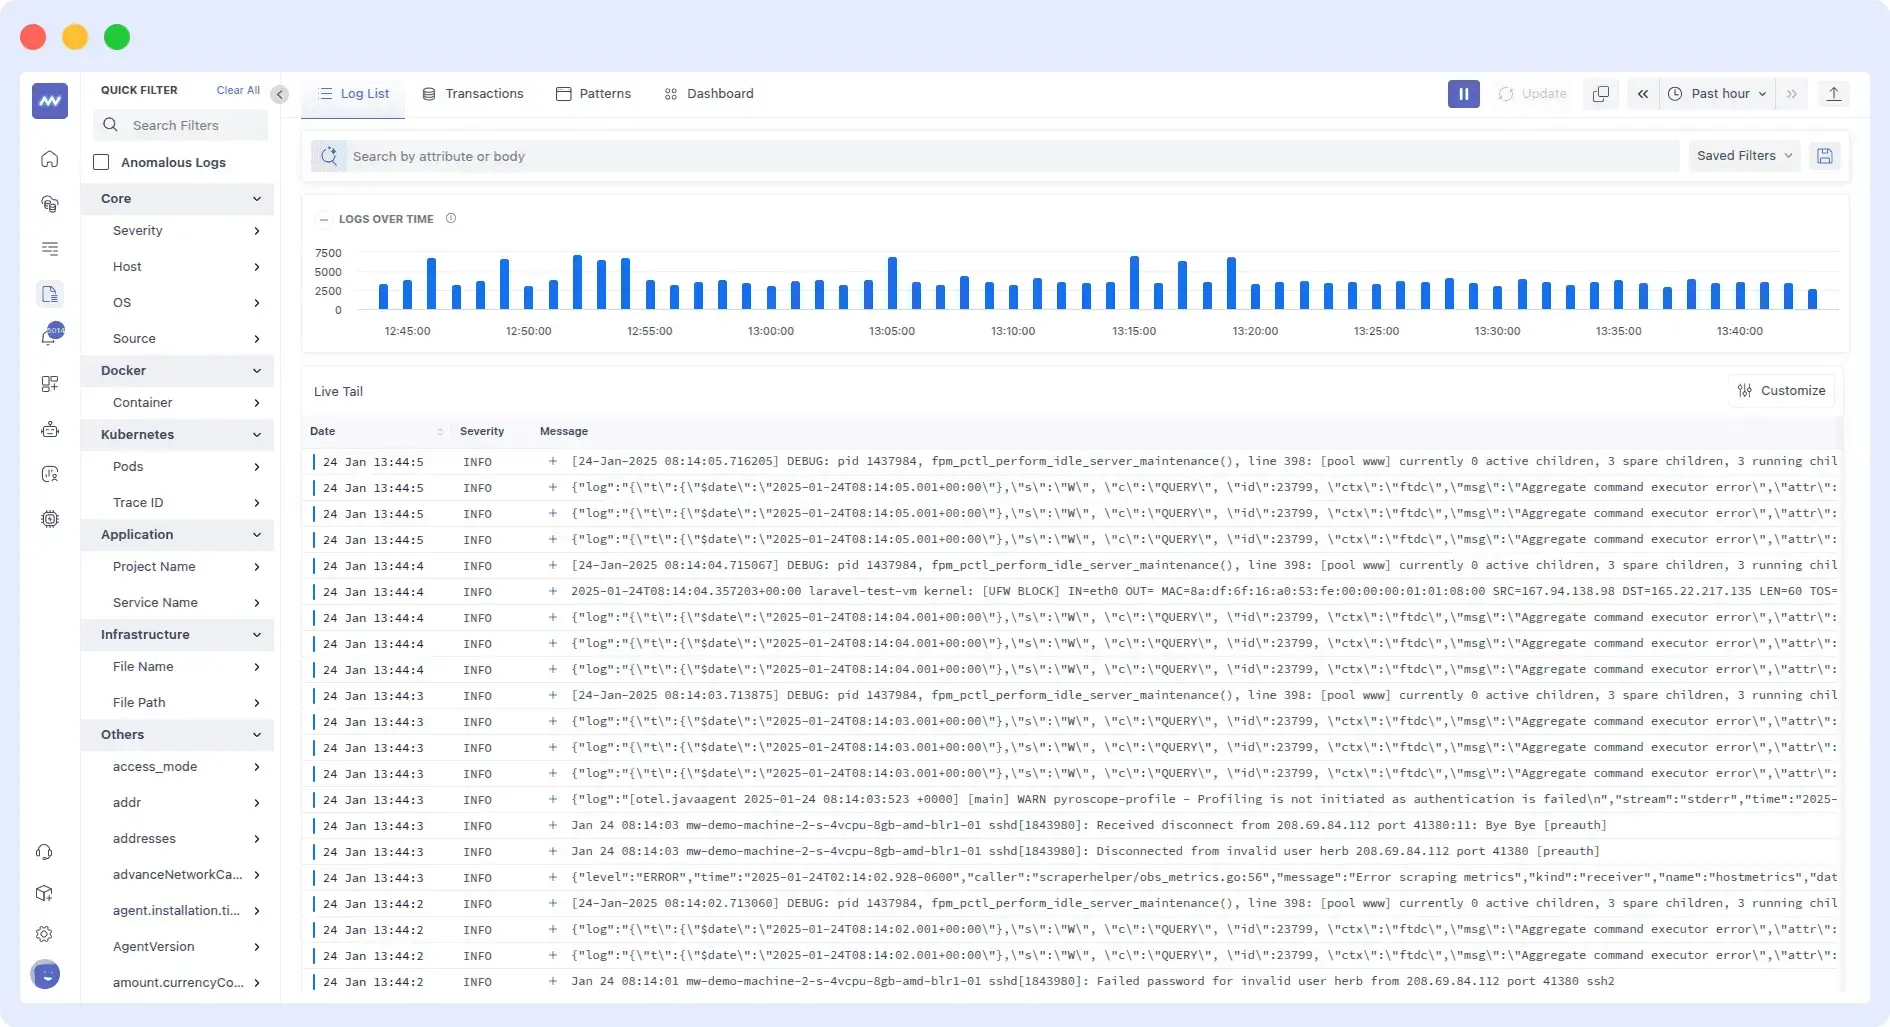
Centralized Logging with Powerful Analysis
- Centralized log collection from multiple sources
- Advanced analysis with search and pattern recognition
- Log-based alerting and correlation with server metrics
- Troubleshooting workflows that combine logs with performance data
Integrate Effortlessly with Your Existing Tools
- Development tools (GitHub, CI/CD pipelines, container orchestration)
- Communication platforms (Slack, PagerDuty, Jira)
- Data and analytics tools (Grafana, Elasticsearch)
Developer-Friendly Implementation
Unlike enterprise monitoring solutions that require weeks of setup and specialized expertise, Middleware is built with developer experience as a priority:
- Quick deployment: Start monitoring server health within minutes of installation
- Minimal configuration: Auto-discovery reduces manual setup requirements
- Intuitive interface: Clean dashboards that don’t require training to understand
- API-first approach: Integrate with existing development workflows and tools
For a comparison of Middleware with other solutions, check our guide on Infrastructure Monitoring Tools.
FAQs
What are the most critical metrics I should track for server health?
Focus on metrics like CPU and memory usage, disk space, response times, uptime, error rates, and network connectivity. Tracking these core metrics will help catch most issues early before they become critical.. Don’t forget to monitor infrastructure dependencies like databases and third-party APIs, as they often cause problems before your server does.
How do I know which monitoring tool is right for my server health?
There are several factors to consider when choosing a monitoring tool. Important factors include your infrastructure size, technical expertise, and budget. Decide if you need basic resource checks or more detailed insights into application performance.
Also, look for tools that support your specific technology stack and offer alert integrations with your existing workflows (Slack, PagerDuty, etc.).
Middleware offers a developer-friendly solution with minimal setup. It specifically provides real-time server health tracking, deep application insights, and seamless integrations with popular tools.
Can server monitoring help prevent security breaches?
Yes. But it’s one layer of defense, not a complete security solution. Server monitoring can alert you to unusual patterns like failed login attempts, unauthorized access, or traffic spikes, all of which could signal a breach. While it’s not a replacement for security tools, it gives you visibility that can help you respond faster to threats.
However, dedicated security tools like SIEM systems or endpoint detection provide more comprehensive threat detection.
What’s the risk of false positives in alerts, and how can I reduce them?
False positives are one of the biggest challenges in monitoring – they cause alert fatigue, reduce team responsiveness, and can mask real issues. To reduce them, first baseline your “normal” server behavior instead of using default thresholds. Fine-tune alerts based on these baselines, using multiple severity levels and time-based conditions. Configure your system to group related alerts or suppress redundant notifications. Finally, regularly review your alerts and adjust rules as your infrastructure evolves.
What role do logs play in server health monitoring?
Logs provide detailed, behind-the-scenes information about what’s happening on your servers. As a result, they help you spot errors, understand system behavior, and troubleshoot issues faster. While metrics show you what is wrong, logs often tell you why.