Modern infrastructure continues to grow in complexity. Organizations now manage distributed services across multiple environments, generating vast amounts of machine data on a daily basis. Effective log management, performance monitoring, and issue detection have become essential operational requirements.
The leading solution in this field has become Splunk. It provides tools letting teams gather, index, and search machine data from almost any source. For many companies, though, even with its advantages, the complexity, implementation needs, and pricing structure make it unworkable.
In this post, we’ll explore several viable alternatives to Splunk. First, let’s define exactly what Splunk provides.
What is Splunk?
Splunk is a security and observability platform that offers a broad spectrum of tools for quickly and at scale gathering and evaluating data. It gathers and indexes vast volumes of log data from many sources—log files, metrics, APIs, cloud platforms, network devices, apps, websites, and servers. This helps you spot trends, find anomalies, track systems, and raise operational performance.
Once data is entered, Splunk organizes it so that it can be searched without reference to a conventional database. The search language (SPL) enables you to run searches that examine events, system faults, or performance trends. Additionally, supporting real-time monitoring, alerting, and visual dashboards enables teams to make data-driven decisions, leveraging data.
Key features
- Real-time search and analysis: Quickly identify patterns and issues using Splunk’s SPL query language.
- Dashboards and visualizations: Create custom dashboards and charts to visualize data.
- Alerting: Set up alerts for specific conditions, such as system slowdowns or security breaches, to ensure timely notification.
- Security monitoring: Monitor for threats and ensure compliance with Splunk’s SIEM capabilities.
- Scalability: Manage large volumes of data from cloud, on-prem, or hybrid environments.
- Flexible data ingestion: Collect data from logs, metrics, APIs, and cloud services.
Why do people look for Splunk alternatives?
The excellent features of Splunk do not make it the perfect solution for your team because specific limitations drive users to find alternative tools that match Splunk’s functionality. Here are some of the reasons:
- High Costs
Splunk’s licensing model can be prohibitively expensive, especially at scale. Pricing is based on data volume, making large deployments costly. Many organizations seek more affordable solutions with predictable pricing.
- Steep Learning Curve
SPL (Splunk’s query language) is a powerful tool, but mastering it requires specialized skills and training, making it non-intuitive for new users.
- Complexity
Splunk’s setup and configuration can be overwhelming, requiring significant infrastructure management and dedicated administrators. For organizations with basic logging needs, their enterprise features may be excessive.
Posts from the splunk
community on Reddit
- Open-source preference
Many organizations prefer open-source alternatives due to their flexibility, transparency, and the ability to modify the solution to suit specific needs.
Is Splunk going to fall behind due to AI advances?
byu/SearchForAgartha inSplunk
Top Splunk Alternatives
We have now seen what Splunk does and why it may not be the right fit for everyone. Let’s look at some Splunk alternatives. These tools offer similar capabilities but differ in pricing, setup, and flexibility.
1. Middleware
Type: Commercial (Freemium Available)
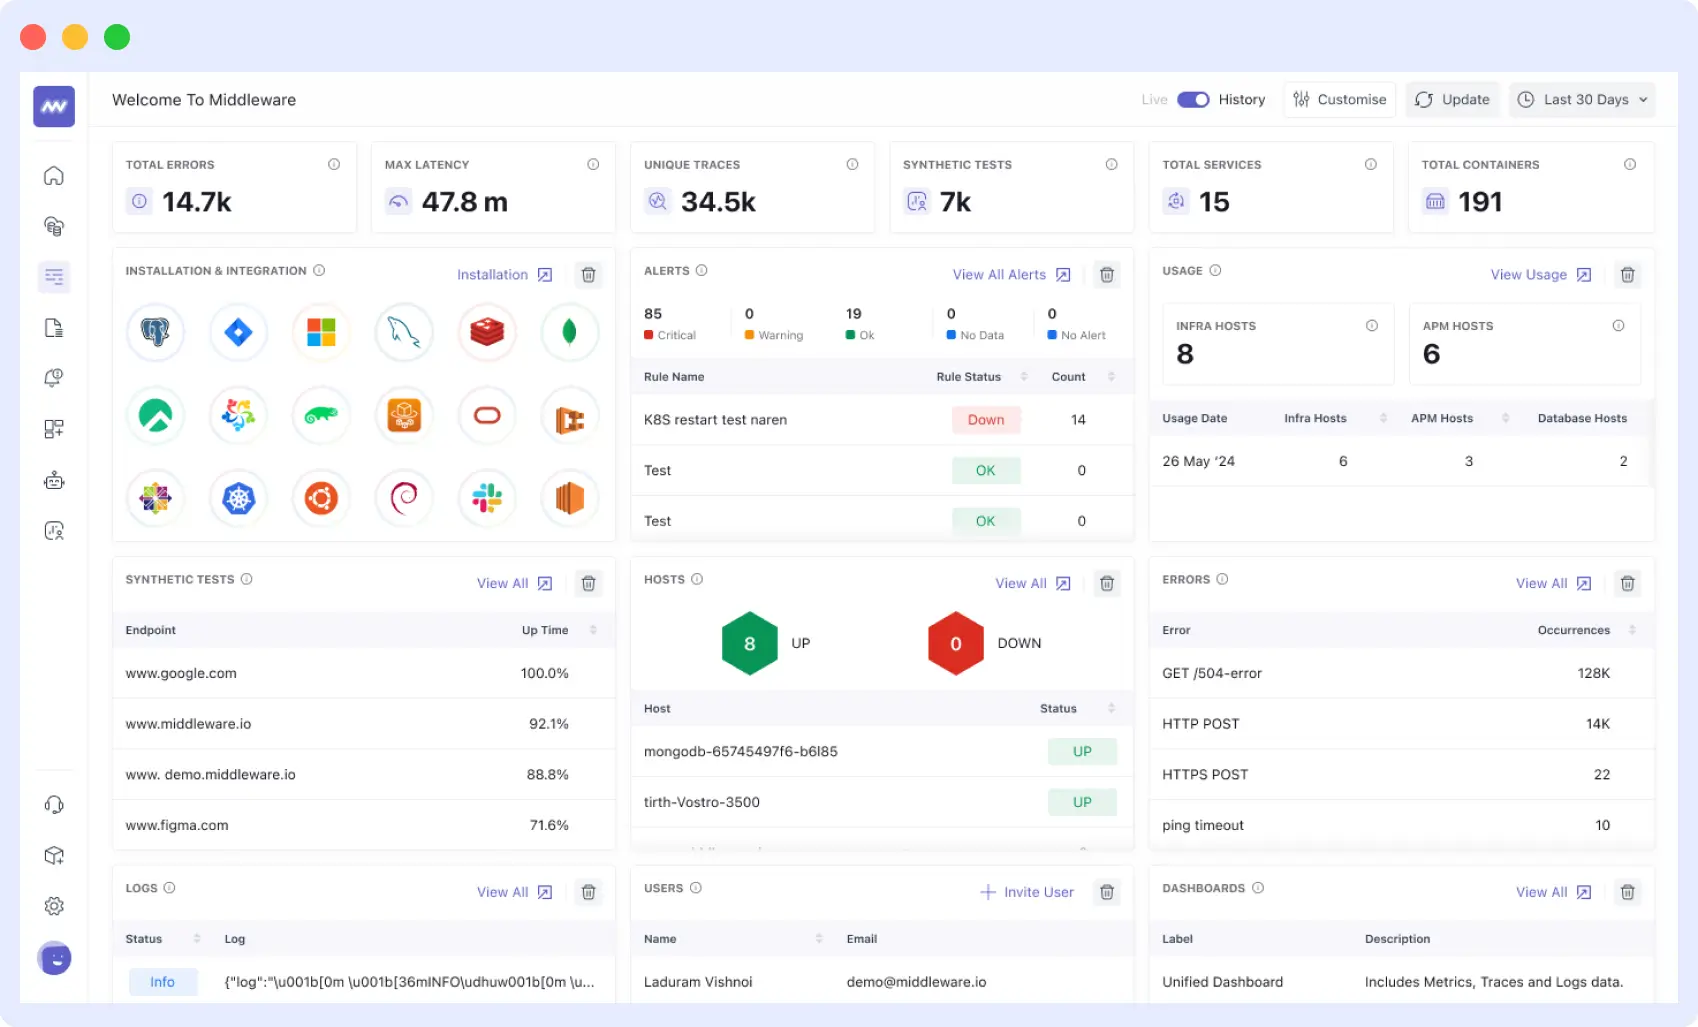
Middleware is a full-stack observability platform that provides real-time monitoring and actionable insights across infrastructure systems, applications, and databases. Teams can optimize system performance and reliability for traditional infrastructures, to containerized and serverless architectures.
Middleware, often evaluated among Splunk competitors, eliminates real latency issues by identifying performance problems faster with features like Infrastructure Monitoring, APM dashboard, Database Monitoring, and Log Monitoring. It features a zero-second cold start and utilizes AI-based analytics to take proactive measures and address problems.
Middleware consolidates all monitoring capabilities into a simple dashboard that you can use to gain full insights while enhancing operational effectiveness.
Key Features
- Unified Observability: Gain complete insights by integrating logs, metrics, traces, and events from all your infrastructure, applications, databases, and user interactions.
- Real-Time Monitoring: Monitor the actual performance and health condition of the system in real-time and receive alerts about critical issues.
- Custom Dashboards and Alerts: Build your views to monitor specific metrics and issues in your operations.
- LLM Observability: You can monitor, troubleshoot, and optimize your LLM applications in real-time.
- Browser Testing: Monitor and analyze user activities and performance across the website and in applications
- Wide Range of Integrations: With over 200 integrations, including AWS, Docker, Kubernetes, and more. Middleware easily integrates into your workflow.
Pricing
- Free Tier
- Pay-As-You-Go: Starting at $0.30 per GB of data ingested, offering flexibility based on your usage needs.
- Custom Plans: Available for larger enterprises or specific needs, including extended data retention and priority support.
Why Choose Middleware?
- All-in-One Platform: Combines APM, infrastructure, and log monitoring, eliminating the need for separate tools.
- AI/LLM Observability: Offers advanced AI and Large Language Model observability, a rare feature in monitoring tools.
- Freemium Option: Unlike strict trial models, Middleware offers a free tier for users to explore core features before committing.
2. Better Stack
Type: Commercial (Freemium Available)
Better Stack is an observability platform that helps teams monitor logs, metrics, and uptime from a single interface. It offers real-time alerting, customizable notifications, and powerful dashboards. As a Splunk alternative, It combines two key products: Logtail, a log management solution built on ClickHouse that delivers fast, SQL-based log querying and secure data handling; and Better Uptime, which provides uptime monitoring, incident management, on-call scheduling, and status pages.
Key Features
- Fast, SQL-powered log management with Logtail
- Uptime monitoring for apps, APIs, Cron jobs, and websites
- Incident management with on-call schedules and escalations
- AI-based alert noise reduction and incident silencing
Pricing
- Free Plan
- Pay-As-You-Go Plan: Starting from $29/month (annually)
- Additional Usage-Based Pricing depending on the specific usage (e.g., log data, monitors, status pages, alerting, etc.
3. Graylog
Type: Open-core (free OSS version + paid commercial tiers)
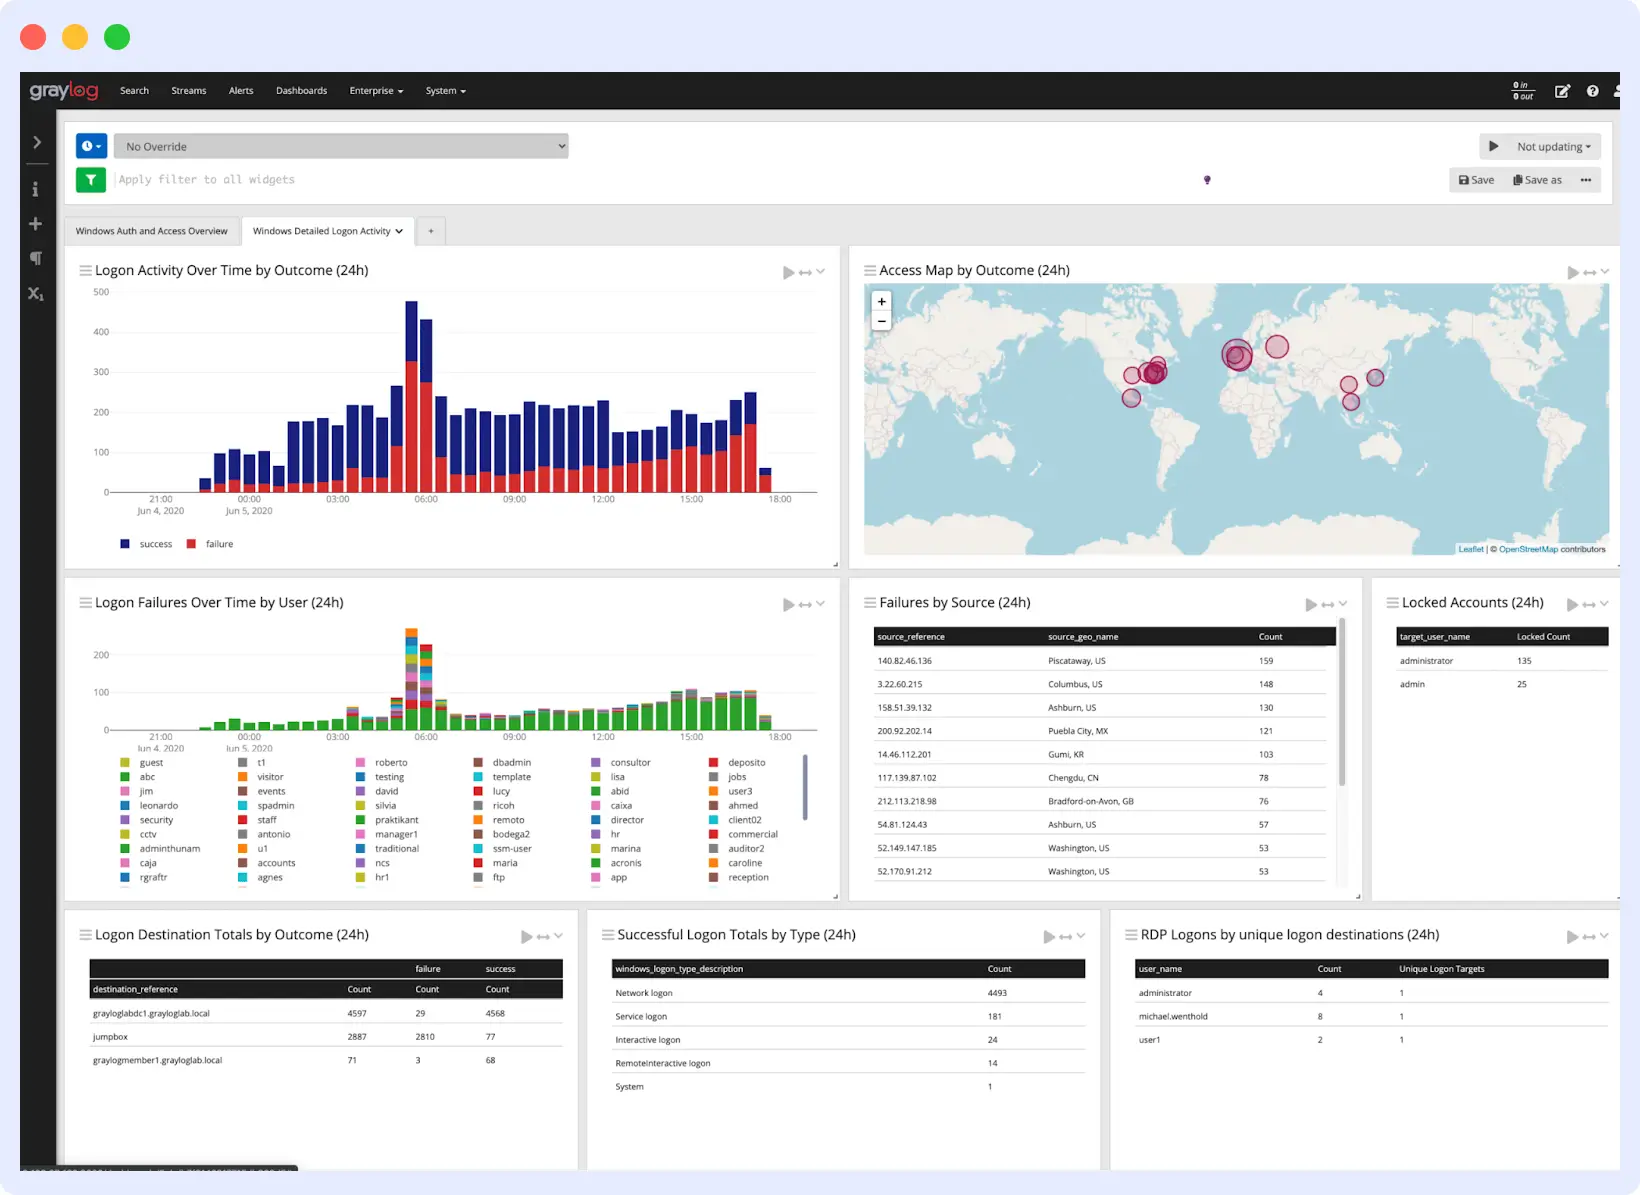
Graylog is a centralized log management system and Security Information and Event Management (SIEM) solution that serves IT operations and DevOps teams, and security professionals. The platform enables real-time log analysis combined with alerting and visualization features, which enhance system monitoring and troubleshooting capabilities. It is considered a reliable Splunk alternative by many organizations.
The Graylog product line includes four solutions: Graylog Open for open-source log management, Graylog Enterprise for enhanced observability and scaling, Graylog Security for SIEM capabilities, and Graylog API Security for protecting and monitoring your APIs. The system scales to process big data volumes and supports integration with multiple systems and platforms.
Key Features
- Through Role-Based Access Control (RBAC), Graylog enables users to control data access permissions and user permissions management.
- It offers anomaly detection, helping you spot unusual patterns in your log data.
- The platform features risk management capabilities, enabling you to assess and prioritize security risks.
- You can create custom reports and dashboards to visualize key insights from your log data.
Pricing
- Free Plan:
- Graylog Open: Free for basic log management with no additional costs.
- Graylog Small Business: Free for up to 2 GB/day, with additional features available.
- Enterprise Plans:
- Available for larger Enterprise.
4. Grafana
Type: Open-core (free OSS version + paid commercial tiers)
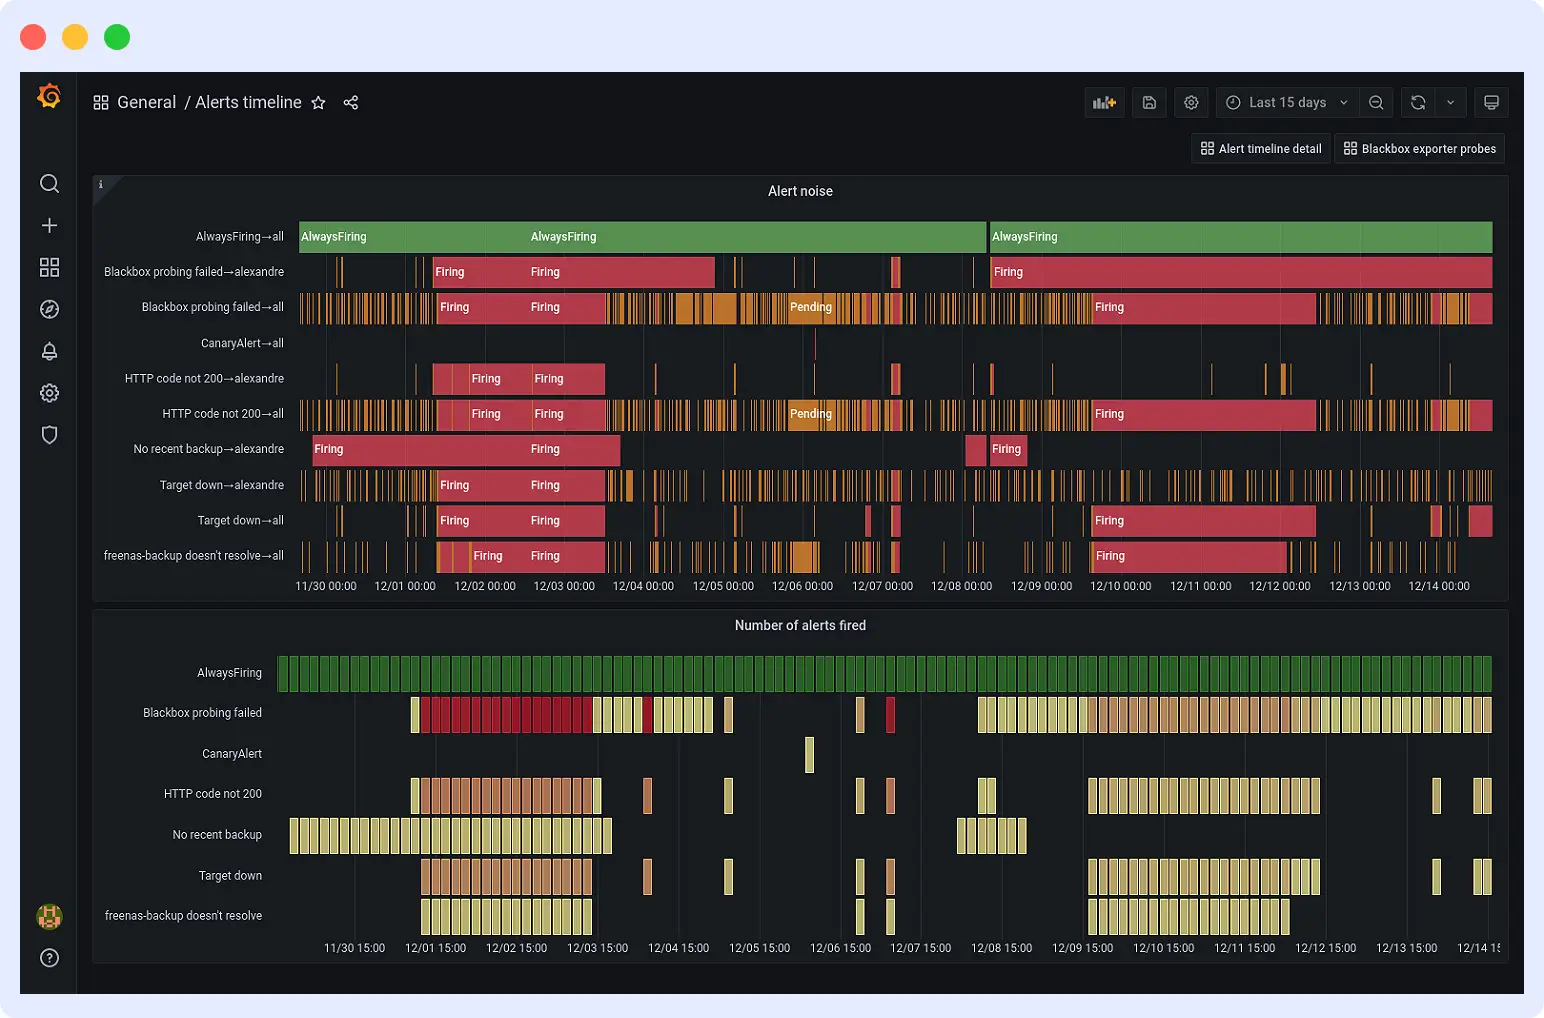
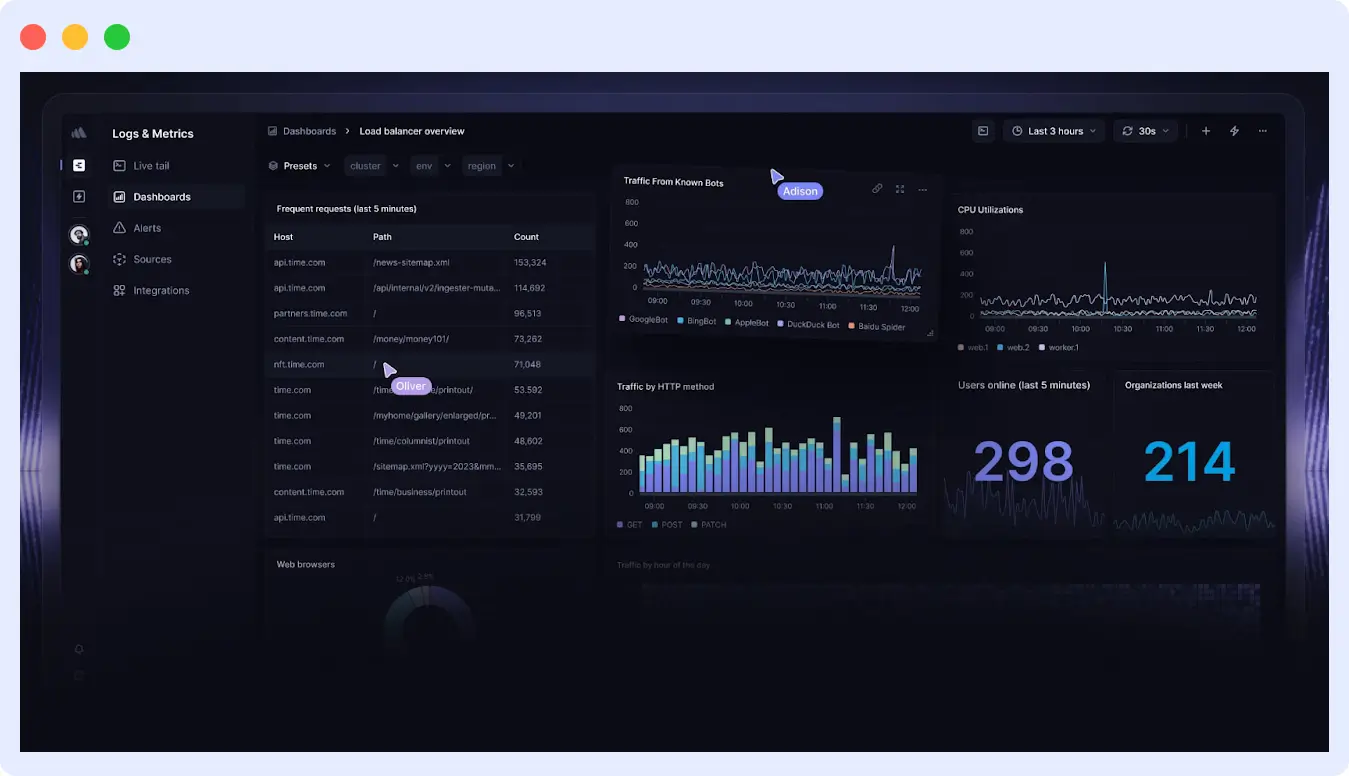
Grafana is an open-source observability platform that delivers advanced monitoring features. Users can use Grafana to view and analyze data that originates from Prometheus, InfluxDB and Elasticsearch sources. As a popular Splunk open source alternative, users can achieve better system performance understanding through Grafana by designing customized dashboards that utilize visualization tools.
Grafana’s real-time alerting system enables teams to respond immediately to system problems. The platform operates through a plugin system, which allows users to link their system to multiple data sources, thus becoming the main monitoring tool for infrastructure and application performance.
Key Features
- Users can construct interactive dashboards through the platform, which supports various visualization tools, including graphs and gauges, and heatmaps.
- The system integrates smoothly with data sources including Prometheus, InfluxDB, and Elasticsearch.
- The system provides alerting functionality which delivers notifications through email and Slack and PagerDuty, and other services.
- The system also provides user authentication through LDAP and OAuth, and other provider options.
Pricing
- Free Open Source Version (self-hosted)
- Free Cloud Tier (limited metrics/logs)
- Pro (Pay as you go): Starts at $19/month
- Advanced (Premium Bundle): Starts at $299/month
- Enterprise: Custom pricing (contact sales)
5. Datadog
Type: Commercial (14 days free trial available).
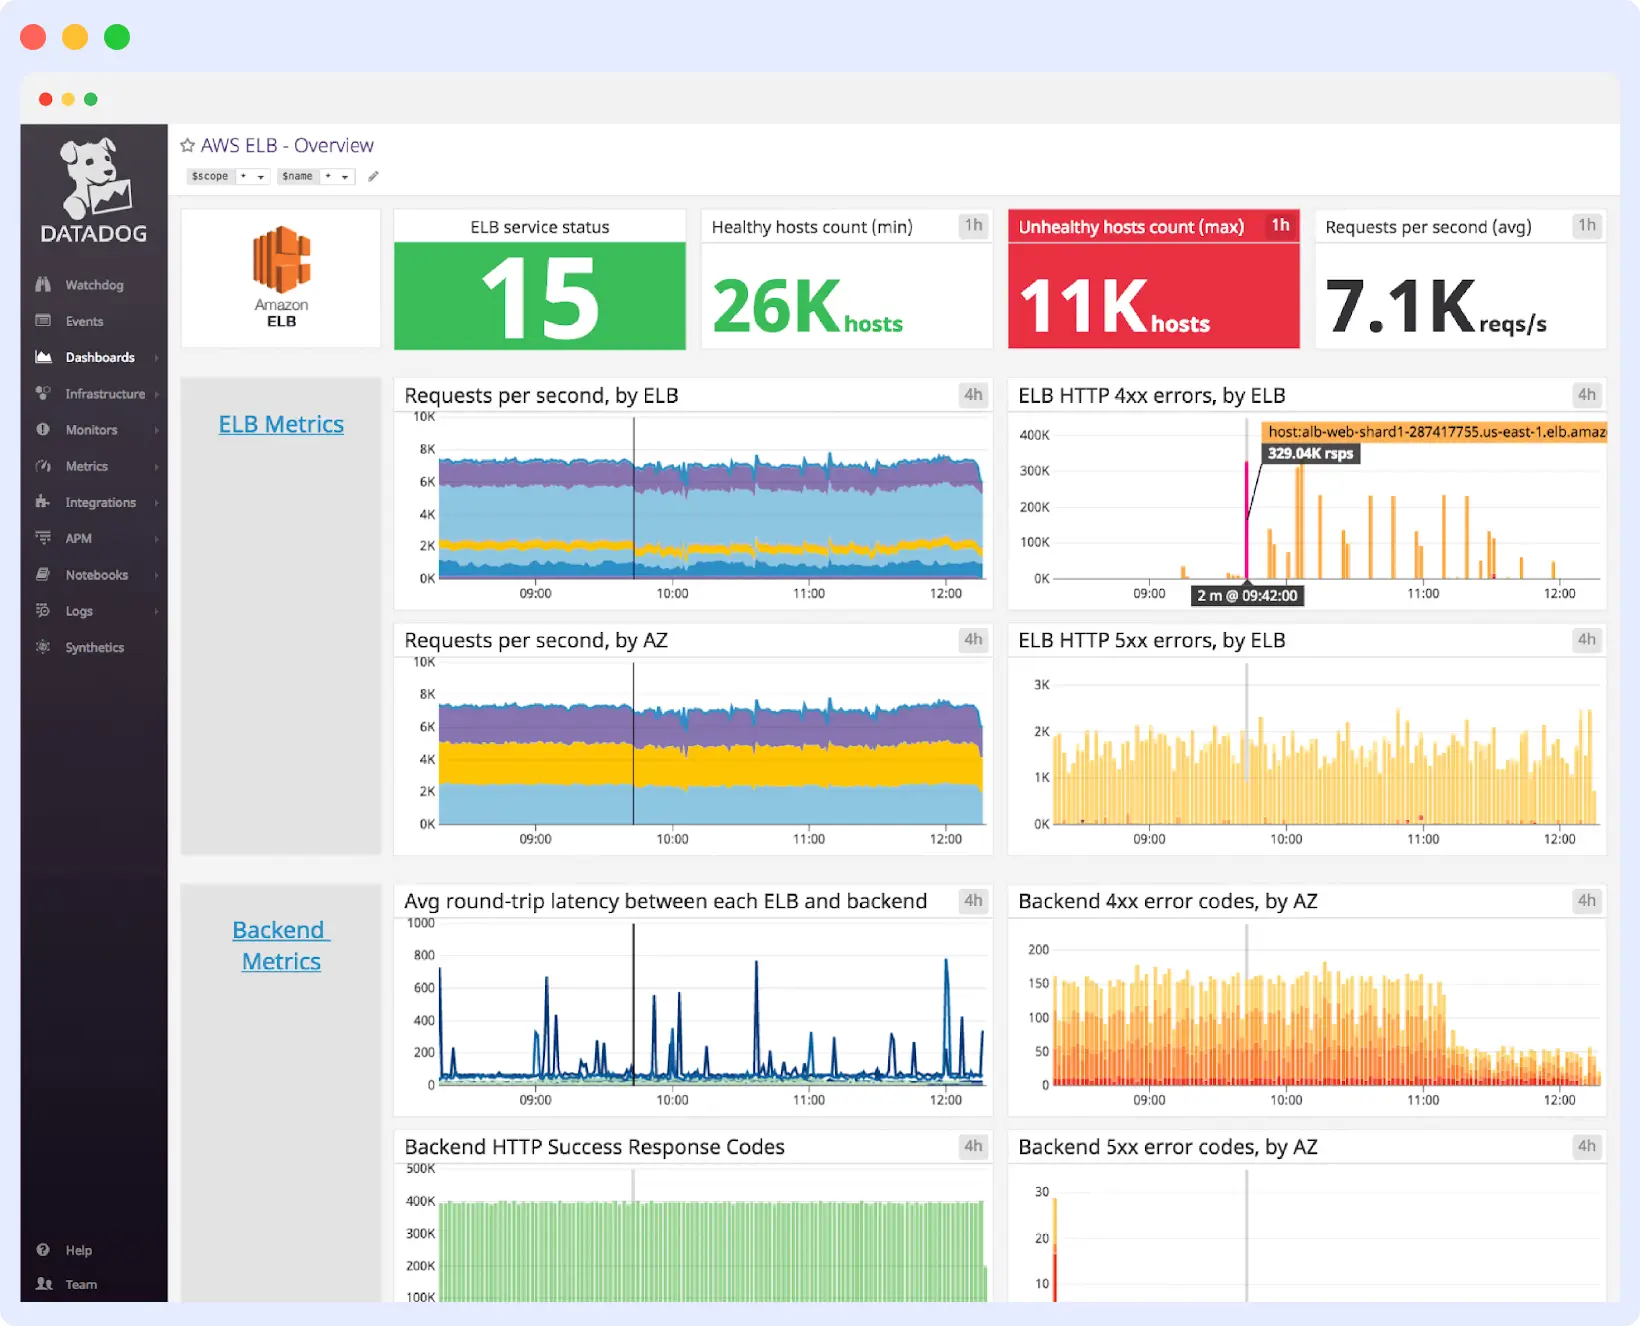
Datadog is an observability platform that provides complete monitoring capabilities. The platform integrates infrastructure with application performance and log management to support modern cloud-native environments.
Among leading Splunk competitors, Datadog delivers comprehensive system health insights through its real-time monitoring capabilities and AI-based anomaly detection and automatic alerting features. Users can customize their data visualization through the platform while it supports connections to more than 450 different technologies.
Key Features
- The platform monitors servers and containers, and cloud services through its infrastructure monitoring capabilities.
- Application Performance Monitoring (APM) with distributed tracing
- Real-user monitoring (RUM) for frontend performance
- Users can build personalized shareable dashboard visualizations through an intuitive drag-and-drop interface.
- The platform delivers real-time monitoring capabilities together with alerts and anomaly detection through machine learning technology.
Pricing
- Free Tier: Limited to 5 hosts, 1-day data retention
- Pro Plan: $15/host/month
- Enterprise Plan: $23/host/month
6. Dynatrace
Type: Commercial
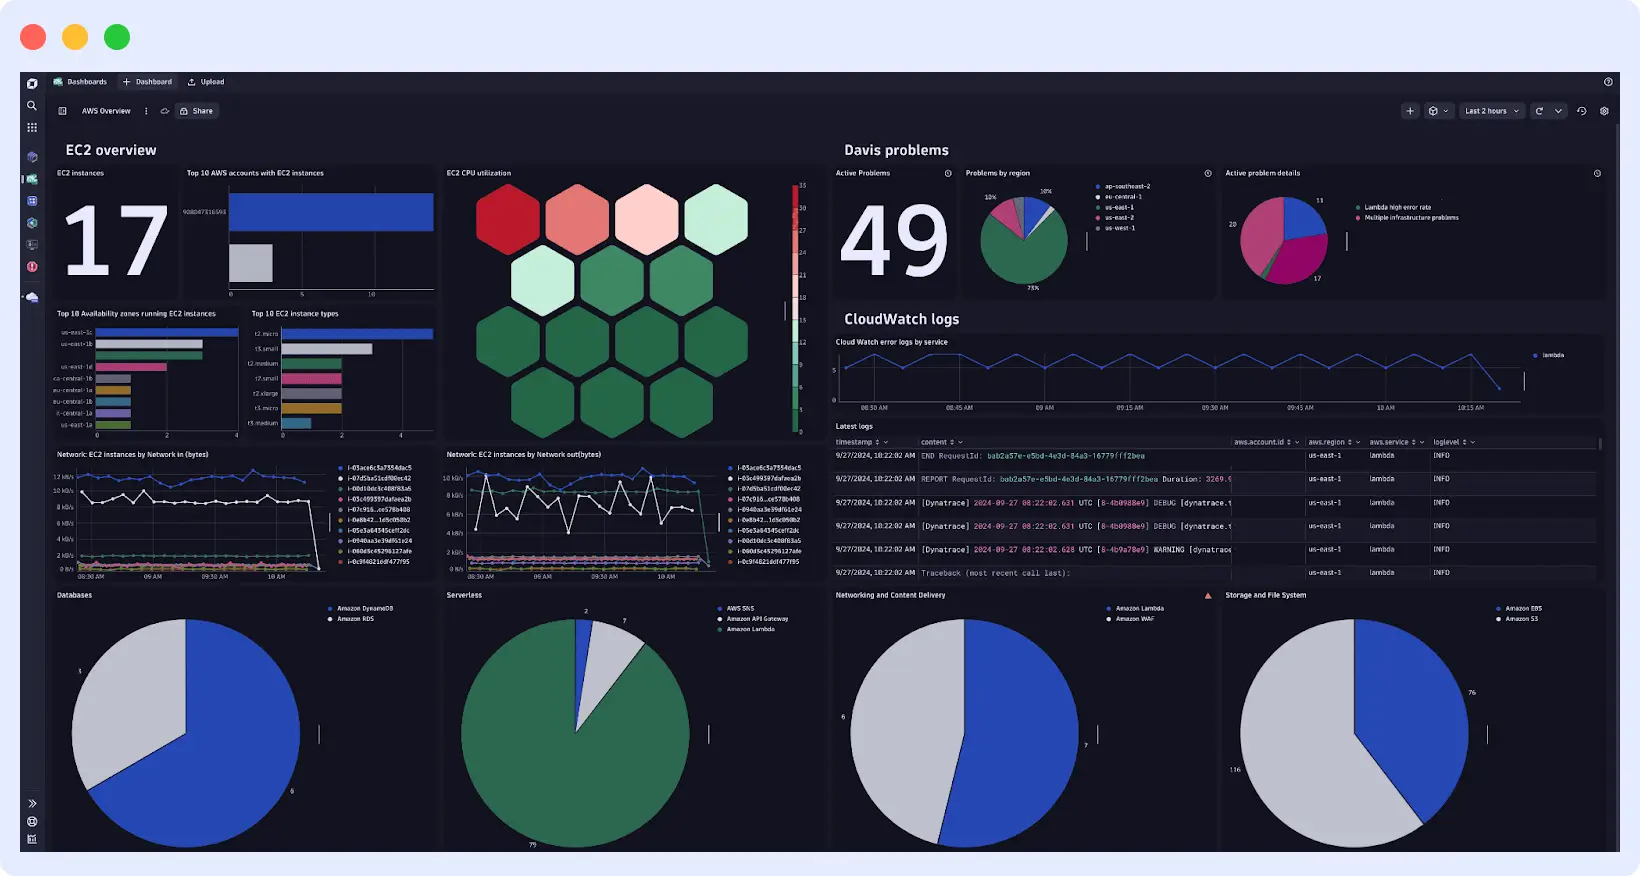
Dynatrace is the all-in-one Observability platform that gives users a deep, accurate insight into systems, logs, infrastructures, and applications. It provides AI-driven insights via its Davis AI engine, which detects anomalies, identifies root causes, and prioritizes issues on the fly.
Among leading Splunk competitors, Dynatrace offers capabilities such as application performance monitoring, infrastructure monitoring, digital experience monitoring, and log analytics, Dynatrace delivers end-to-end visibility to optimize system performance.
Key Features
- Auto-discovers all services, containers, and infrastructure dependencies in real time.
- AI-powered root cause analysis (Davis AI) suggests fixes for issues.
- Built-in application security (RASP) detects runtime vulnerabilities.
- Combines real-user monitoring (RUM), synthetic tests, and session replay.
Pricing
- Full-stack monitoring: $0.08 per hour for an 8 GiB host.
- Infrastructure monitoring: $0.04 per hour for any size host.
- Kubernetes platform monitoring: $0.002 per hour for any size pod.
- Application security: $0.018 per hour for an 8 GiB host.
- Real User Monitoring: $0.00225 per session.
- Synthetic monitoring: $0.001 per synthetic request.
- Log Management & Analytics: $0.20 per GiB for ingest & process; $0.02 per GiB-day for retention with included queries.
7. Elastic Stack
Type: Open-core (free OSS version + paid tiers)
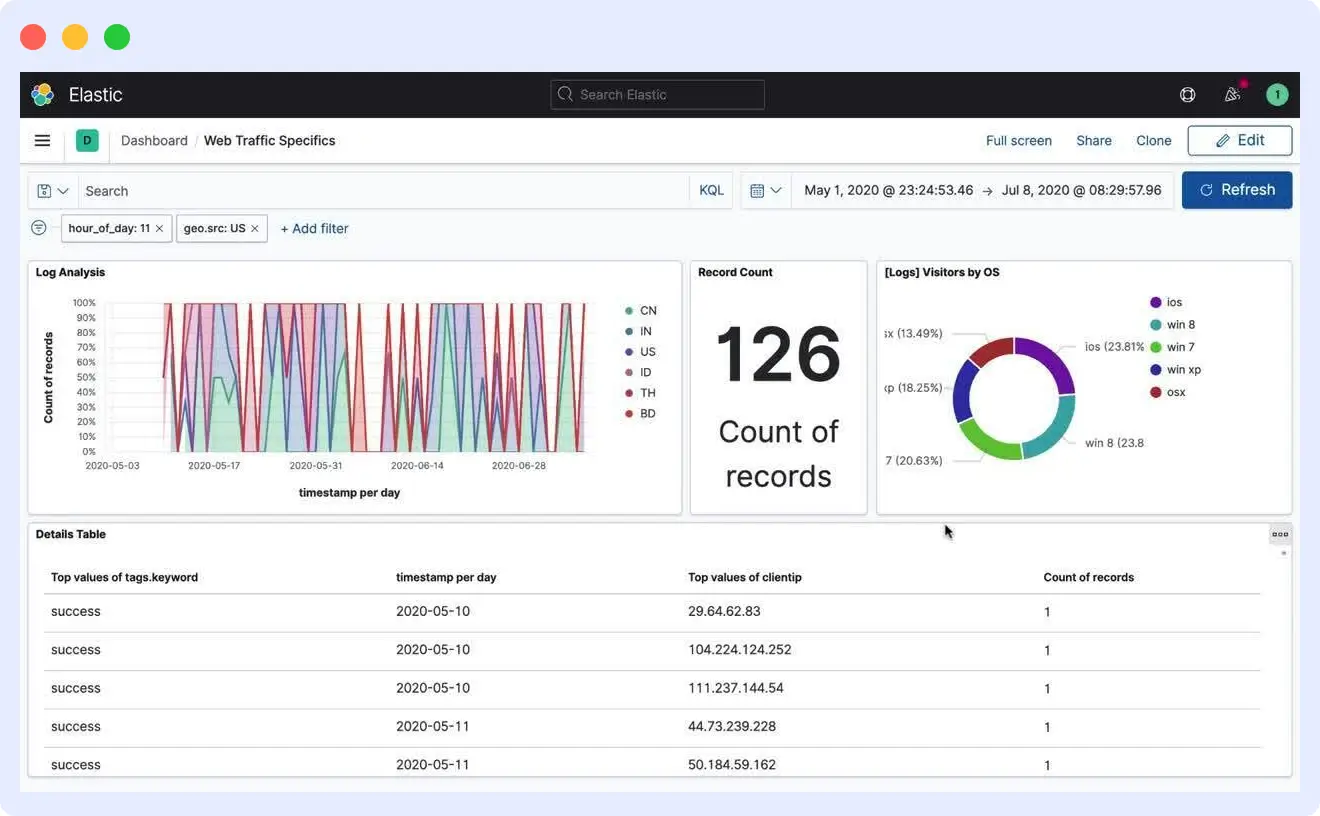
The Elastic Stack (or ELK stack) is an open-source collection of tools, all developed by Elastic, that takes in data from a variety of sources, in multiple formats, and allows for a flexible way of searching data in real time. Its primary use is for log analysis, full text search, security analytics, and business intelligence, making it a popular open source Splunk alternative.
The stack is made of four main parts:
- Elasticsearch: A distributed, RESTful search and analytics engine capable of storing and indexing data at scale.
- Logstash: A Data Pipeline that collects data from multiple sources, processes it, and sends it to Elasticsearch.
- Kibana: A visualization tool for exploring data and building interactive dashboards.
- Beats: Lightweight agents that ship operational data to the stack.
These tools combined offer a unified solution to handle and analyze big data in real time.
Key Features
- Sensitive data is protected in part by built-in security elements, including audit logging, encryption, and role-based access control.
- Alerting and monitoring tools provided by the stack let users be informed depending on system faults or predefined criteria.
- Machine learning features let users automate analysis, trend prediction, and anomaly detection.
- Application metrics, traces, and performance data are tracked by the capabilities of application performance monitoring (APM).
- It offers SIEM tools and security analytics to assist in detecting threats, vulnerabilities, and security incidents.
Pricing
- Open Source (Free): Includes core features only
- Paid Tiers
- Standard – as low as $95 per month
- Gold – as low as $109 per month
- Platinum – as low as $125 per month
- Enterprise – as low as $175 per month
8. SolarWinds
Type: Commercial
SolarWinds is an enterprise-grade monitoring solution specializing in IT infrastructure, network performance, and database monitoring. With a focus on on-premises and hybrid environments, SolarWinds provides deep visibility across networks, servers, applications, and databases through a suite of interconnected modules. It is recognized among the key competitors to Splunk in the monitoring and observability space.
Key Features
- Comprehensive network monitoring with topology mapping and traffic analysis
- Track performance across physical, virtual, and cloud servers
- Customizable alert management system
- NetFlow traffic analysis and bandwidth monitoring
- Specialized views for VMware and Hyper-V environments
Pricing
SolarWinds offers different pricing models depending on the specific product and its capabilities. Pricing might differ based on whether you choose their SaaS-hosted solution or a self-hosted deployment.
9. New Relic
Type: Commercial (Free tier available)
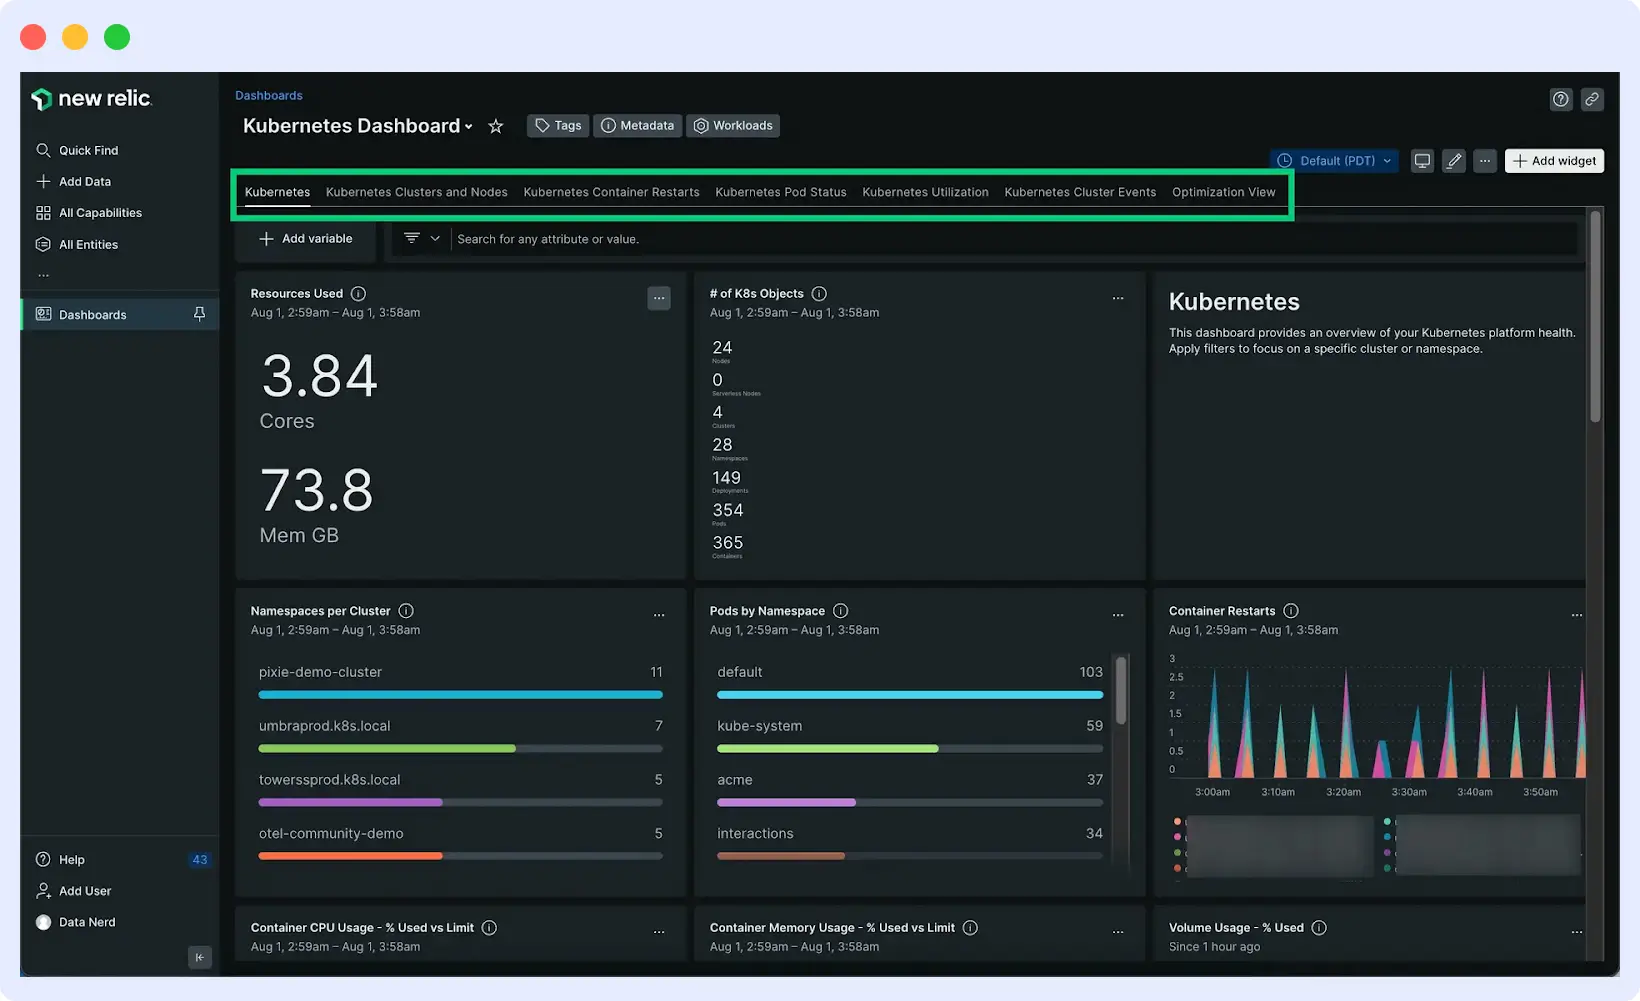
New Relic is a full-stack observability platform offering end-to-end monitoring for applications, infrastructure, logs, browser performance, and more. As a notable Splunk competitor, It features a unified dashboard and a powerful telemetry data platform to visualize, query, and analyze data from multiple sources.
Key Features
- Full-stack observability in a single, unified platform
- Application performance monitoring with code-level insights
- Real user monitoring for frontend performance analysis
- Infrastructure monitoring for hosts, containers, and serverless
- Integrates with over 700 cloud services and tools
Pricing
- Free plan: 1 free user with access to everything
- Standard plan: Limited to 5 full platform users
- Pro: Unlimited full platform users.
- Enterprise: Everything in Pro plus other features
10. SigNoz
Type: Open-source (Self-hosted & Cloud options)
SigNoz is an open-source observability platform built with developers in mind. It supports distributed tracing, metrics, and logs all in a single interface. As an effective alternative to Splunk, SigNoz is OpenTelemetry-native and offers flexible deployment options (self-hosted or managed cloud). It provides a Prometheus-like query builder, intuitive dashboards, and seamless integration with modern cloud-native stacks.
Key Features
- Full-stack observability with metrics, traces, and logs in one platform
- OpenTelemetry-native monitoring infrastructure
- Customizable dashboards with drag-and-drop functionality
- End-to-end distributed tracing and service maps
- Set up alerts based on traces, metrics, or logs with Slack, PagerDuty, and webhook integrations
Pricing
- Free: Fully open-source version (self-hosted)
- Teams – Starts at $199/month
- Enterprise – Starts at $4000/month
Comparing Splunk Alternatives
| Features | APM | Infra Monitoring | Log Management | RUM | AI/ML Features | Limitations |
| Splunk | ✓ | ✓ | ✓ | ✓ | Commercial | Very expensive at a large scale |
| Middleware | ✓ | ✓ | ✓ | ✓ | ✓ | Newer in the market |
| Better Stack | ✓ | ✓ | ✓ | ✗ | ✗ | Basic log analytics capabilities |
| Graylog | ✗ | ✓ | ✓ | ✗ | ✓ | Fewer Built-in Enterprise Features |
| Grafana | ✓ | ✓ | ✓ (via add-ons) | ✓ (via add-ons) | ✓ (via add-ons) | Depends on external data sources |
| Datadog | ✓ | ✓ | ✓ | ✓ | ✓ | Complex and expensive pricing |
| Elastic stack | ✓ | ✓ | ✓ | ✓ | ✓ | Steep learning curve |
| Dynatrace | ✓ | ✓ | ✓ | ✓ | ✓ | High cost for full-stack use |
| Solarwinds | ✓ | ✓ | ✓ | ✓ | ✓ | Can Be Costly for Full Observability |
| New Relic | ✓ | ✓ | ✓ | ✓ | ✓ | Unpredictable costs at scale |
| Signoz | ✓ | ✓ | ✓ | Limited | Limited | Limited integration ecosystem |
Conclusion
In this post, we’ve explored several Splunk alternatives that offer different approaches to log management and observability. No single solution works for everyone – your choice should align with your team’s technical requirements, available budget, and in-house expertise. While Splunk remains a powerful option, its pricing and complexity may not be practical for every use case.
“Compared to other observability solutions, Middleware offered similar or even superior capabilities at a much lower cost, eliminating the need for expensive tiered pricing or additional charges for advanced features. This made Middleware a more accessible and scalable solution for a business like ours. In fact, we were able to reduce our costs by 75%.”
Krishna Charan BS, Information Security Head, MindOrigin
For businesses looking for full-stack, modern observability without the high expense or challenging learning curve, Middleware is an appealing option. Under a simple, unambiguous pricing structure, it integrates real-time monitoring, AI-driven insights, and user-friendly dashboards. Growing teams find middleware particularly appealing because of its freemium tier, which provides an affordable starting point with the ability to scale as needs grow.
Finding a solution that integrates easily into your workflows and offers the insights required to maintain dependable systems is crucial, regardless of the solution you ultimately decide on.