Your current monitoring setup is costing you more than the monthly cloud subscription fee. Every minute of downtime you miss, unresolved issues, and every hour your engineers spend troubleshooting tools instead of building features your customers actually want. These hidden costs accumulate, draining resources that should be allocated to building and improving your workflow.
Want to see how observability can slash IT spend? Check out our guide: 8 Ways to Reduce IT Costs with Observability.
Switching tools can feel risky, with new configurations, team training, and workflow adjustments. But the long-term payoff is worth it.
This guide walks you through the first four weeks of switching to Middleware, showing exactly how teams move from uncertainty to real, measurable results.
Why Switch to Middleware?
Switch to Middleware for unified observability, AI-powered insights, and predictable pricing. Reduce alert noise, catch issues before users notice, and scale effortlessly as workloads grow. With quick setup, full-stack visibility, and proactive support, your team saves time, cuts costs, and gains actionable insights fast.
Let’s look at some of those issues and then see how Middleware solves them:
High and Unpredictable Costs
Excessive and unpredictable costs can result in unexpected bills that are difficult to justify as data usage increases. Some teams have even reported being overcharged by their current provider.
For example, a Reddit user shared that Datadog billed them for on-demand usage despite reserving capacity, resulting in a significant overcharge.
💰For a deeper dive into this problem, check out our guide on Datadog pricing pitfalls
Middleware addresses costs by offering predictable and transparent pricing, with many teams reducing costs by up to 75 percent.
👉Curious why many businesses are leaving Datadog behind? See how they’re migrating to Middleware: read the migration story
Alert Noise and False Positives
Too many false alerts create constant noise, making it difficult to distinguish between real problems and minor issues. Engineers often spend more time investigating alerts than addressing the root causes of the issues.
🚨Features like commit ownership and error tracking make it easier to trace issues back to the responsible code, helping teams cut through noise and resolve problems faster.
Middleware utilizes AI-powered intelligence to detect anomalies early, filter out false alerts, and enable teams to focus on the issues that truly matter.
Complex Setup
Implementing traditional monitoring tools can be time-consuming and require specialized expertise. Teams often take days and weeks to configure agents, dashboards, and alerts, which postpones your ability to translate data into actionable insights.
Middleware simplifies implementation with expedited onboarding, pre-configured dashboards, and automatically managed integrations, so your team can focus on effective monitoring from day one. Additionally, we have a separate onboarding team to assist you at every step, ensuring you get the most value out of Middleware.
Correlating Logs, Metrics, and Traces
One of the greatest challenges with observability is linking logs, metrics, and traces. If you can’t correlate anything, you cannot swiftly ascertain the root cause of a problem.
Middleware addresses this challenge by providing users with a unified dashboard that combines all data types, enabling teams to monitor dependencies, identify anomalies across the stack, and resolve issues more quickly.
Proactive Issue Resolution
Your customers shouldn’t be your first line of defense. When teams are forced to react to customer complaints, it’s a clear sign that a monitoring tool is failing.
Middleware provides end-to-end visibility across your stack in logs, metrics, traces, and user monitoring, allowing your teams to see and resolve issues ahead of time, thereby preventing them from affecting users.
Scales with Your Growth
As workloads grow, infrastructure monitoring tools that once worked begin to lag. They are slow for large data sets, high traffic, and complex systems, and teams are stretched to the limit to reach reliability.
Middleware is designed to handle the complexity and scaling of today’s cloud-native applications. We are a quick and reliable platform with real-time monitoring, so your team always has the data needed to address system performance problems before they occur.
Teams facing high costs and alert fatigue often wonder if switching to a new tool is worth it. Mind Origin experienced firsthand how Middleware delivers value without hidden fees.
They shared:
“Compared to other observability solutions, Middleware offered similar or even superior capabilities at a much lower cost, eliminating the need for expensive tiered pricing or additional charges for advanced features. This made Middleware a more accessible and scalable solution for a business like ours. In fact, we were able to reduce our costs by 75%.”
Krishna Charan BS, Information Security Head, MindOrigin
Now that you know how Middleware addresses these common challenges, here’s what the first four weeks with the platform look like in practice.
The First 4 Weeks with Middleware
Day 0 – Kickoff and Onboarding
Getting started with Middleware begins with a guided onboarding process that takes you through each step. First, you’ll connect your data sources by identifying your key applications, databases, and infrastructure components that need monitoring.
Middleware’s setup helps you prioritize which systems to connect first, typically starting with your most critical services.
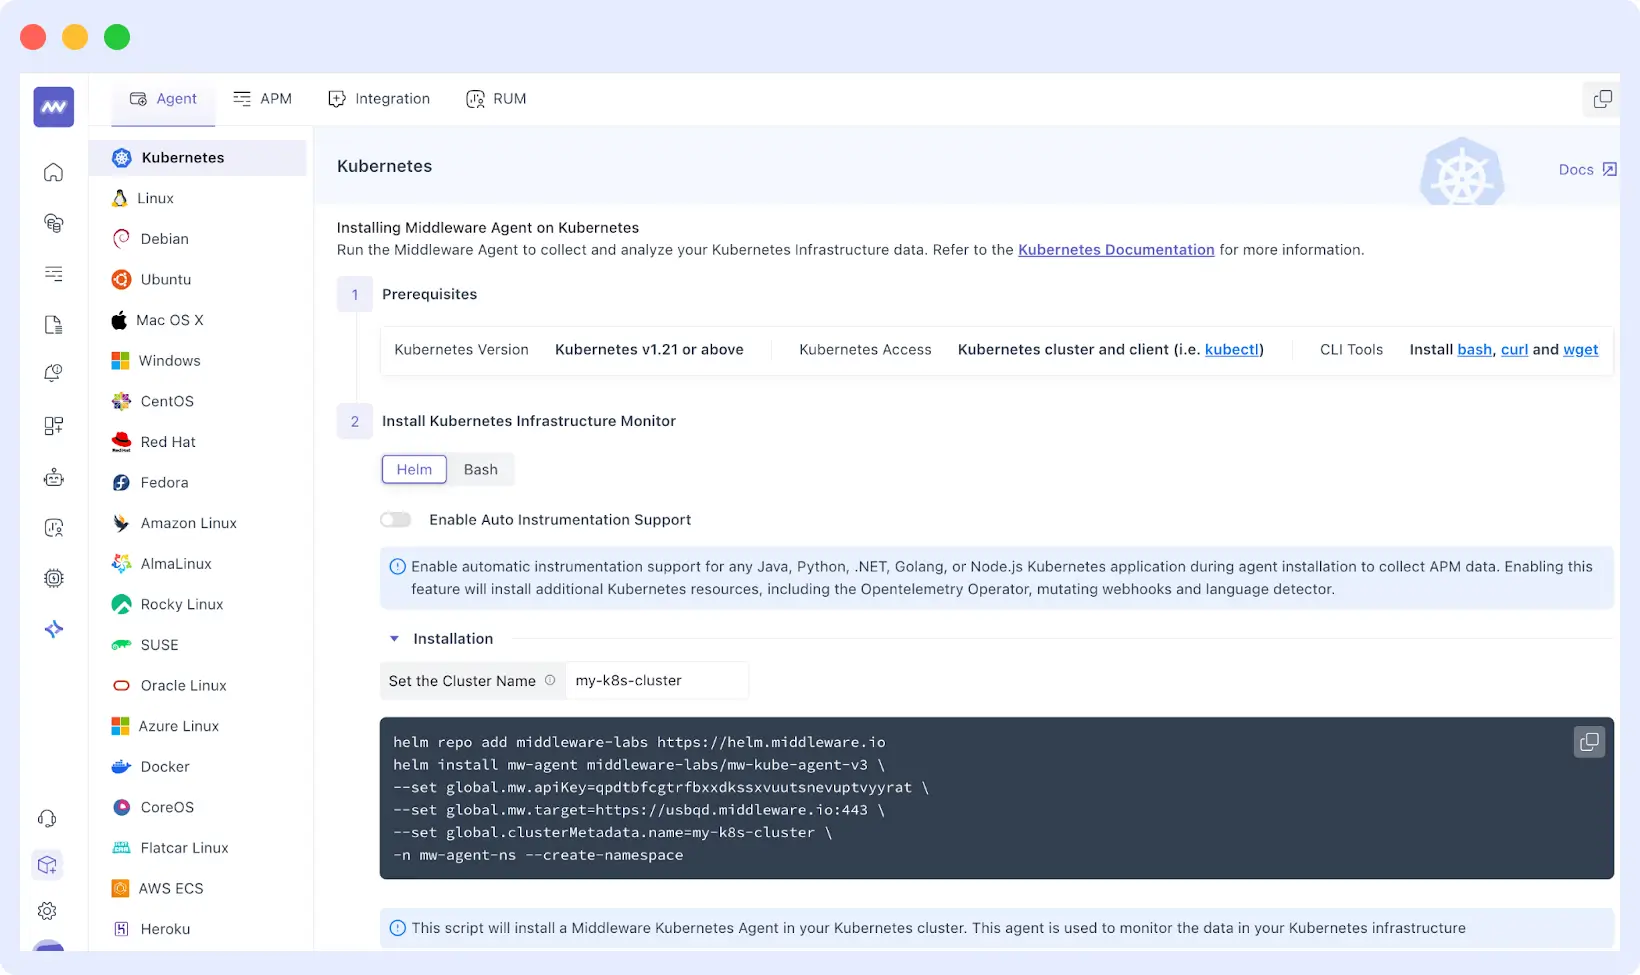
Installing the agent is a swift and straightforward process. You download a lightweight agent, configure it with your environment details, and establish secure connections to Middleware’s platform.
The agent starts collecting logs, metrics, and traces immediately without requiring complex configuration files or manual setup scripts.
You can verify your data flow in real time. You’ll see confirmation that your services are correctly connected, data is being collected, and dashboards are populating with actual metrics from your environment. This verification step ensures that everything works correctly before you proceed.
Dedicated support is available throughout this entire process, with response times and access levels depending on your plan. Enterprise accounts get a named Customer Success Manager or Technical Account Manager who understands your specific setup and can provide personalized guidance.
Standard plans provide access to the general support team through multiple channels, including in-app chat, email, Slack, and Microsoft Teams.
💬 Join our Slack community to connect with Middleware users, ask questions, and get tips from our support team in real time. Join Now→
Most teams choose to run Middleware alongside their existing monitoring tool initially. This parallel approach lets you validate that Middleware captures the same data and provides the visibility you need without any risk to your current operations.
By the end of the day, your system will be completely integrated, and your team will be ready to capture insights immediately. However, your existing monitoring remains untouched until you’re confident in the transition.
Week 1 – Getting Full Visibility
Your first week with Middleware focuses on getting one core service fully monitored and visible. You can start by connecting your most critical application or service, typically including the main web application, primary API, or core database.
Connecting this service involves installing the Middleware agent on your servers or containers and configuring it to collect the data types you need. The agent automatically discovers your application’s architecture, identifies key components such as databases and external APIs, and begins collecting logs, metrics, and distributed traces.
You configure which log files to monitor, set metric collection intervals, and enable tracing for requests flowing through your system.
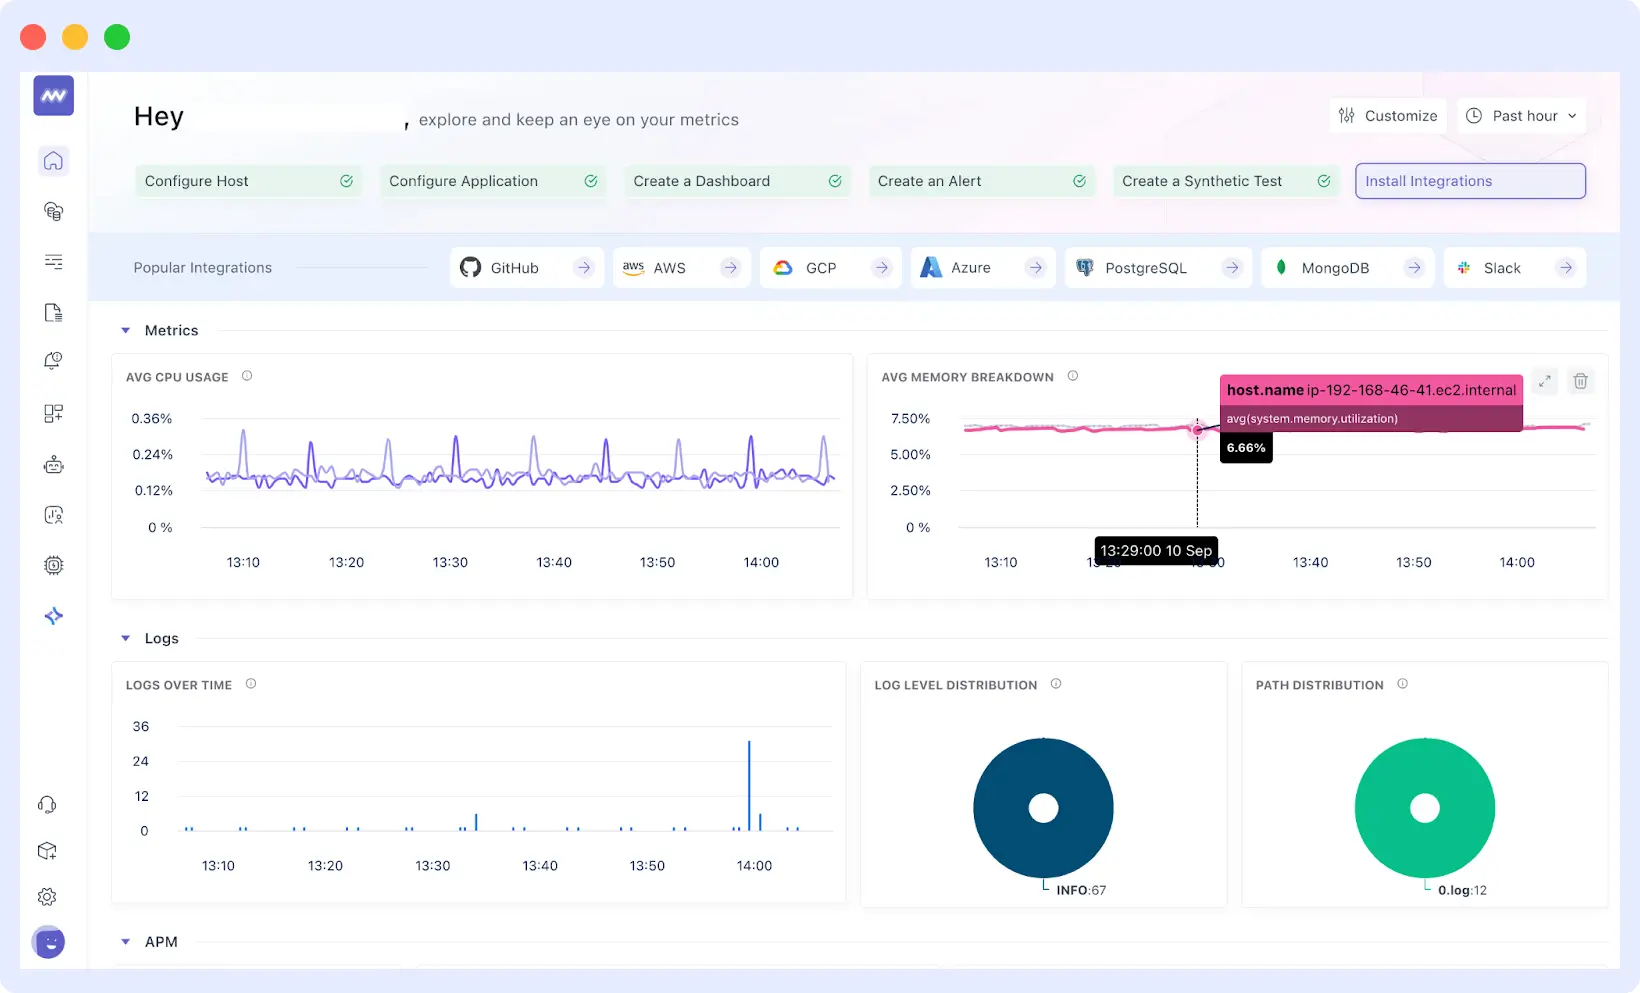
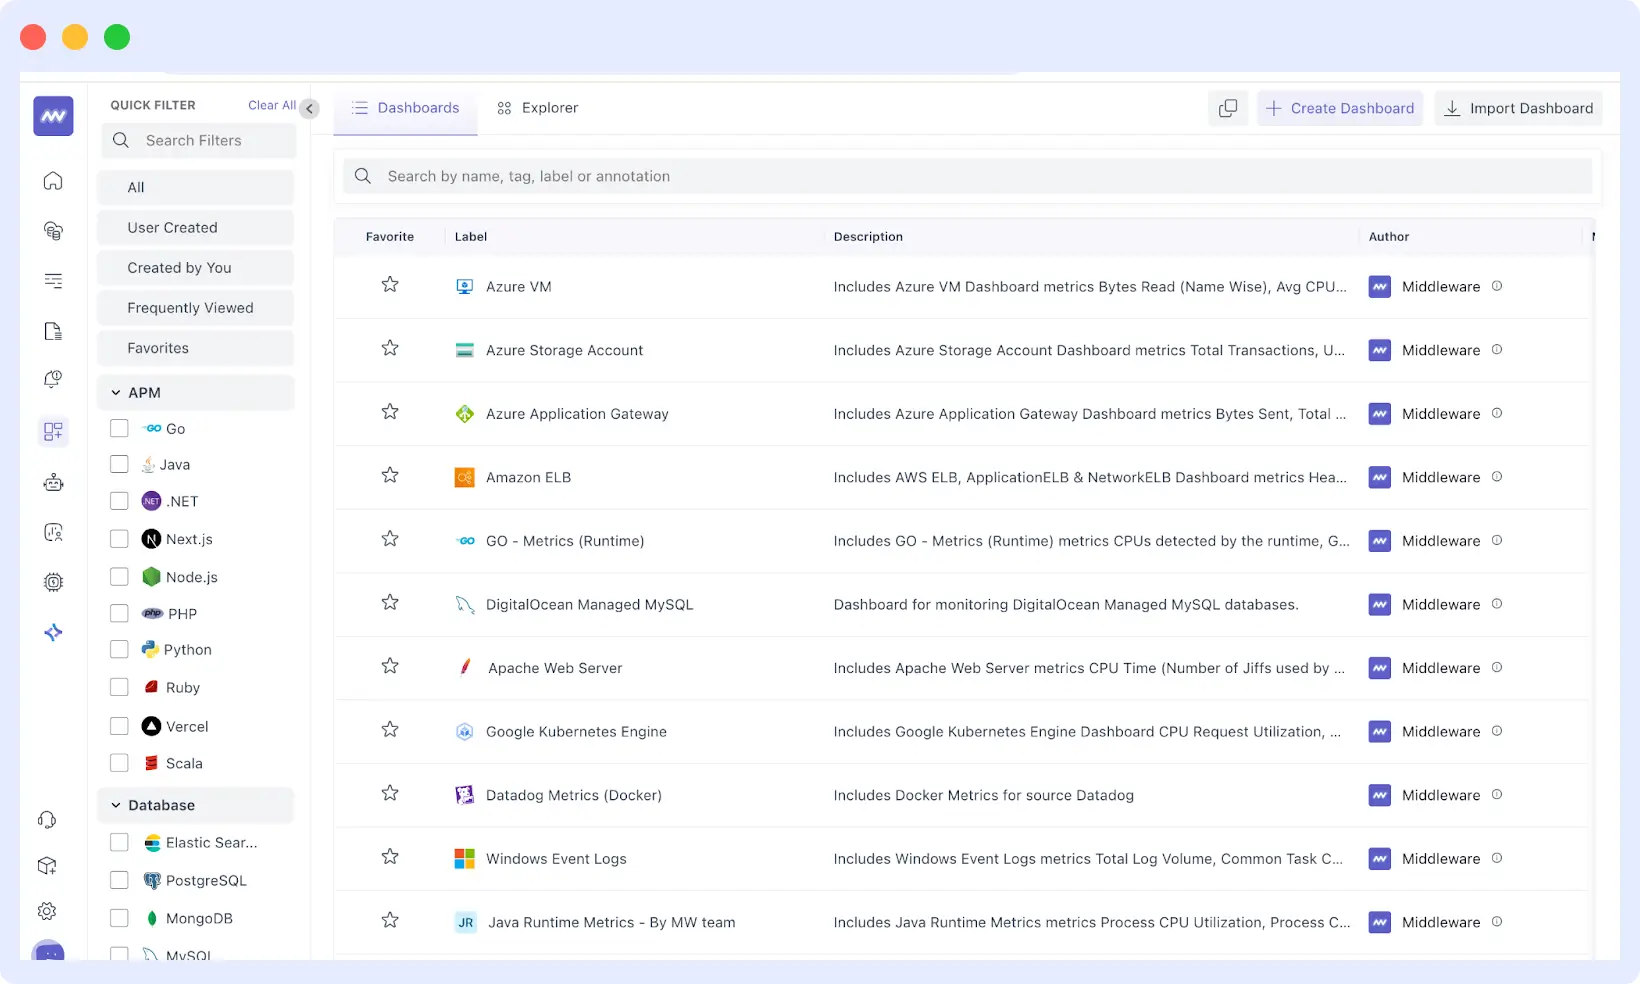
Pre-built dashboards provide you with immediate insights, eliminating the need for hours of custom view development. Middleware organizes your data into logical dashboard layouts based on your application type. Web applications often include dashboards that display response times, error rates, and throughput.
Databases get query performance, connection pools, and resource utilization views. These dashboards show the metrics teams typically track for each service type, making performance patterns and issues immediately visible.
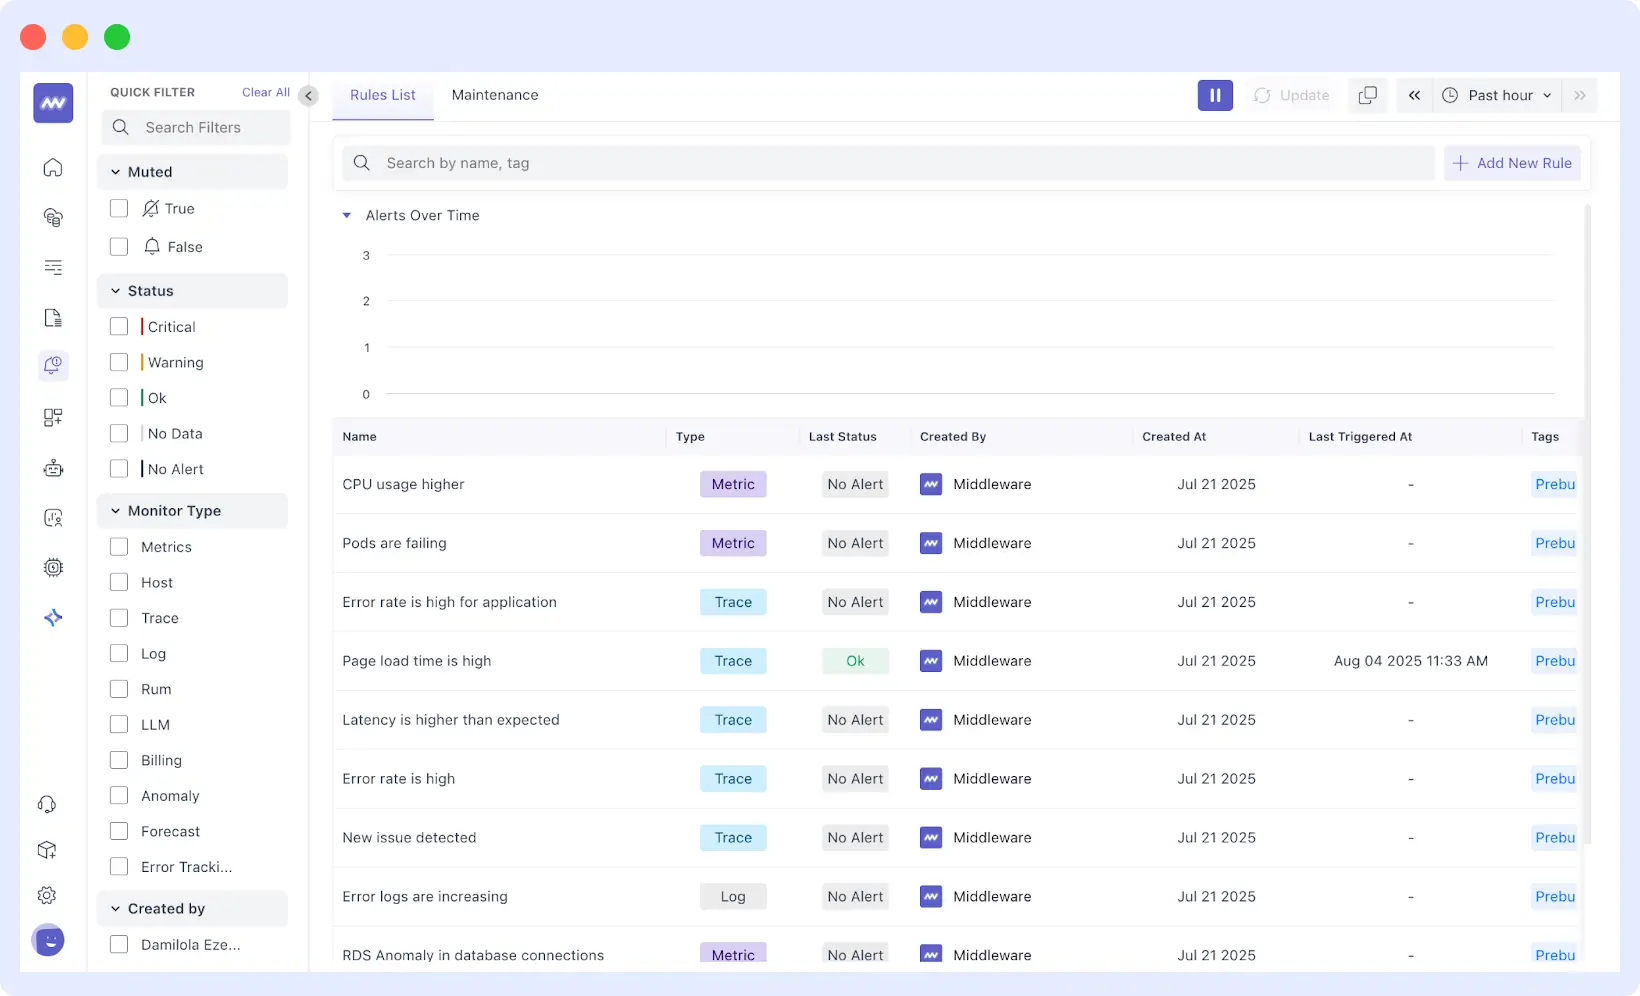
Next, set up your first critical alerts, considering those that have a significant impact on business operations, such as application downtime, error spikes, or sluggish response times that affect user experience.
Middleware provides intelligent alert templates tailored to your service type, allowing you to customize thresholds based on your application’s normal behavior patterns.
The full benefit becomes clear when you correlate logs, metrics, and traces. As soon as an alert goes off, you instantly know what metrics came up, what logs indicate errors, and what requests went through your system.
Outcome by the end of Week 1: Unified visibility for a core service, first actionable alerts, less noise, and faster triage.
Start configuring your first alerts today to see real-time insights and reduce noise instantly. 👉Set Up Alerts
Week 2 – Smarter Insights, Less Noise
Week two focuses on expanding monitoring coverage and reducing unnecessary alerts. Connect additional critical services, covering databases, caches, queues, or other infrastructure that supports your core application. The goal is comprehensive coverage of your most important systems.
Each new service follows the same agent installation process, but now you’re building a comprehensive view of component interactions. You’ll see how database query performance impacts API response times, how cache hit rates affect overall system performance, and when queue backlogs signal potential bottlenecks before they become user-facing problems.
Middleware’s AI-powered anomaly detection learns what’s normal for each service and alerts you only when something genuinely unusual happens, like response times staying elevated outside of peak hours or error rates spiking without corresponding traffic increases – you get notified.
👉 See Middleware Ops AI in action – detect anomalies early and reduce alert noise: Learn more →
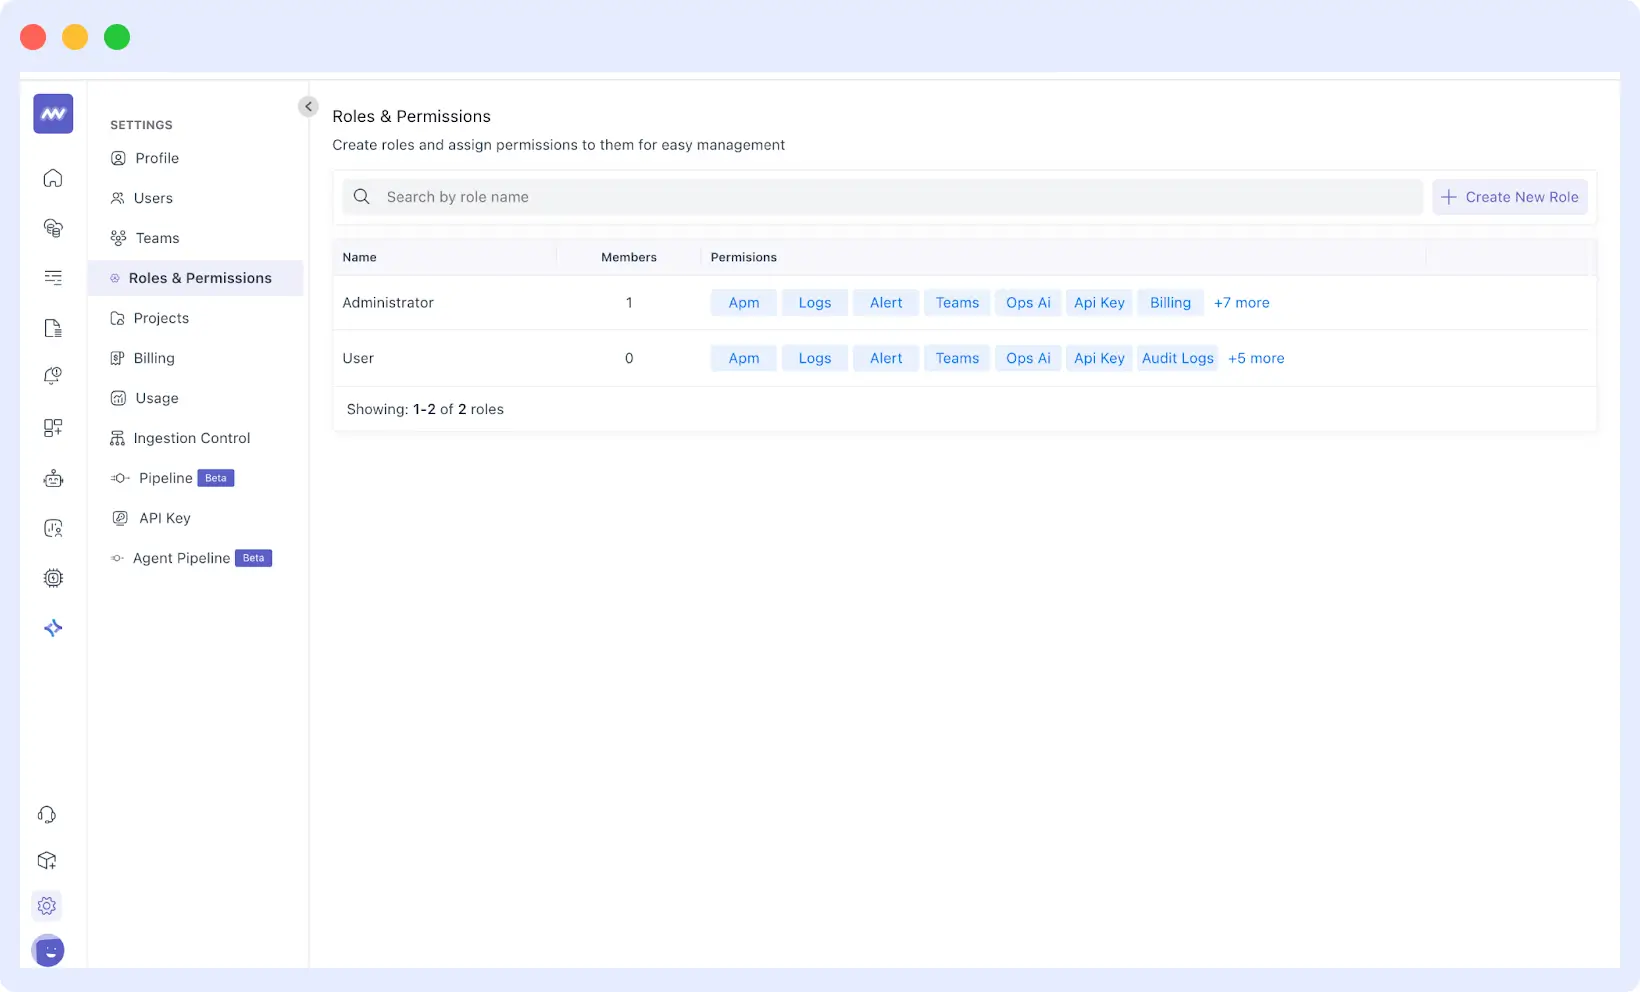
Role-based permissions also enable each team member to see the exact data they need for their work. Developers gain code-level visibility with stack traces, database query performance, and application-specific metrics to optimize their code.
Operations teams focus on infrastructure health, server performance, network connectivity, and resource usage that affect reliability. Engineering managers get high-level service health dashboards, SLA tracking, and productivity metrics. Each dashboard and alert preference aligns with real responsibilities and decision-making needs.
Custom dashboards become essential as you expand monitoring across more services. Backend teams require visibility into database performance, API response times, and server utilization. Frontend developers care about browser performance, JavaScript error rates, and CDN reliability.
SREs prioritize reliability indicators, deployment impact, and capacity planning. With tailored dashboards, each team can quickly assess system health without having to filter through irrelevant data.
Outcome by the end of Week 2: Reduced alert noise, proactive issue detection, and team-specific access that keeps everyone focused on what matters most.
Week 3 – Advanced Features & Collaboration
By week three, your foundational monitoring is solid and your team trusts the platform’s alerts. You can now explore advanced features that provide deeper system insights and integrate Middleware into your existing workflows and tools.
Application Performance Monitoring (APM) provides visibility into how requests flow through your applications. Middleware’s APM traces user requests across microservices, databases, and external APIs, helping your team pinpoint slow queries, misconfigured services, or performance regressions introduced during deployments.
Engineers identify the exact component causing bottlenecks and take action, rather than spending hours guessing where issues originate.
Synthetic monitoring enables continuous testing of your applications from external locations, simulating real user interactions before actual users encounter issues.
You can set up synthetic tests to verify critical user flows, such as login processes, checkout workflows, and API endpoint availability. Receive immediate notifications when these functions fail or perform poorly.
🔍 Monitor Every User Interaction and ensure critical workflows like logins, checkouts, and APIs perform flawlessly before issues reach your customers.
These tests run continuously, catching issues during off-hours, maintenance windows, or deployment rollbacks when your team isn’t actively monitoring.
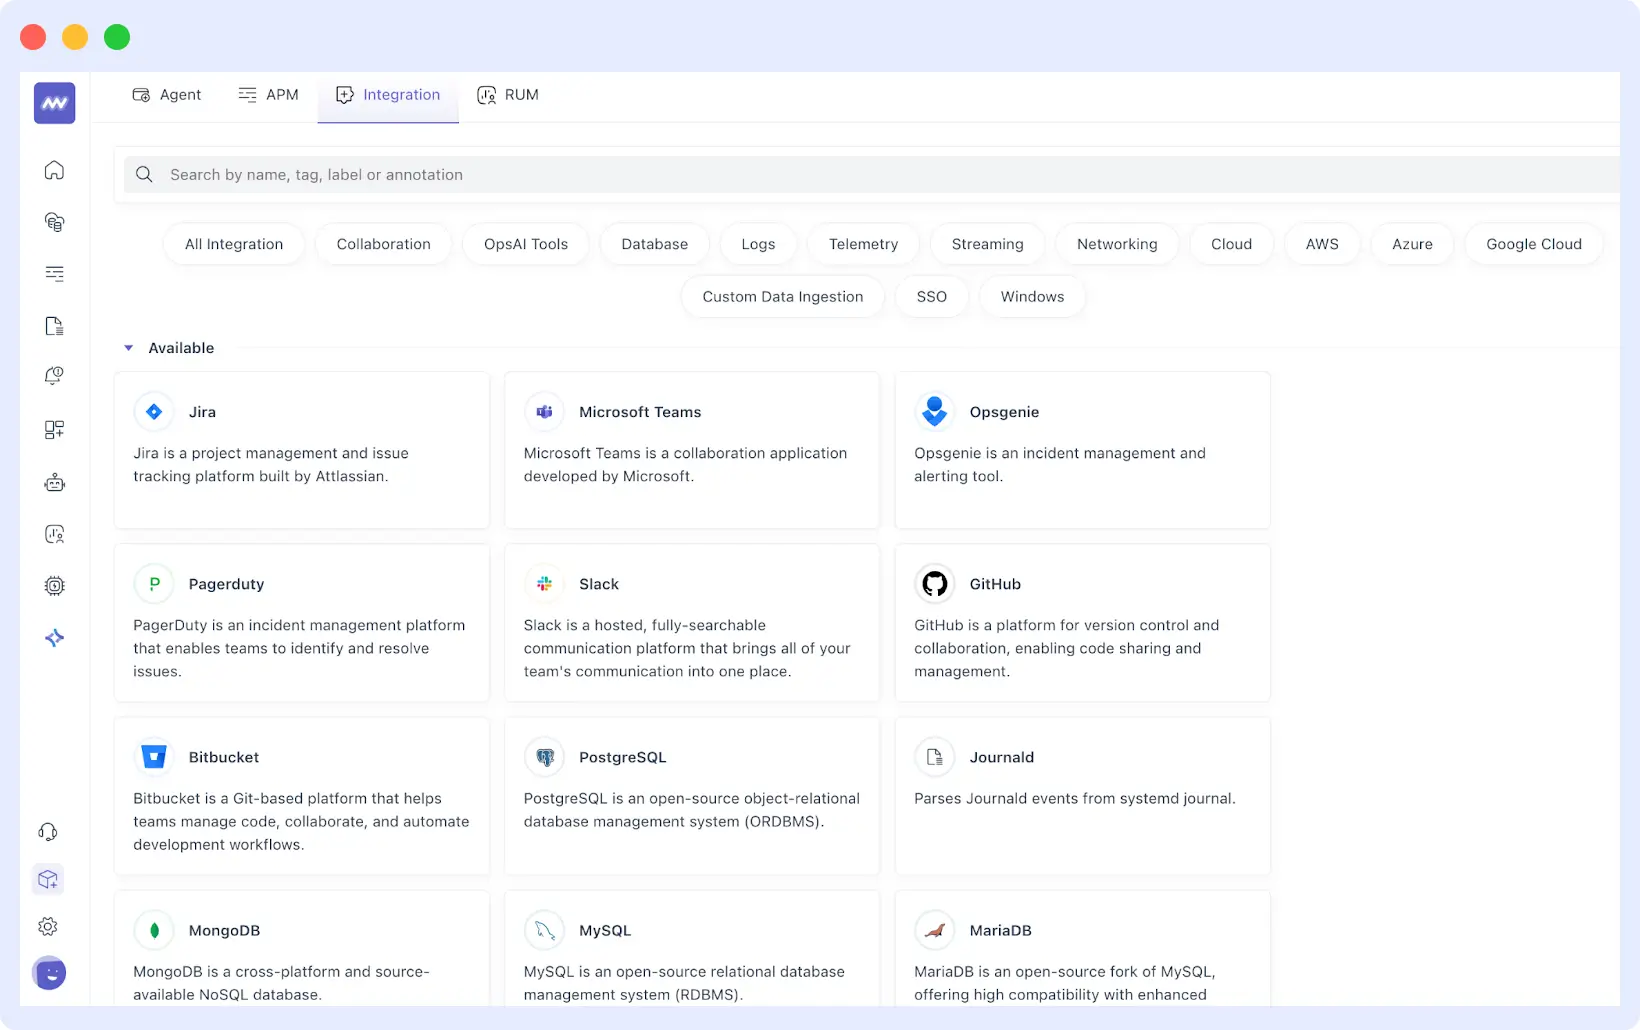
Integrations with existing tools keep your workflows running smoothly and uninterrupted. We offer over 200 integrations, including Slack, PagerDuty, and Jira. Middleware routes alerts and incidents directly into the tools your team already uses.
Critical alerts can post directly into Slack channels, PagerDuty can manage your on-call rotations, and Jira can automatically log incident tickets to track progress and resolution history.
This week also includes a deeper dive into Middleware’s interface and advanced dashboard features.
Outcome by the end of Week 3: Complete observability coverage, seamless integration with team workflows, and advanced monitoring capabilities that provide deeper system insights.
Week 4 – Optimization & Full Migration
With your team fully integrated, focus shifts from setup to using the Middleware for strategic improvements. You can identify and eliminate system bottlenecks, and with a unified view of your infrastructure, demonstrate quantifiable ROI through faster mean-time-to-resolution (MTTR) and reduced alert noise.
This is also when you’ll complete the migration by moving over any remaining services and finally phase out those old monitoring platforms. Configure automated incident response workflows based on three weeks of real data to reduce manual intervention.
Use insights to optimize performance and plan capacity. Generate ROI reports that show business impact by comparing current expenses to previous costs and engineering time savings.
Middleware support remains available, typically responding within 30 minutes during business hours, with resolutions normally achieved within 1–2 days.
Outcome by end of Week 4: Measurable ROI with legacy tools retired, team fully productive with automated processes in place, and data-driven insights for future planning.
This timeline outlines what to expect during your first month with Middleware. If you’re still having second thoughts, here’s what our customers have to say about us.
What Customers Are Saying about Middleware
Teams across different industries have made this same transition. Here’s what they’re experiencing:
“We use Middleware.io to monitor our infrastructure. The integration takes minutes and it comes preconfigured with very nice and detailed dashboards. It’s powered by AI and saved a lot of time for our engineers on troubleshooting and fixing hidden bottlenecks on our AI engine.”
Ashot, Cloudchipr
“I don’t want my developers to stay up all night trying to fix issues. That’s a waste of everyone’s time. Middleware helped us become faster. It saves at least one hour of my time every day, which I can dedicate to something else.”
Akshat Gupta, Trademarkia
Ready to Make the Switch?
If you’re ready to move from fragmented monitoring to unified observability, Middleware offers both a free trial and personalized demos.
Start your free trial to experience the platform, or book a demo to see how Middleware solves your specific monitoring challenges. Our team can guide you through the migration process and address any questions you may have about your setup.


