



Post-mortems are one of the most valuable SRE practices. They are also one of the most consistently skipped.
The reason is structural. Writing an accurate postmortem means reassembling an incident timeline days after it happened, from incomplete memory, scattered Slack threads, and dashboards that have already rolled over. The result is a postmortem that is too vague to be useful, or one that never gets written at all.
This post explains how Middleware OpsAI solves this. OpsAI captures the full incident timeline as it happens, then automatically generates an RCA summary: root cause, contributing factors, timeline of events, affected services, and resolution actions, ready for review the moment an incident closes.
TL;DR
- Post-mortems fail because they are written days after an incident from fading memory: OpsAI captures the incident record in real time so no signal is lost.
- OpsAI builds the incident timeline automatically from APM traces, logs, RUM sessions, Kubernetes events, and infrastructure metrics, the same data sources an engineer would manually correlate during investigation.
- The auto-generated RCA summary includes an incident timeline with exact timestamps, identified root cause with supporting evidence, affected services and user impact, resolution actions taken, and suggested follow-up action items.
- OpsAI’s findings panel acts as a live postmortem draft: every piece of evidence OpsAI gathered during the investigation is already organized and attributed, making human review and editing fast.
- AI-generated postmortems from OpsAI are more accurate than retrospective manual ones because they are based on what the telemetry actually showed, not what engineers remember it showed.
- Automated incident RCA removes the knowledge-hoarding problem: every incident’s root cause is documented immediately, is accessible to every engineer, and is searchable for future pattern matching.
Why teams always struggle to write accurate post-mortems
Ask any engineering leader whether post-mortems are important, and the answer is always yes. Ask them how many of their team’s incidents have a completed postmortem document, and the answer is almost always uncomfortable.
This is not a discipline problem. It is an information architecture problem. Writing a good postmortem requires answering four questions with precision:
- What happened, in what order, at what exact times?
- What was the root cause, and what evidence supports that conclusion?
- What did the response team do, and did those actions help or hurt?
- What should change to prevent recurrence?
These questions have objectively correct answers. But those answers exist only in the telemetry data from the incident window: the APM traces, the log streams, the infrastructure metrics, and the alert history.
By the time the postmortem meeting happens three days later, that data has not been lost. It has become difficult to reconstruct. The engineer who ran the investigation was moving fast, did not take notes, and now has to recreate the timeline from memory and whatever they can find in a Slack thread.
The result is post-mortems that describe symptoms rather than root causes. Timelines end up off by 10 to 30 minutes. Action items address the most memorable part of the incident rather than the actual root cause.
Teams lose trust in their own post-mortems and stop reading them. The institutional knowledge value collapses.
There is a better path: capture postmortem data during the incident, not after.
What is automated root cause analysis in incident management
Automated root cause analysis (RCA) uses AI and telemetry correlation to identify the cause of a production incident without requiring a human to run a manual investigation.
A human engineer normally correlates log lines, metric spikes, and trace spans one at a time. An automated RCA system works differently: it ingests all available signals at once, then applies pattern matching, anomaly detection, and causal reasoning to identify the most likely root cause.
In incident management and postmortem generation, automated RCA serves a more specific purpose. It builds a structured, timestamped record of the telemetry data from the incident: which services were affected, in what order, and with what error signatures. OpsAI then presents the record as a draft postmortem, which engineers review and augment instead of writing from scratch.
The distinction matters for postmortem quality. A human writing a postmortem from memory does reconstructive work under cognitive bias. They tend to emphasize what they personally investigated. They compress time periods that felt less significant. They unconsciously frame the root cause around the first hypothesis that felt right.
An automated RCA system has no memory bias. It reports what the data showed, in the order the data showed it, with timestamps accurate to the millisecond.
For a closer look at how this correlation works with live Kubernetes telemetry, see “diagnosing abnormal Kubernetes workload behavior.”
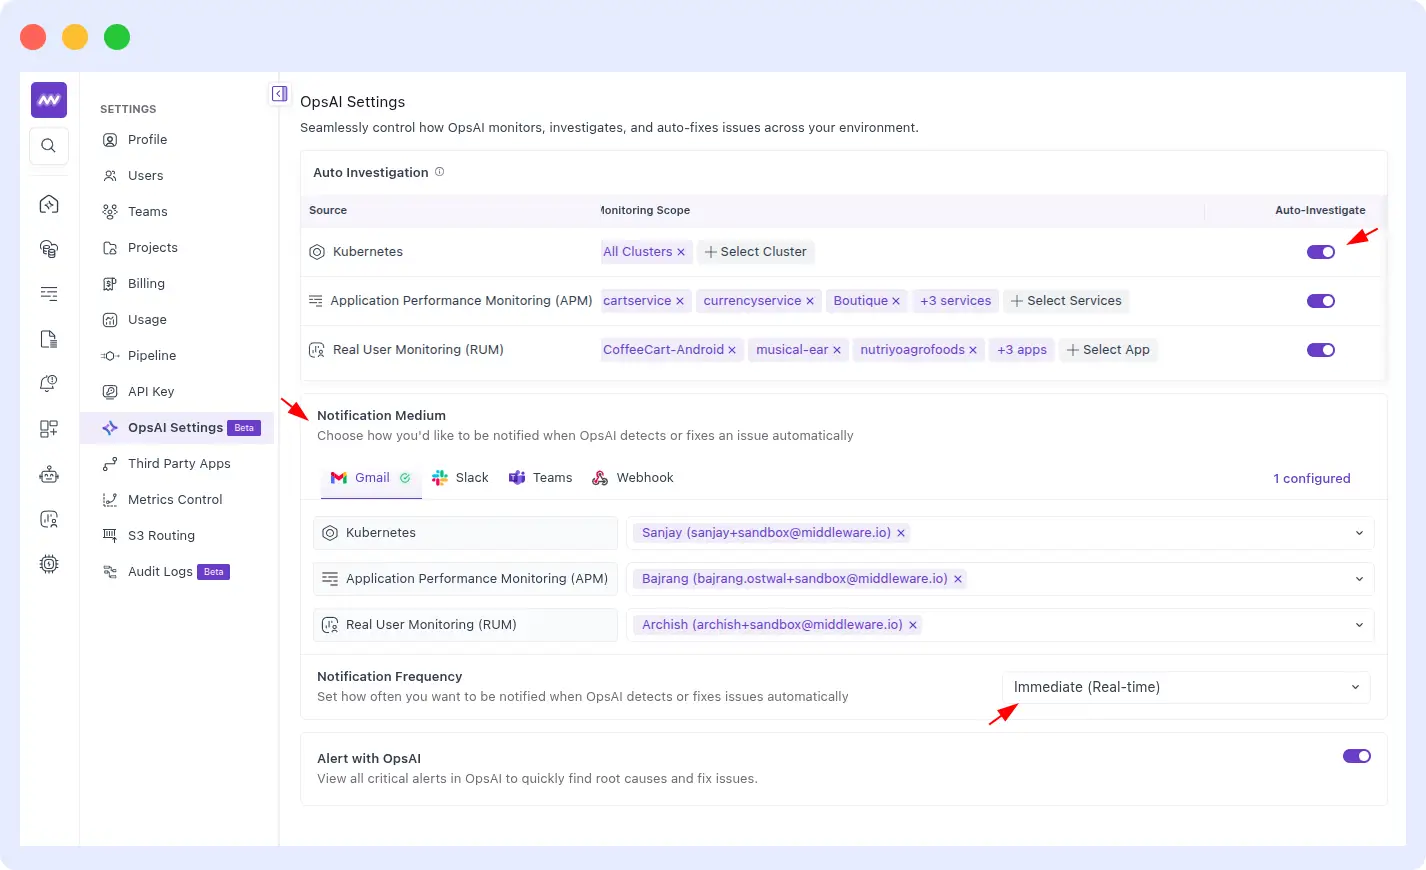
What you configure in Auto RCA settings
Auto RCA does not need to run against your entire environment by default. The Auto RCA settings page, under Settings > OpsAI Settings, lets you scope exactly where it runs and who hears about it:
- Select which Kubernetes clusters Auto RCA should monitor and investigate
- Select which APM services are in scope for automated root cause analysis
- Select which RUM apps Auto RCA should correlate against for user impact
- Choose who receives Auto RCA notifications, down to the individual or team
- Choose which notification channels those findings are sent to, for example Slack, email, or PagerDuty
This scoping matters in practice. A team running Auto RCA across 40 services does not want every finding routed to one shared channel. Configuring clusters, services, and apps individually, then mapping each to the right notification target, means the on-call engineer for a given service sees only what is relevant to them the moment an incident closes.
What OpsAI captures during an incident for postmortem generation
OpsAI begins building the incident record the moment it detects an issue. This happens before an engineer has been paged, and before any manual investigation has started.
By the time the incident is closed, OpsAI has already assembled every piece of information a postmortem document requires.
Here is exactly what OpsAI captures from each telemetry source.
From APM traces
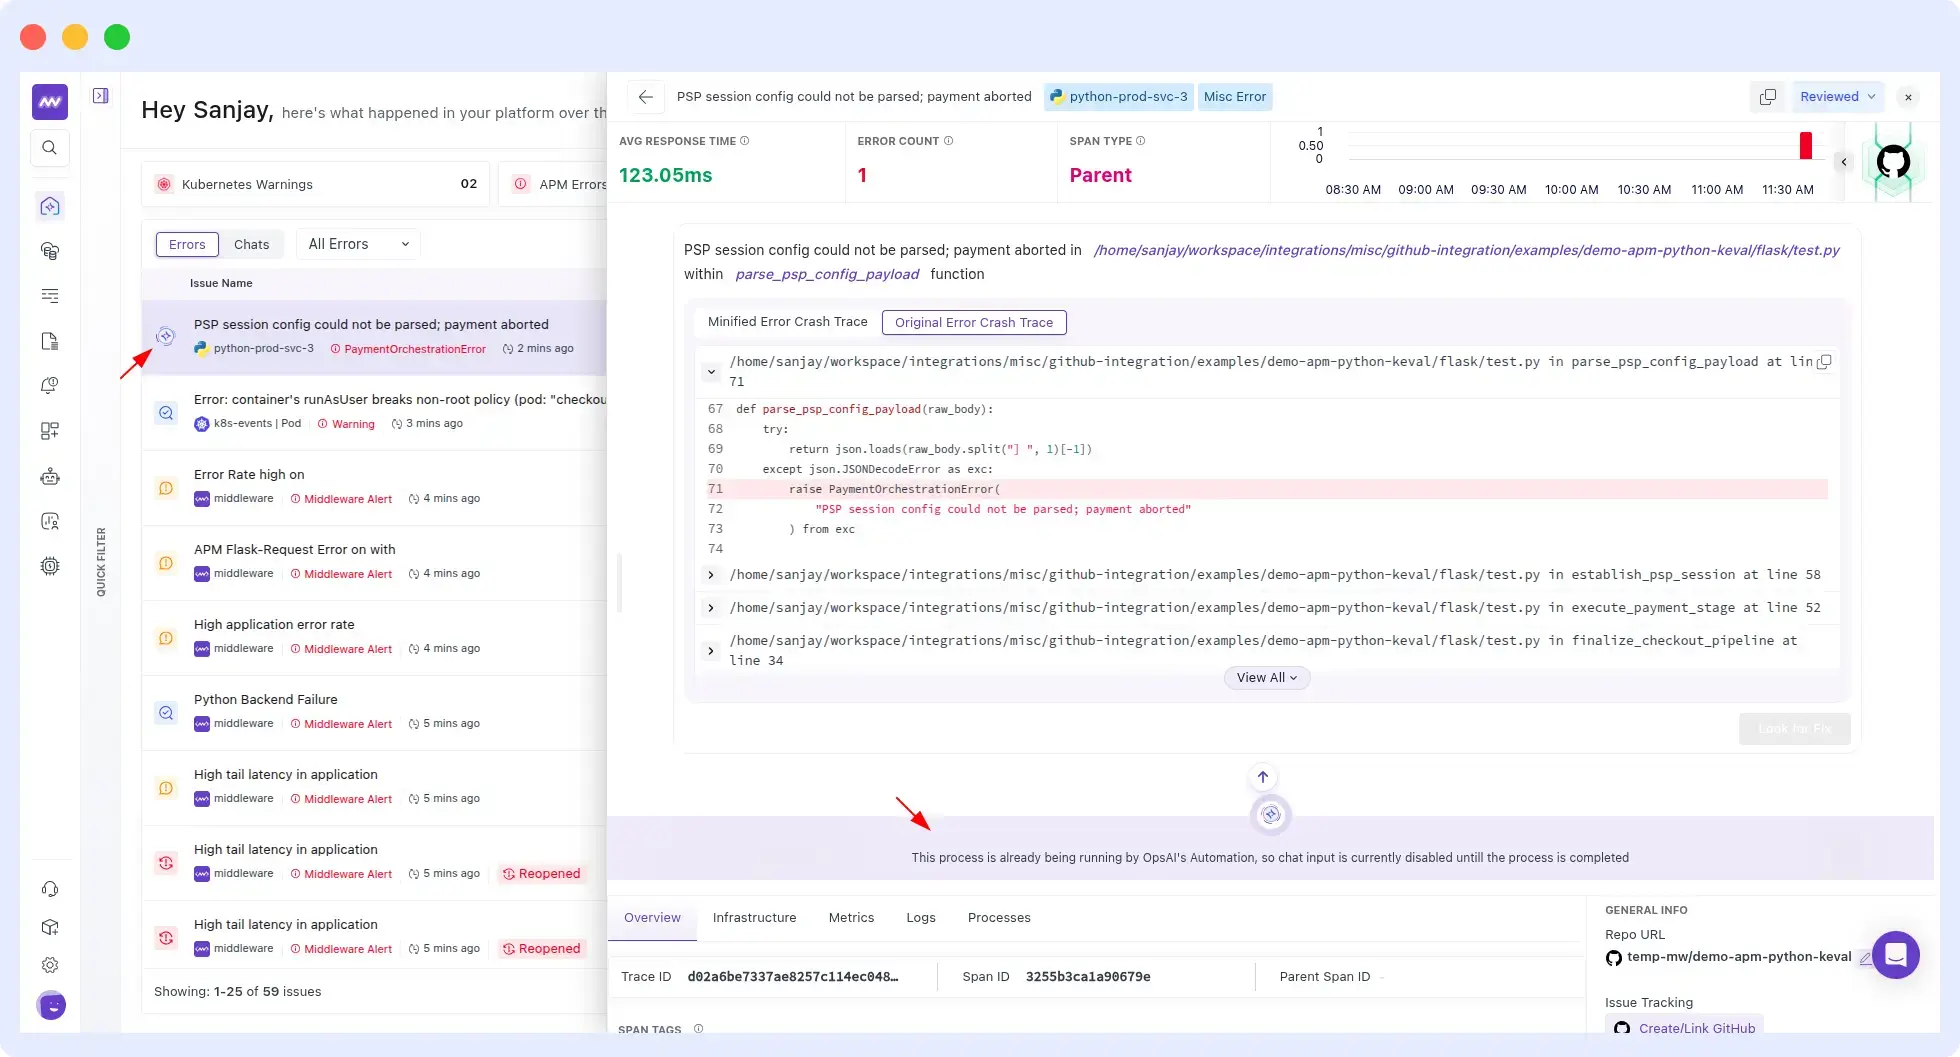
- The first trace that showed anomalous behavior, with its exact timestamp
- The full distributed trace span tree for affected requests: which services were involved, how long each took, where errors occurred
- Stack traces and exception messages from the failing service
- Error rate and latency trends across the incident window, including the pre-incident baseline for comparison
- The specific function, file, and line of code identified as the root cause (when GitHub or Bitbucket is connected)
From logs
- Log patterns that appeared in the pre-incident window: the sequence that preceded the failure
- Error log lines with surrounding context from affected services
- Log anomalies across all instrumented services correlated with the incident timeline
- Any log evidence that distinguishes root cause from contributing factors, for example a configuration warning logged 40 minutes before the failure
From RUM sessions
- Number of user sessions affected during the incident window
- User-facing error types and their distribution (JavaScript errors, failed API calls, page load failures)
- Session abandonment rate during the incident compared to baseline
- Geographic or device-specific impact patterns if the failure was not uniform across user cohorts
From Kubernetes events
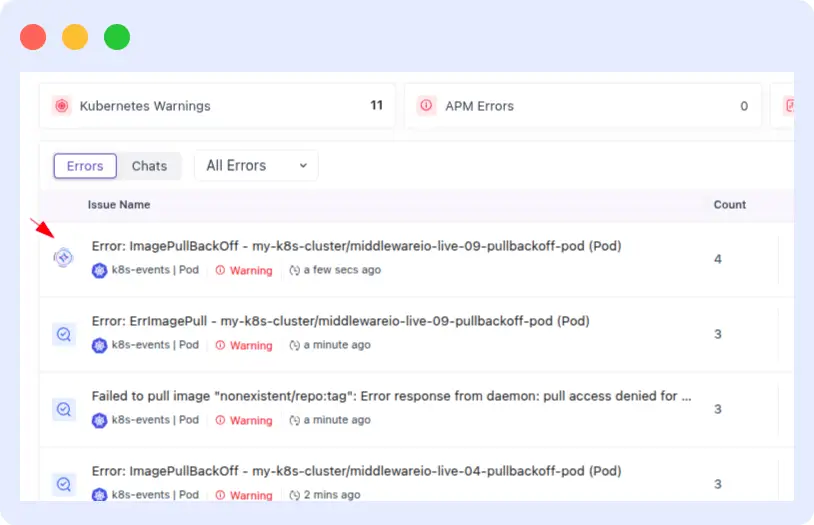
- Pod restart events, OOMKill events, and CrashLoopBackOff conditions with exact timestamps
- HPA scaling decisions and their timing relative to the incident
- Node-level events that contributed to service unavailability
- The resolution action applied, whether Auto Fix or manual remediation, and when it took effect
From infrastructure metrics
- CPU, memory, and network utilization trends in the pre-incident, incident, and recovery windows
- Database connection pool metrics if connection exhaustion was a factor
- Any infrastructure-level anomalies that OpsAI’s anomaly detection flagged before the incident escalated
From alert history
- Which alert fired first, and when
- Alert escalation sequence and timing
- Whether the incident was detected by OpsAI before a threshold alert fired, and by how much
- Third-party alerts from Datadog or Grafana ingested via integration, with their timestamps
All of this is captured in real time, structured, and timestamped by OpsAI during the incident. The postmortem author does not need to find any of it: it is already organized in the findings panel by the time they sit down to write.
What a good AI-generated incident RCA summary includes
A postmortem document that engineering teams will actually read and act on needs to be specific, structured, and fast to scan.
The OpsAI findings panel forms the basis of the auto-generated RCA summary. It is organized around seven components that correspond to what practitioners need from a postmortem.
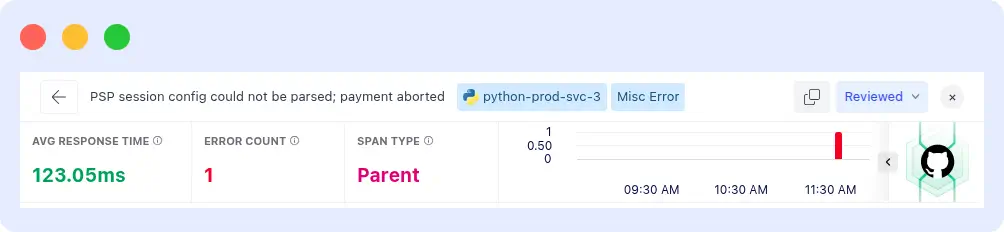
1. Incident header
Service affected, incident severity, detection time, resolution time, and total duration. These are captured automatically from the alert and resolution events, no manual entry required.
2. Executive summary
A plain-language description of what happened: which service failed, what the user-facing impact was, what the root cause was, and how it was resolved. OpsAI generates this from its investigation findings, not from a template.
The summary is specific: “The payment service’s PostgreSQL connection pool was exhausted at 14:23 UTC due to a connection leak introduced in the v2.4.1 deployment. 847 checkout sessions failed. The connection was resolved by reverting the connection pool configuration at 14:51 UTC.”
3. Incident timeline
A chronological list of every significant event during the incident window with exact timestamps: first anomalous trace detected, alert fired, first engineer paged, investigation actions taken, fix proposed, fix applied, service restored, all-clear confirmed.
OpsAI builds this timeline from telemetry timestamps rather than from engineer recall. Every entry is sourced from actual system events.
| Time (UTC) | Event | Source |
|---|---|---|
| 14:18:42 | OpsAI detects latency anomaly on payment service. p99 rising from 180ms baseline | APM anomaly detection |
| 14:21:07 | Payment API error rate crosses 2%. Alert fires | Middleware alert monitor |
| 14:21:09 | OpsAI begins root cause analysis. Ingests span tree and log context | OpsAI investigation |
| 14:23:15 | Root cause identified: PostgreSQL connection pool exhaustion in payment service | OpsAI findings panel |
| 14:24:02 | OpsAI opens pull request with connection pool configuration fix | GitHub PR #4821 |
| 14:38:00 | Engineer reviews and approves PR | GitHub |
| 14:51:30 | Deployment completes. Error rate returns to baseline | APM traces |
4. Root cause analysis
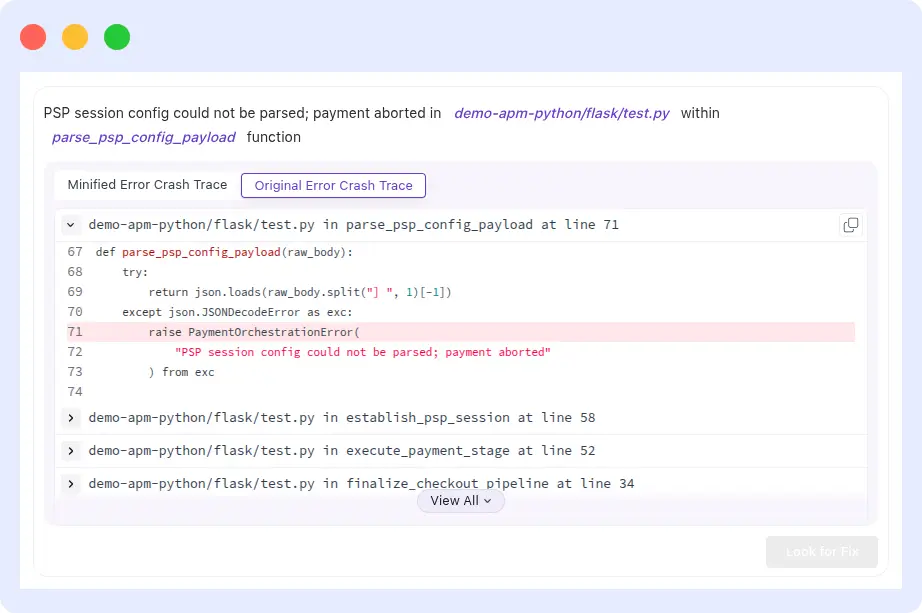
The specific root cause with the supporting evidence: which service, which operation, which code change or configuration introduced the failure, and why it produced the observed symptoms.
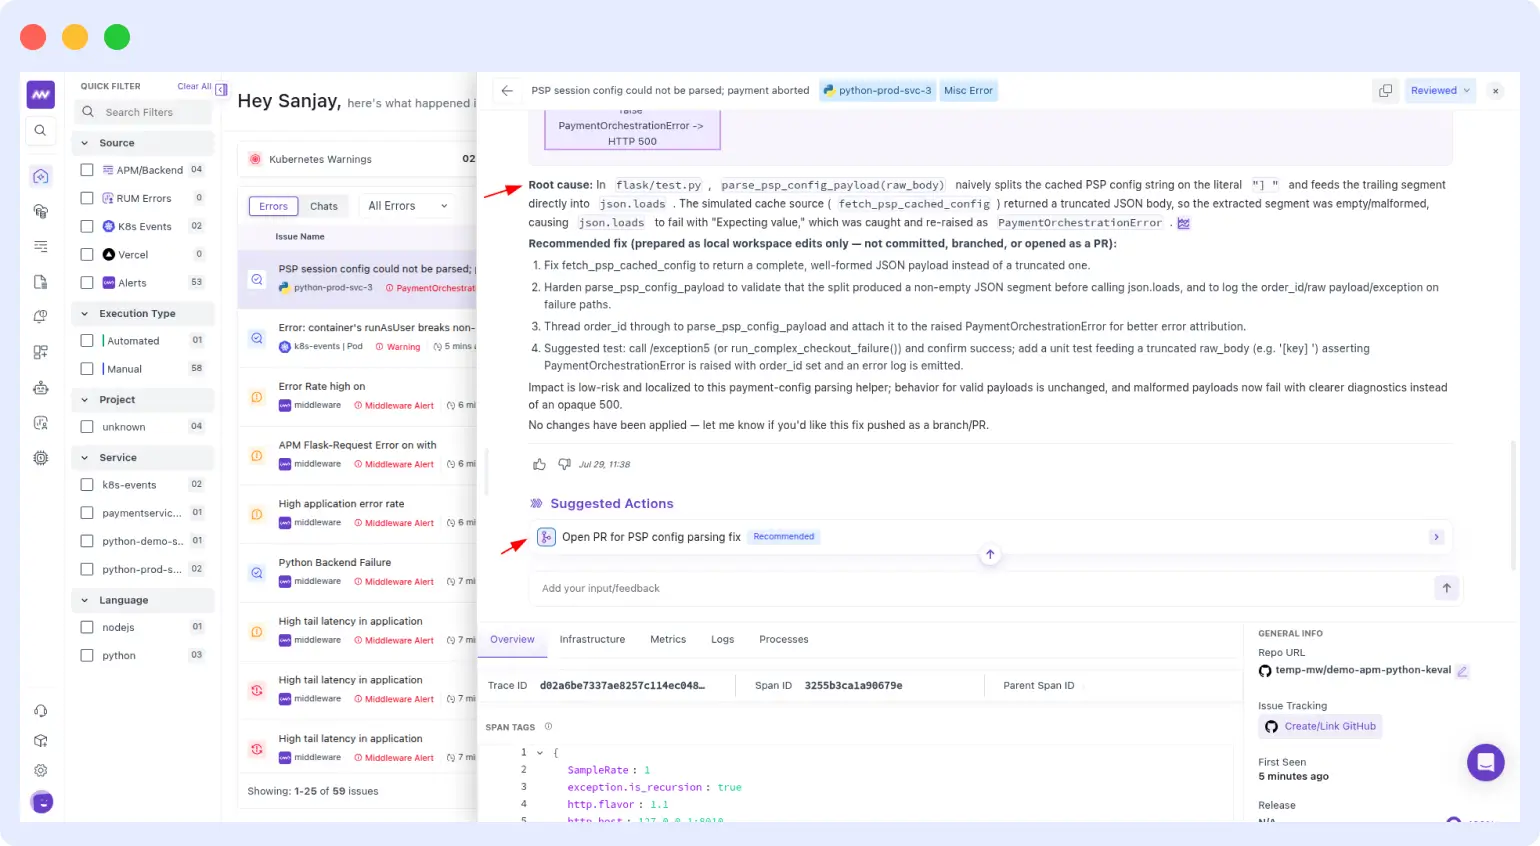
OpsAI attributes this to specific telemetry evidence, for example “connection pool utilization reached 100% at 14:19 UTC based on infrastructure metrics; all subsequent payment requests queued and timed out after 8,000ms,” rather than stating a hypothesis without evidence.
5. Contributing factors
Root causes rarely exist in isolation. OpsAI identifies contributing factors that worsened the incident or slowed detection.
For example: “Connection pool size was not increased when payment service replicas scaled from 4 to 8 last Tuesday, doubling the number of connections sharing the same pool limit.” These are facts surfaced from the telemetry, not opinions formed in a post-mortem meeting.
6. Impact summary
Quantified user impact from RUM data: number of affected sessions, session abandonment rate, error types seen by users, and geographic or cohort-specific impact if applicable.
This section gives the postmortem business context that pure infrastructure metrics miss: 847 failed checkout sessions is a different sentence than “payment service error rate was 3%.”
7. Action items
OpsAI suggests follow-up action items based on the identified root cause and contributing factors: “Add connection pool size to the deployment scaling checklist,” “Set alert on connection pool utilization above 80%,” “Add integration test for connection pool behavior under replica scale events.”
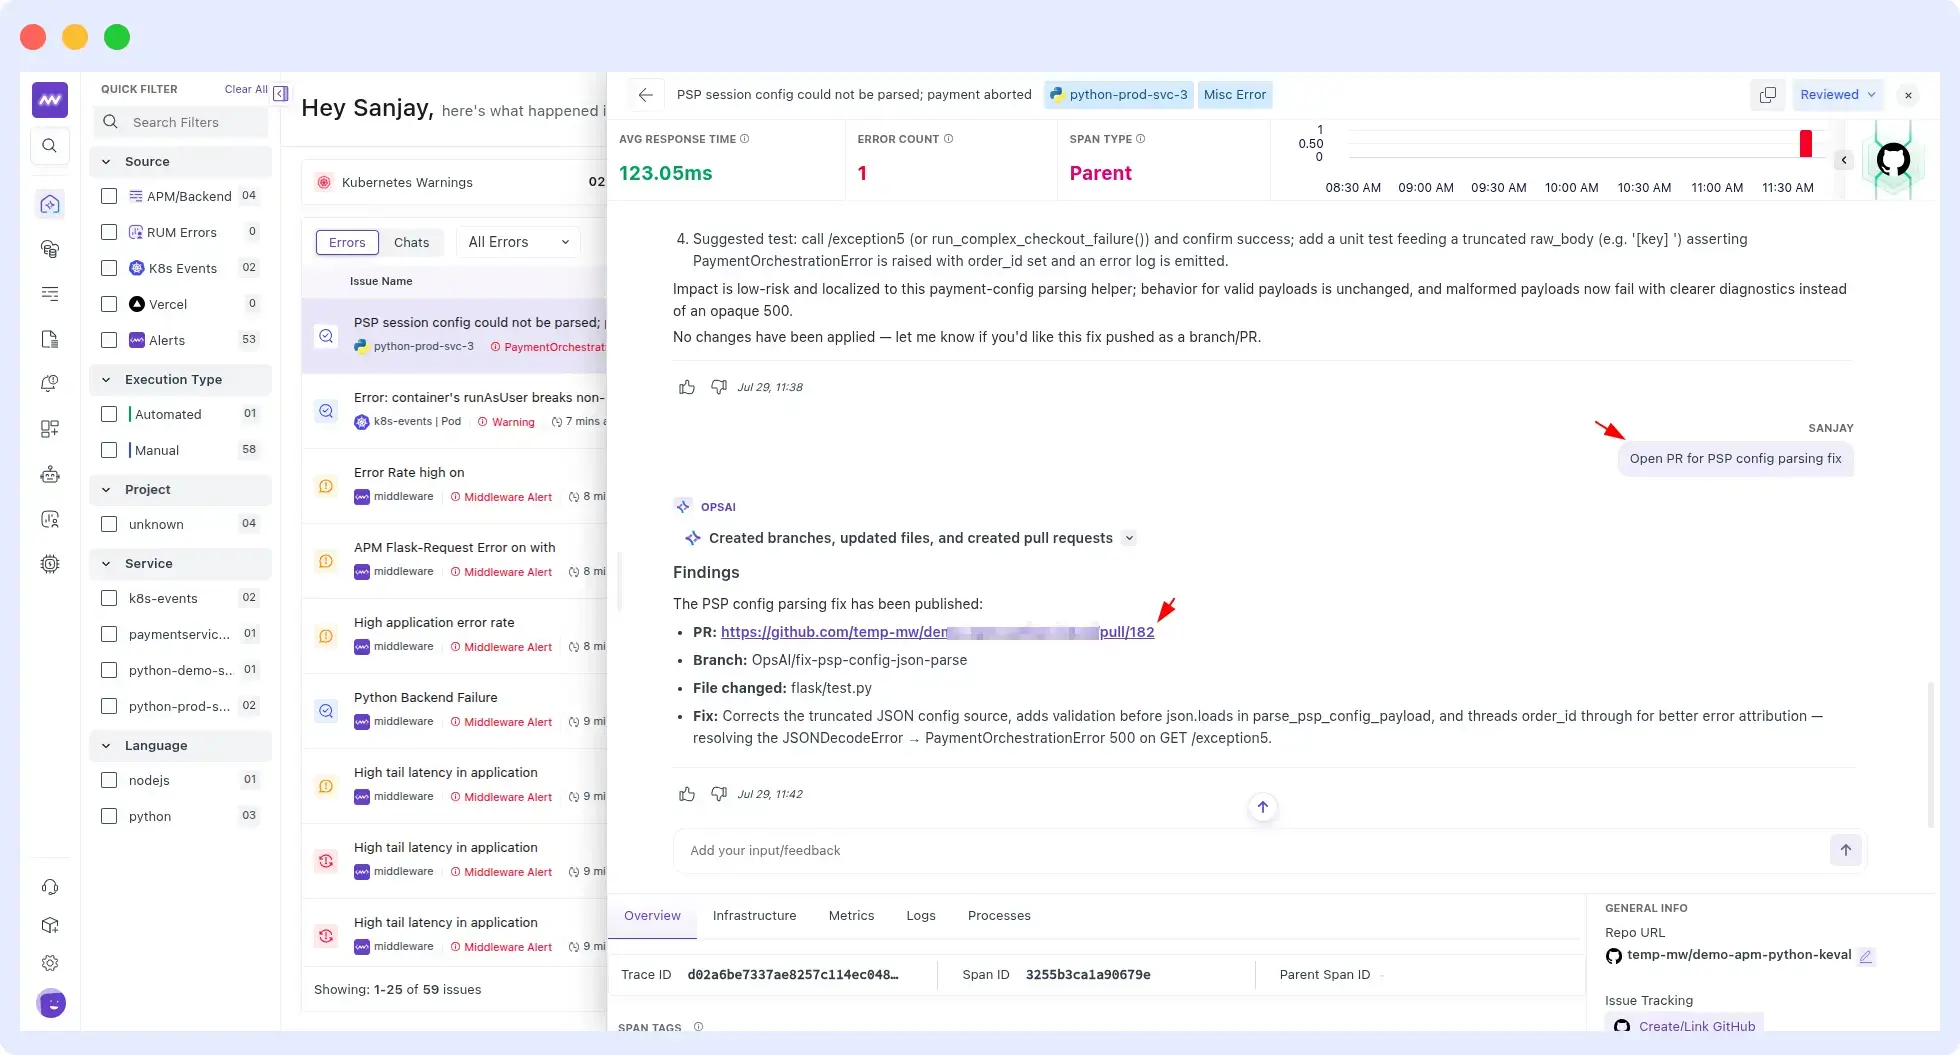
These are derived from the incident findings, not generated generically.
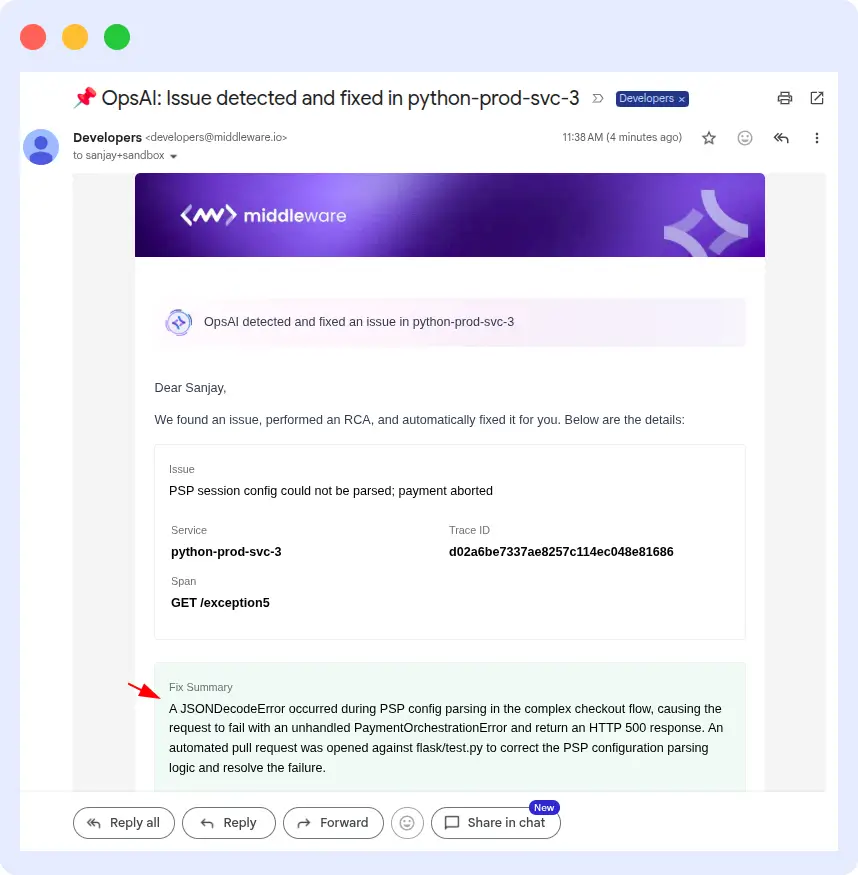
AI-generated post-mortems vs manually written ones: accuracy and trust
The instinctive concern about AI-generated postmortems is accuracy: can an AI produce a postmortem that is sufficiently trustworthy to serve as a factual record of an incident?
The answer, somewhat counterintuitively, is that AI-generated postmortems from OpsAI are typically more accurate than manually written retrospectives, for a specific structural reason. For a broader look at how OpsAI’s architecture compares to other AI SRE tools, see OpsAI vs Resolve AI.
| Dimension | Manual retrospective postmortem | OpsAI auto-generated postmortem |
|---|---|---|
| Timeline accuracy | Based on memory, often off by 10 to 30 minutes | Based on telemetry timestamps, accurate to the millisecond |
| Root cause attribution | First convincing hypothesis, often confirmed by group agreement | Derived from correlated telemetry evidence across all signals |
| Contributing factors | What engineers remember noticing during the investigation | What the metrics and logs actually showed, including pre-incident trends |
| User impact | Estimated or omitted entirely | Quantified from RUM session data |
| Time to produce | 2 to 4 hours of engineering time, typically 3 to 5 days after the incident | Available immediately when the incident closes, human review adds 30 to 60 min |
| Blame risk | High: fatigue and stress during incidents create narratives that center on individuals | Low: all attributions are sourced to telemetry events, not human actions |
| Completeness | Depends on what the on-call engineer remembers to include | Systematic: all monitored signals are included regardless of whether they seemed important at the time |
The accuracy advantage of OpsAI’s auto-generated postmortem is not that AI reasoning is better than human reasoning. It is that AI has access to the unaltered telemetry record at the time of the incident. Humans writing retrospective postmortems are working from reconstructed memory days later.
Memory is reconstructive. It is susceptible to hindsight bias, and it gets filtered through the stress of incident response. Telemetry data is not.
The appropriate role for the engineer reviewing an OpsAI-generated postmortem is editor, not author: verify the timeline, add context that only humans have (a conversation that happened in Slack, a decision made during the incident call), and finalize the action items.
This takes 30 to 60 minutes rather than 3 to 4 hours, and produces a more accurate document.
How OpsAI supports blameless postmortem culture
Blameless postmortems are widely endorsed and often impractical in execution. Blameless postmortems are the SRE practice of analyzing incidents in terms of system failures rather than individual failures.
The reason blameless postmortems are hard to sustain is social. Human-written postmortems are inevitably shaped by the dynamics of the people in the room: who was on call, who made which decision under pressure, whose code was in the deployment that triggered the incident.
OpsAI-generated postmortems are structurally more blameless because every attribution in the document is sourced to a telemetry event rather than a human action.
“The payment service connection pool was exhausted” is a different kind of statement than “the engineer on call did not notice the connection pool filling up.” Both might describe the same incident, but only the first is a useful engineering finding.
When OpsAI identifies root cause, it identifies the system condition that caused the failure: the code path, the configuration value, the architectural decision, the missing safeguard.
It does not identify the individual who introduced that condition, even when the code context from GitHub is involved. The PR that OpsAI opens targets the system fix, not the person who wrote the original code.
For engineering managers, this matters because blameless postmortems are a prerequisite for honest ones.
When engineers know that a postmortem will be used to identify opportunities for systemic improvement rather than to assign responsibility, they are more forthcoming about what actually happened. They are also more likely to surface uncomfortable contributing factors. OpsAI’s telemetry-grounded approach makes this easier to sustain in practice.
Real scenario: a P1 outage and the postmortem OpsAI generates
Here is a concrete example of what the OpsAI-generated postmortem record looks like for a real incident type.
The incident
At 02:14 UTC on a Tuesday, the order confirmation service begins returning 500 errors. A deployment had gone out at 01:58 UTC. The error rate climbs to 8% over 6 minutes. 1,200 user sessions are affected before the service is restored at 02:47 UTC. Total incident duration: 33 minutes.
What the manual postmortem would look like (written Thursday)
The engineer who handled the incident writes from memory. They remember the deployment, seeing 500 errors, and rolling back the deployment. The timeline is approximate: “around 2 AM errors started, we rolled back by 3 AM.”
The root cause is listed as “bug in the v2.7.0 deployment.” The contributing factors section is blank. User impact reads “some users affected.” Action items read “better testing before deployment.”
This postmortem is accurate in broad strokes but useless as an engineering record. It cannot answer: which specific change in the deployment caused the failure? How long did detection take? What was the exact user impact? What test would have caught this?
What OpsAI generates immediately after the incident closes
Incident header: Order Confirmation Service, P1, duration 33 minutes, detected 02:14:03 UTC, resolved 02:47:18 UTC, 1,247 user sessions affected.
Executive summary: A KeyError on the promo_code field was introduced in the v2.7.0 deployment of the order confirmation service. The error occurred when users applied a promotional code at checkout, a code path that uses a field added in v2.7.0 but not yet present in all cart objects for users who had started their sessions before the deployment.
Executive summary (continued): 1,247 user sessions hit the error; 831 of those sessions ended in abandonment. The service was restored by deploying v2.6.9 at 02:47 UTC.
Incident timeline (abbreviated):
- 01:58:12: v2.7.0 deployed to production
- 02:14:03: OpsAI detects rising error rate on order confirmation service (first anomalous traces)
- 02:16:41: Error rate crosses 2%. Alert fires. Engineer paged
- 02:17:09: OpsAI root cause analysis complete: KeyError: ‘promo_code’ in order/confirm.py line 187
- 02:17:44: OpsAI opens PR #5032 with fix: add .get(‘promo_code’, None) with backward compatibility handling
- 02:31:00: Engineer reviews PR, decides rollback is faster given ongoing user impact
- 02:44:55: Rollback deployment begins
- 02:47:18: Error rate returns to baseline. Incident resolved
Root cause: KeyError on promo_code in order/confirm.py:187, introduced in v2.7.0. The field was added to the order schema but the accessor was not written with backward compatibility: existing cart sessions created before the deployment did not have the field in their serialized cart objects.
Contributing factors: No integration test covered the code path for sessions crossing a deployment boundary. The promotional code feature was added without a feature flag, making rollback the only mitigation option during the incident window.
Impact: 1,247 RUM sessions hit the error. 831 sessions (66.6%) ended in abandonment. Error type: 500 on POST /api/order/confirm. No impact on users who did not use a promotional code.
Action items suggested by OpsAI:
- Add integration test covering cart serialization across deployment versions
- Add feature flag requirement to promotional code feature checklist
- Ensure all new schema fields use .get() with a safe default value
- Add alert on order confirmation error rate above 1% (current threshold is 2%)
The difference between these two documents is not cosmetic.
The OpsAI version is actionable: an engineer reading it knows exactly which test to write, which alert threshold to add, and which coding convention to enforce. The manual version tells them “test more before deploying,” which is too vague to act on.
How to enable automated postmortem generation with OpsAI
OpsAI’s RCA findings panel forms the basis of the auto-generated postmortem. It is built into the core OpsAI investigation workflow and does not require separate configuration.
The quality and completeness of the auto-generated postmortem depends on the telemetry sources connected.
Step 1: Connect APM instrumentation
Install the Middleware APM SDK for your backend language. OpsAI supports Python, Node.js, Go, Java, and Next.js.
APM instrumentation provides the distributed trace data that underpins the incident timeline and root cause analysis. Without APM, OpsAI can still detect and investigate log- and infrastructure-based incidents, but code-level root cause identification is unavailable.
Step 2: Add RUM instrumentation
Add the Middleware RUM JavaScript snippet to your frontend. RUM data provides the user impact section of the postmortem: session counts, abandonment rates, and user-facing error types.
Without RUM, postmortems describe backend behavior but cannot quantify how many users experienced the incident.
Step 3: Connect your code repository
Connect GitHub or Bitbucket via the GitHub MCP integration in Middleware settings.
Code repository access allows OpsAI to identify the specific file, function, and line responsible for an error, and to propose a code fix that is included in the postmortem as a concrete resolution action. Set these CI environment variables:
MW_VCS_REPOSITORY_URL=<your repository URL>

MW_VCS_COMMIT_SHA=<commit SHA>
Step 4: Enable alert ingestion
Go to Settings > OpsAI Settings and enable the Alert Ingestions toggle. This ensures that all alerts, including those from Datadog and Grafana when connected via their respective integrations, are captured in OpsAI’s incident record with accurate timestamps.
Alert timestamps are one of the most commonly inaccurate parts of manually written postmortem timelines. OpsAI captures them from the system event rather than from recall.
Step 5: Review the findings panel after an incident
When an incident closes, the OpsAI findings panel contains the full investigation record. Export or copy this into your postmortem template, or use it directly as the postmortem. The engineer’s role at this stage is to:
- Verify the timeline and add any context that exists only in human communication (Slack decisions, external vendor communications)
- Confirm or refine the root cause attribution if additional context changes the analysis
- Prioritize and assign the action items OpsAI suggested
- Add organizational context: SLA impact, customer communications sent, escalation chain
This review process takes 30 to 60 minutes rather than the 2 to 4 hours a manually written postmortem requires, and produces a more complete, more accurate document.
Step 6: Scope auto RCA in OpsAI settings
Go to Settings > OpsAI Settings to control exactly what Auto RCA runs against. As covered above, this is where you pick the Kubernetes clusters, APM services, and RUM apps in scope, and set who gets notified and on which channel.
Scoping Auto RCA before rollout avoids two failure modes: alert fatigue from running it everywhere at once, and blind spots from forgetting to enable it on a newer service.
Check: Full setup documentation for OpsAI.
Your next postmortem should write itself
Every production incident your team investigates generates enough telemetry data to produce a complete, accurate postmortem automatically. The problem is that data has never been captured and structured in real time, until OpsAI.
Connect your APM, RUM, and Kubernetes instrumentation to Middleware, enable OpsAI, and the next incident your team handles will close with a complete RCA draft waiting for review, not a blank document that needs to be written three days later from fading memory.
FAQs
How do I automate incident postmortem generation after a production outage?
The fastest path is to connect OpsAI to your full telemetry stack: APM for backend traces, RUM for user session data, and Kubernetes agent for infrastructure events, and enable alert ingestion in OpsAI settings.
OpsAI builds the incident record automatically during every investigation. When the incident closes, the findings panel contains a structured postmortem draft: timeline, root cause, user impact, and suggested action items. The engineer’s role shifts from author to editor.
What information does an AI need to automatically generate a postmortem report?
OpsAI generates postmortems from APM distributed traces (for the service call chain and root cause), log data (for pre-incident pattern context and error detail), RUM session data (for user impact quantification), infrastructure metrics (for contributing factor identification), Kubernetes events (for pod-level incident timeline), and alert history (for detection timing).
The more telemetry sources connected, the more complete the generated postmortem. At minimum, APM traces alone give OpsAI enough to produce a root cause analysis and incident timeline.
Can AI write a blameless postmortem from logs, traces, and alerts automatically?
Yes, and AI-generated postmortems are structurally more blameless than retrospective human-written ones. Every attribution is sourced to a telemetry event rather than a human action.
OpsAI identifies system conditions that caused the failure (code paths, configuration values, architectural gaps) rather than individual actions. This naturally aligns the resulting postmortem with blameless postmortem principles, without requiring active enforcement.
How long does it take to write a postmortem manually vs using an AI tool?
A manual retrospective postmortem typically requires 2 to 4 hours of engineering time, written 2 to 5 days after the incident when memory is already degraded. With OpsAI, the postmortem draft is available immediately when the incident closes.
Human review and editing to add context, verify the timeline, and finalize action items typically takes 30 to 60 minutes. The time saving is significant, but the accuracy improvement is often more valuable: postmortems written from telemetry data are more precise than those written from memory.
AI-generated postmortems vs manually written ones: are they accurate enough to trust?
OpsAI-generated postmortems are typically more accurate than retrospective manual ones in their core factual claims: timeline timestamps, root cause attribution, user impact counts, and contributing factor identification. These elements are sourced directly from telemetry data captured at the time of the incident.
The areas where human judgment remains essential are context that exists outside the telemetry: communication decisions, external dependencies, organizational context, and nuanced action item prioritization. The best postmortem combines OpsAI’s telemetry-grounded draft with human editorial review.
Why do teams always struggle to write accurate postmortems days after an incident?
Memory is reconstructive. By the time a postmortem meeting happens 3 to 5 days after an incident, engineers are working from impressions shaped by fatigue, stress, hindsight bias, and whatever they happened to document in Slack during the incident.
The telemetry data from the incident still exists. But re-navigating dashboards for a past incident window is time-consuming and incomplete.
OpsAI solves this by capturing and structuring the telemetry evidence during the incident itself, so the postmortem data is ready before memory degrades.
How can I automatically capture an incident timeline as it happens for a postmortem?
OpsAI builds the incident timeline in real time during its investigation, sourcing each entry from system events rather than human observation: first anomalous trace, alert fire time, root cause identified, PR opened, fix deployed, service restored.
Each event is timestamped from the underlying telemetry rather than from memory. Enabling alert ingestion in OpsAI settings ensures alert timestamps are captured accurately, including from Datadog and Grafana alerts if those integrations are connected.
What should a good AI-generated incident RCA summary include?
A complete AI-generated RCA summary should include an incident header with severity, duration, and detection/resolution timestamps; an executive summary in plain language; and a chronological incident timeline with system-sourced timestamps.
It should also include root cause identification with supporting evidence, contributing factors that compounded the impact, quantified user impact, resolution actions taken, and suggested action items. OpsAI’s findings panel covers all of these components when the full telemetry stack is connected.
Does OpsAI generate postmortems for incidents that come from Datadog or Grafana alerts?
Yes. OpsAI ingests alerts from Datadog and Grafana via their respective integrations and runs the same investigation workflow, pulling in available metrics, logs, and traces to build the incident record.
The resulting findings panel contains the same structured postmortem data regardless of which tool sourced the original alert.

