



Alert correlation is what turns 47 simultaneous Kubernetes alerts into one clear incident instead of an all-night scavenger hunt. In distributed microservices, a single upstream failure cascades into dozens of alerts that all look independent, and all demand attention at once. Without a way to group them by cause, your team burns hours chasing symptoms while the actual root cause sits one hop away. This guide walks through the topology, statistics, and suppression logic that turn a correlation engine from a nice-to-have into the reason your on-call rotation stops dreading the pager.
Alert correlation is the practice of grouping related alerts by shared root cause, rather than treating every threshold breach as an independent event to investigate on its own.
Key takeaways
- Alert correlation groups related alerts by shared root cause instead of treating each threshold breach independently.
- Topology-aware grouping traces the service dependency graph to find the true upstream root cause automatically.
- Statistical correlation matrices surface implicit dependencies, like shared infrastructure, that dependency diagrams miss.
- Suppression hierarchies cut notification storms but need escape hatches so genuine secondary failures stay visible.
- Correlation accuracy should be tracked with three metrics: noise reduction, root cause accuracy, and false suppression rate.
- OpsAI applies this same clustering and root cause logic automatically across APM, logs, infrastructure, and Kubernetes data.
Why traditional alerting fails in distributed systems
Monolithic applications produced linear failure modes. When the database slowed down, response times increased predictably. Modern microservices architectures break this simplicity.
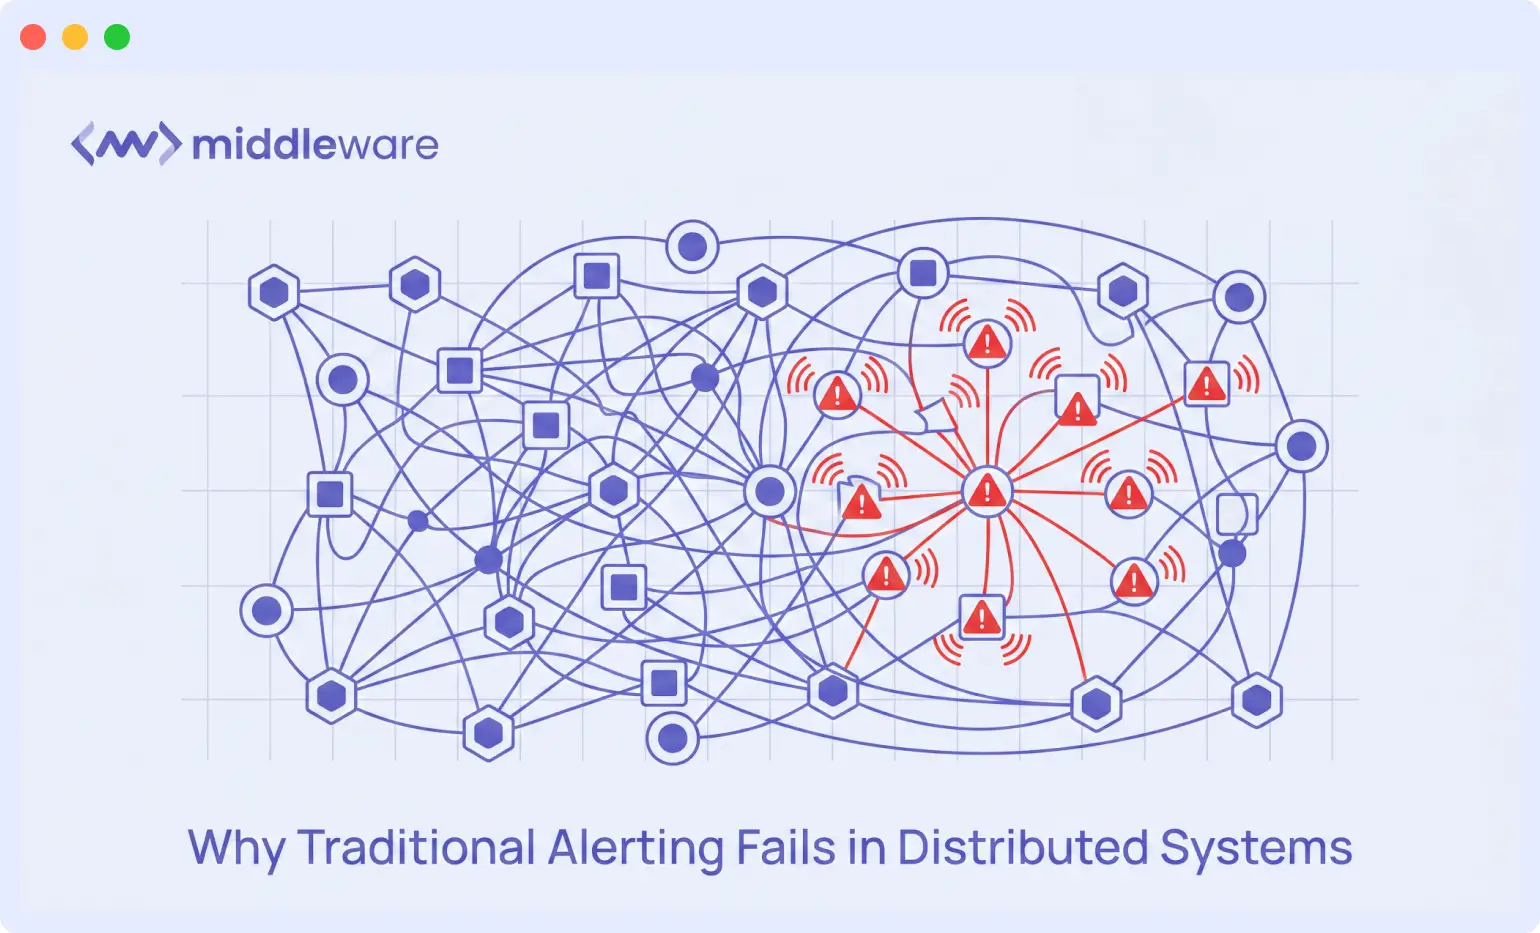
A memory leak in your authentication service triggers timeout alerts in every downstream service. Your payment processor shows elevated error rates because the user service cannot validate tokens. Each alert appears legitimate in isolation, but investigating them separately wastes engineering hours.
The fundamental problem lies in treating each metric threshold breach as an independent event instead of correlating restart timing with resource and log signals. Your alerting rules fire when CPU exceeds 80%, when error rates climb above 2%, when latency breaches P99 targets. These rules know nothing about service dependencies or temporal relationships between failures.
When your container orchestrator reschedules pods during a node failure, you receive alerts for DNS resolution failures, connection timeouts, health check failures, and resource exhaustion simultaneously the kind of cascade covered in more depth in this guide to Kubernetes monitoring.
Alert fatigue becomes inevitable. Teams start ignoring notifications or creating overly broad suppression rules. Critical issues get buried under noise. The solution requires moving from symptom detection to causal analysis, correlating alerts based on topology awareness, temporal proximity, and statistical significance.
| Approach | How it groups alerts | Tradeoff |
|---|---|---|
| Threshold-based | Fires independently on each metric breach | Fast to set up, but produces the most noise in distributed systems |
| Topology-aware | Groups alerts by service dependency graph | Accurate root-cause ranking, but requires maintaining an up-to-date dependency map |
| Statistical | Groups alerts that historically co-occur | Finds implicit dependencies, but needs enough incident history to be reliable |
| AI-driven | Clusters by service, error type, and stack-trace similarity in real time | Least manual upkeep, but depends on first-party access to full-stack telemetry |
Implementing topology-aware alert grouping
Effective alert correlation starts with understanding your service dependency graph. Your observability platform must ingest and maintain an accurate map of which services call which endpoints, how traffic flows through your infrastructure, and where shared dependencies create common failure domains. This topology becomes the foundation for intelligent grouping.
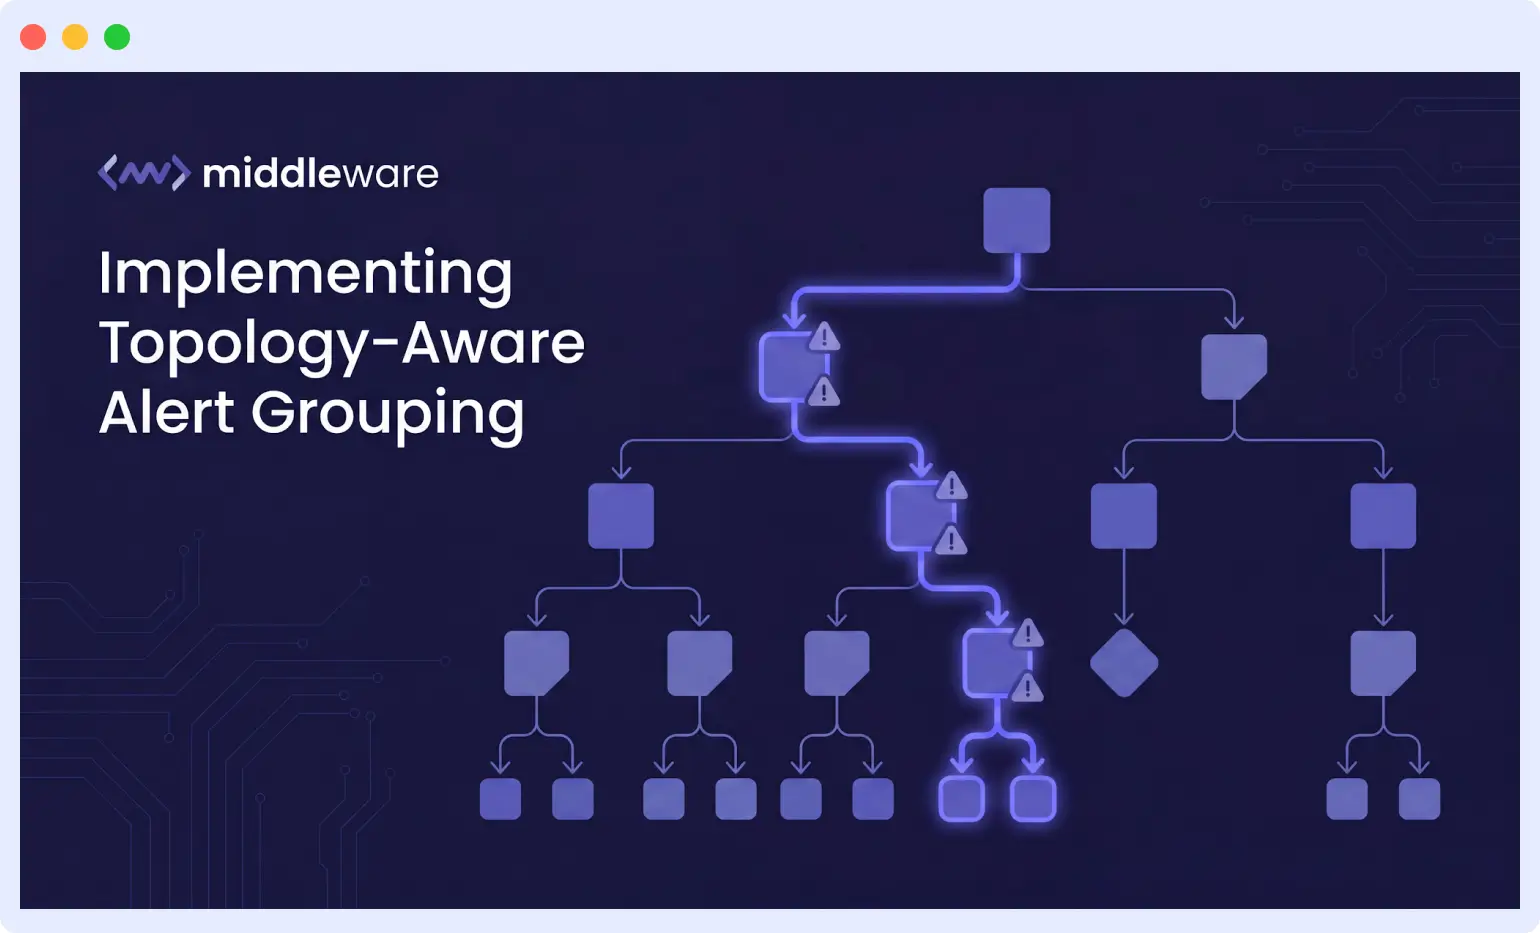
When alerts fire, the correlation engine should traverse the dependency graph upstream from symptomatic services. If your checkout service reports elevated latency while the inventory service shows database connection pool exhaustion, the system should recognize that checkout depends on inventory and group these alerts accordingly.
The investigation starts at the inventory database, not at the checkout frontend. This is the same failure pattern behind a data export job that fails every Sunday night because it collides with a scheduled database backup: the symptoms show up downstream, but the graph points straight back to the actual conflict.
Implementing this requires instrumented traces that capture service-to-service calls, infrastructure metadata linking containers to hosts to availability zones, and a real-time graph database maintaining these relationships. OpenTelemetry provides the instrumentation standard. Your correlation logic queries this graph whenever new alerts arrive, identifying common ancestors and shared infrastructure components.
Temporal windowing matters significantly. Alerts arriving within seconds of each other likely share a cause. Alerts separated by minutes may represent independent issues. Tune your correlation windows based on observed propagation delays in your specific architecture. A synchronous HTTP call chain fails fast. An asynchronous message queue might delay downstream symptoms by minutes.
Middleware addresses observability challenges by consolidating metrics, logs, traces, and events from cloud-native microservices into a single, unified platform. With its AI-powered anomaly detection and root-cause analysis, I can quickly pinpoint and resolve issues.
Engineer at LD College of Engineering
Leveraging statistical methods for anomaly clustering
Beyond topology, statistical correlation identifies alerts that co-occur more frequently than chance would predict. If your Redis cache alerts and your API gateway latency alerts historically fire together 85% of the time, they likely share an underlying cause even without explicit dependency documentation.
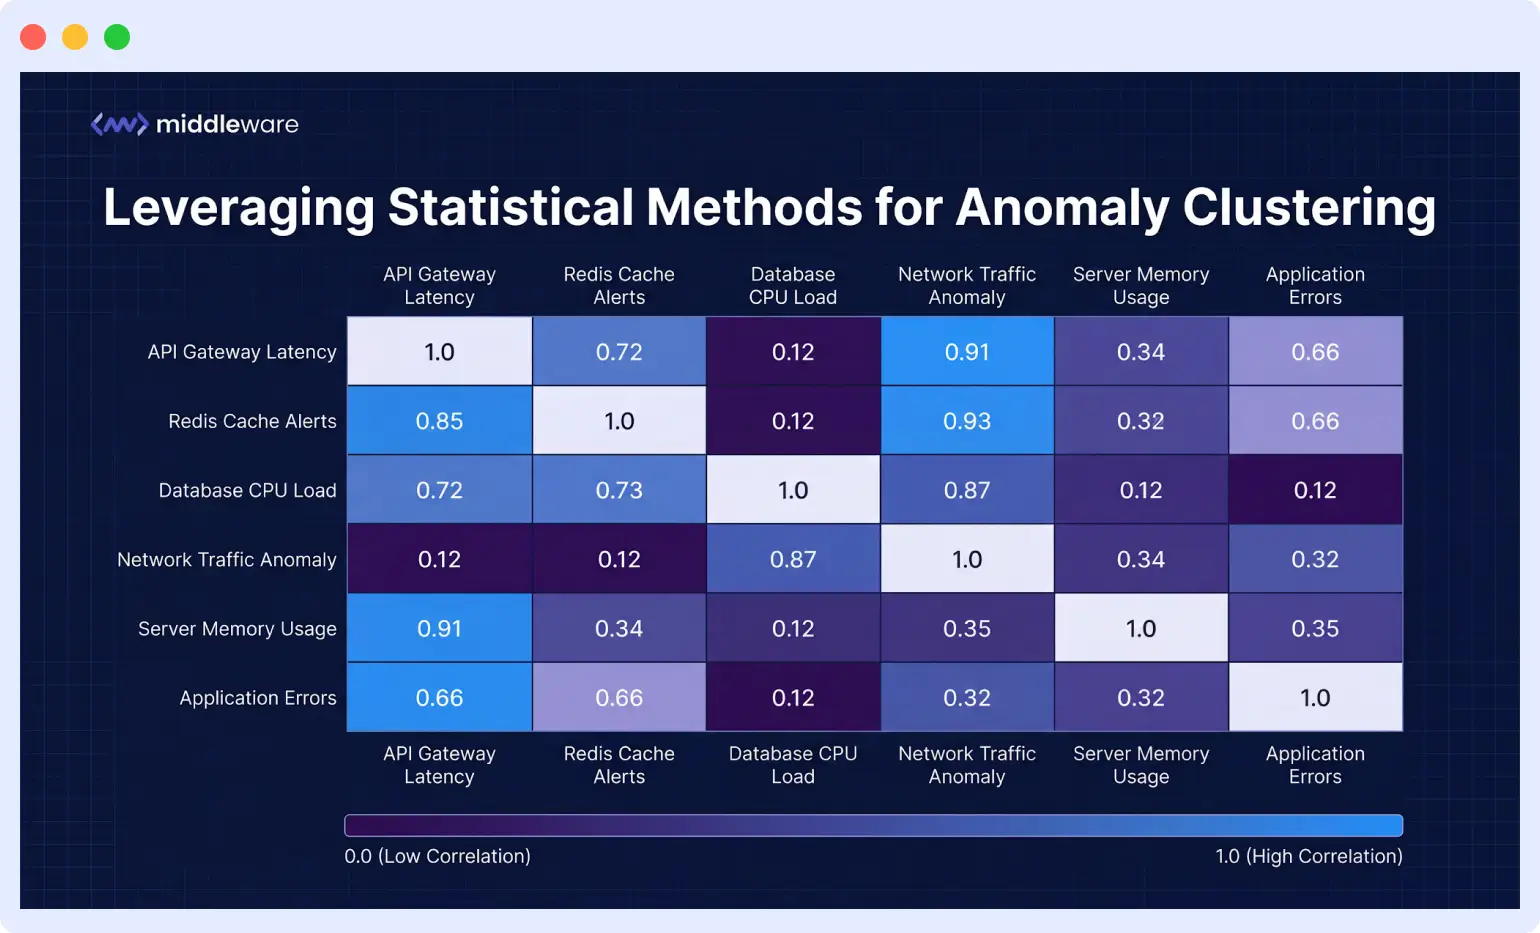
Build correlation matrices from historical incident data. For each pair of alert types, calculate the conditional probability of one firing given the other has fired within your correlation window.
Pairs with high conditional probability become candidates for automatic grouping. This approach discovers implicit dependencies your architecture diagrams miss, like shared network paths or common cloud provider infrastructure.
Implement sliding window analysis to detect burst patterns. A single alert in isolation means little. Five instances of the same alert within 30 seconds suggests systematic failure rather than transient noise. Apply statistical tests to distinguish genuine anomaly clusters from random fluctuations.
The chi-squared test works well for comparing observed alert frequencies against expected baselines; for example, testing whether a burst of 12 timeout alerts across three services in 20 seconds is statistically distinguishable from your baseline noise rate, rather than assuming it is.
Machine learning models can improve correlation accuracy over time. Feed resolved incidents back into your training pipeline. Label which alerts were symptoms versus root causes. The model learns which alert combinations predict specific failure modes, enabling proactive suggestions during future incidents.
Designing effective alert suppression hierarchies
Once you identify correlated alerts, suppression rules prevent notification storms from overwhelming your on-call engineers. The principle is straightforward: when a root cause alert fires, suppress its known symptoms for a defined duration. Implementation requires careful consideration of timing, scope, and override conditions.
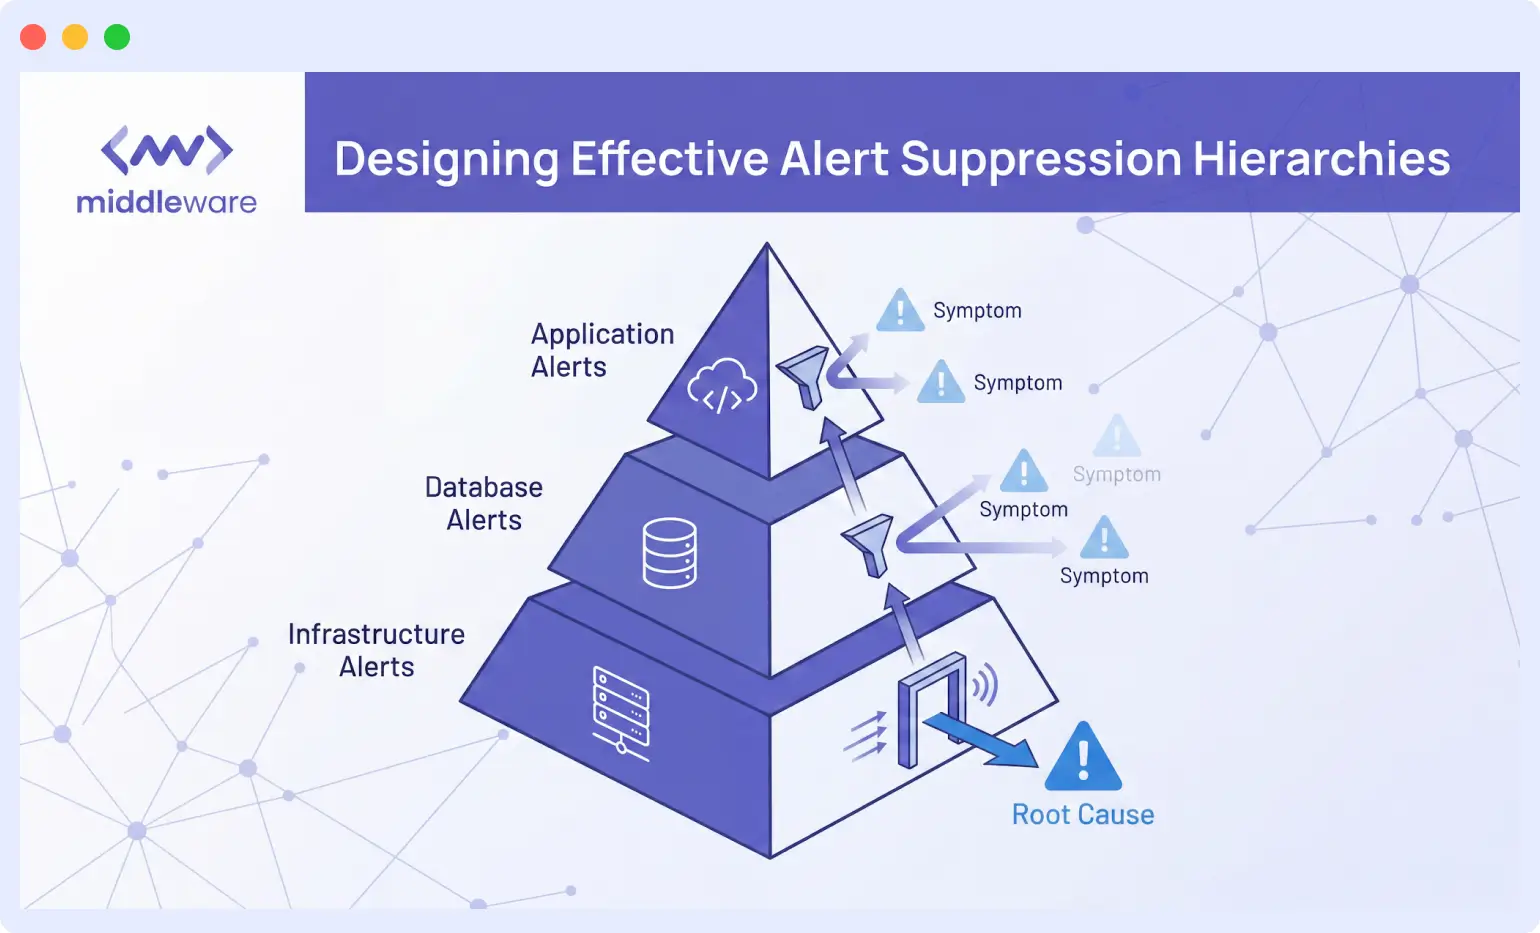
Define suppression hierarchies based on your topology. Infrastructure alerts suppress application alerts. Database alerts suppress service alerts for dependent applications. Network partition alerts suppress everything downstream of the affected segment. Each suppression rule specifies a parent alert pattern, child alert patterns to suppress, and a time window.
Avoid over-aggressive suppression that hides genuine secondary failures. If your primary database fails and you suppress all downstream alerts, you might miss the cascading failure that corrupted your replica synchronization. Implement suppression limits that re-enable child alerts after a threshold count or duration, forcing visibility even when parent issues persist.
Build escape hatches into your suppression logic. Certain alert severity levels should never suppress. Manual override capabilities let engineers see the full picture during complex incidents. Audit logging tracks which alerts were suppressed and why, enabling post-incident review of whether correlation rules performed correctly.
Using real-time alerts and AI-powered anomaly detection, I can proactively address issues before they impact users, leading to better performance and customer satisfaction.
User via G2 Review
Building runbooks that leverage correlation data
Alert correlation becomes actionable when integrated with your incident response procedures. Runbooks should reference correlation context, guiding engineers toward root causes rather than symptoms. When an engineer receives a correlated alert group, the runbook for that group differs from individual alert runbooks.
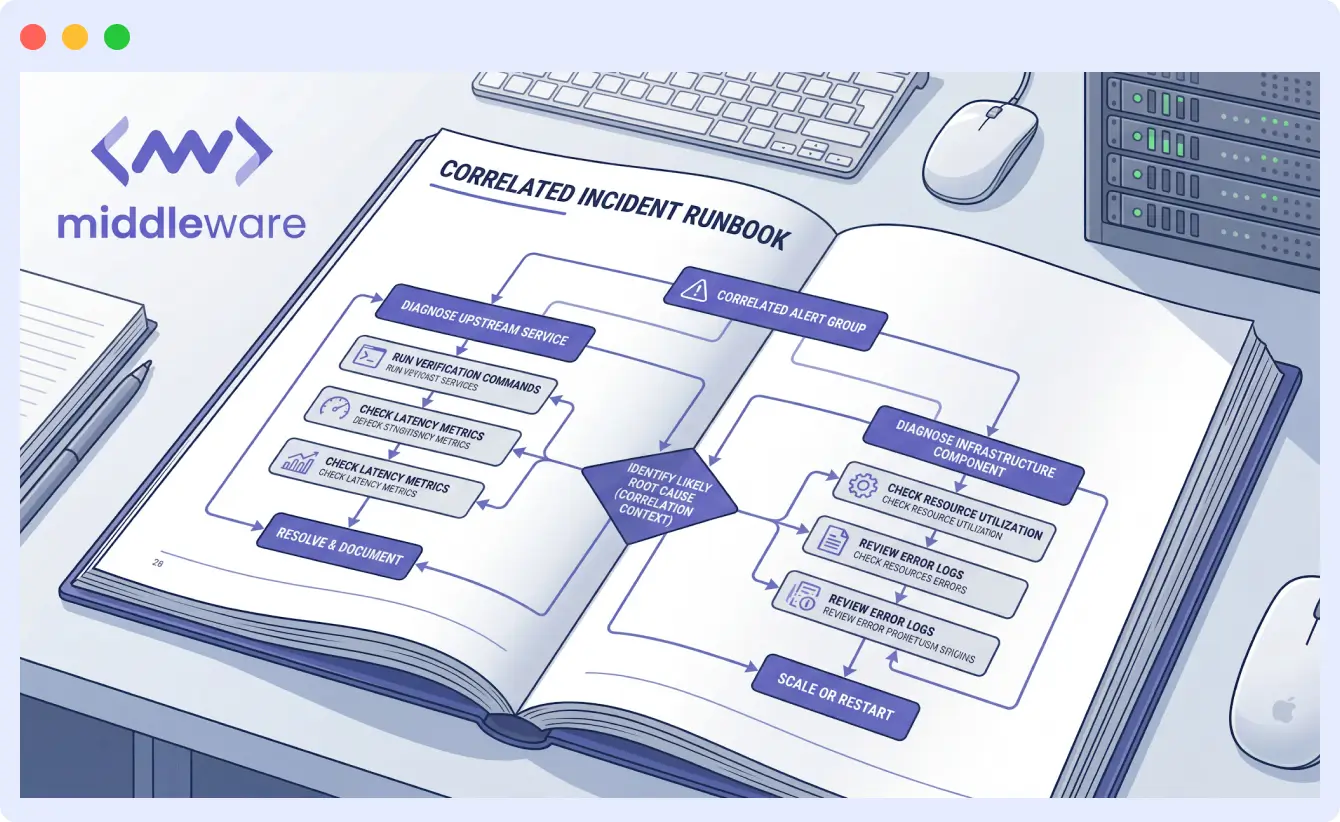
Structure correlated incident runbooks around the likely root cause. Begin with diagnostic commands for the upstream service or infrastructure component. Include verification steps to confirm the correlation hypothesis before diving into remediation. If the initial hypothesis fails, the runbook branches to investigate alternative causes within the correlated set.
Automate initial triage where possible. When your correlation engine groups alerts, trigger automated diagnostics against the suspected root cause. Collect relevant logs, capture current metrics and execute health checks against suspected components. Present this context to the responding engineer alongside the alert notification. They arrive at the incident with data already gathered.
Track runbook effectiveness through incident metrics. Measure time from alert to diagnosis, time from diagnosis to resolution, and correlation accuracy. Feed these metrics back into runbook improvements. If engineers consistently discover that a particular correlation rule groups unrelated alerts, refine the rule or split it into more specific patterns.
Integrating correlation across your observability stack
Alert correlation cannot operate in isolation from your broader observability infrastructure. Metrics, logs, and traces each contribute unique signal to correlation accuracy. Your implementation must unify these data sources into a coherent correlation context.
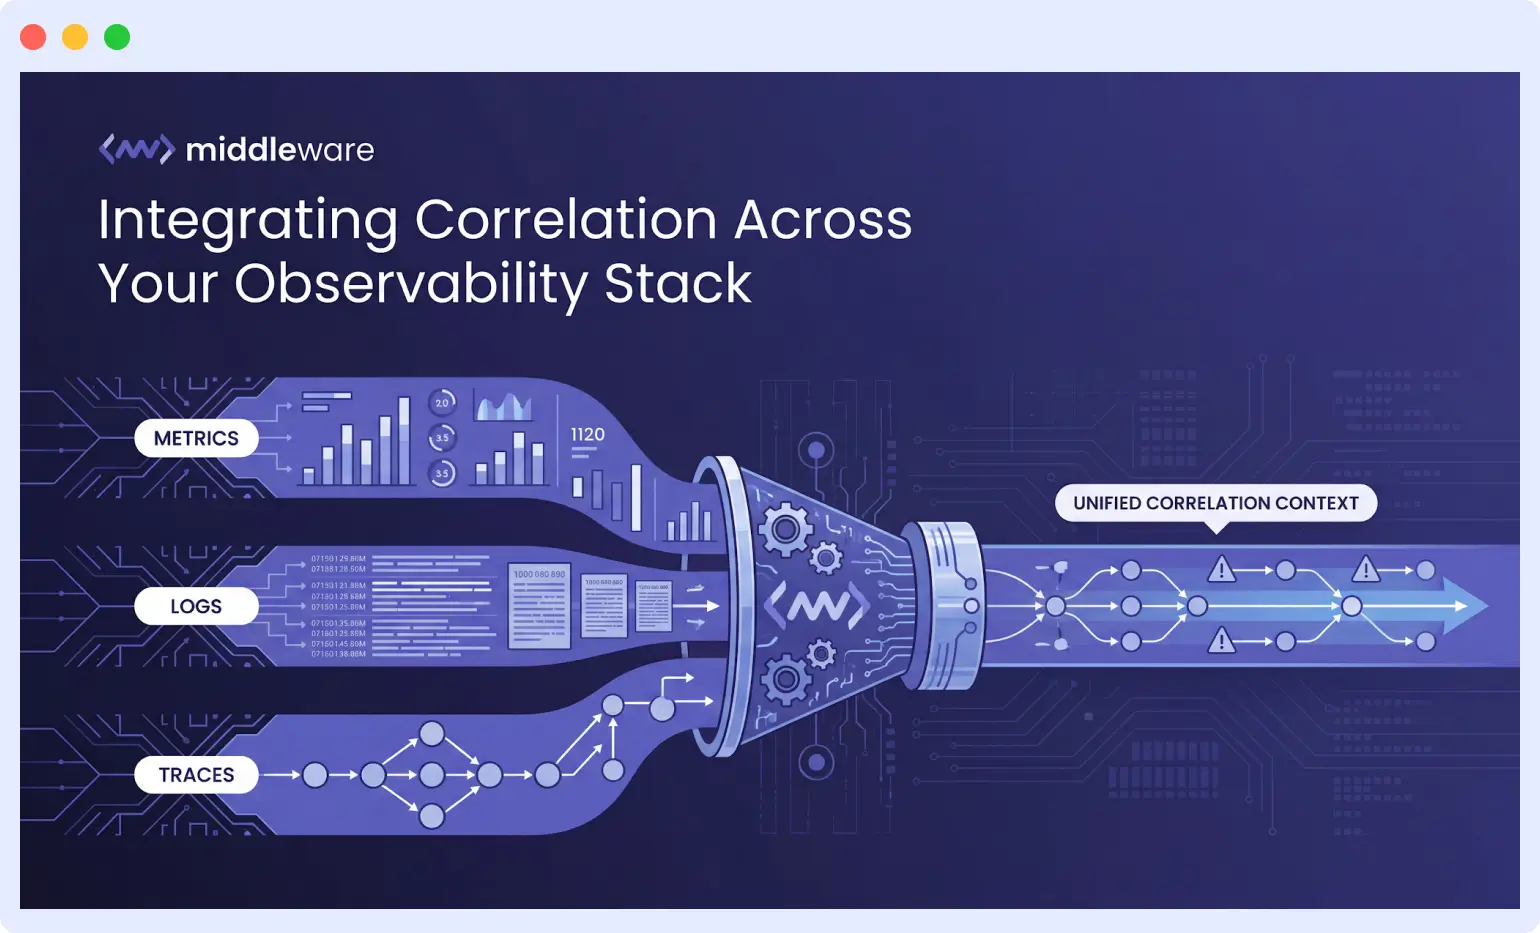
Traces provide the most direct evidence of service dependencies. When a request traverses your microservices, its trace captures each hop, latency, and error condition. Correlate alerts with active traces showing failures. If your checkout alert coincides with traces showing inventory service timeouts, the correlation strengthens. If traces show successful inventory calls, the alerts likely have independent causes.
Logs fill gaps that metrics miss. A database alert might fire due to connection exhaustion, but logs reveal whether connections leaked gradually or failed suddenly. Correlation engines should query relevant log streams when grouping alerts, extracting supporting evidence for the hypothesized root cause.
Centralizing these data sources eliminates the tool-switching overhead that slows incident response. Engineers querying a single platform can validate correlation hypotheses rapidly. They trace from alert to metric to log to trace without context-switching between disparate interfaces.
Middleware brings all of that into one platform, so we can easily detect and fix issues without jumping between tools. It has improved our team’s efficiency, reduced downtime, and given us more confidence in our systems.
Engineer at SLRTCE
Measuring correlation effectiveness and iterating
Implement feedback loops to continuously improve your correlation rules. After each incident, review whether the correlation engine grouped alerts correctly. Did it identify the actual root cause as the parent alert? Did it suppress appropriate symptoms? Did any relevant alerts escape correlation?
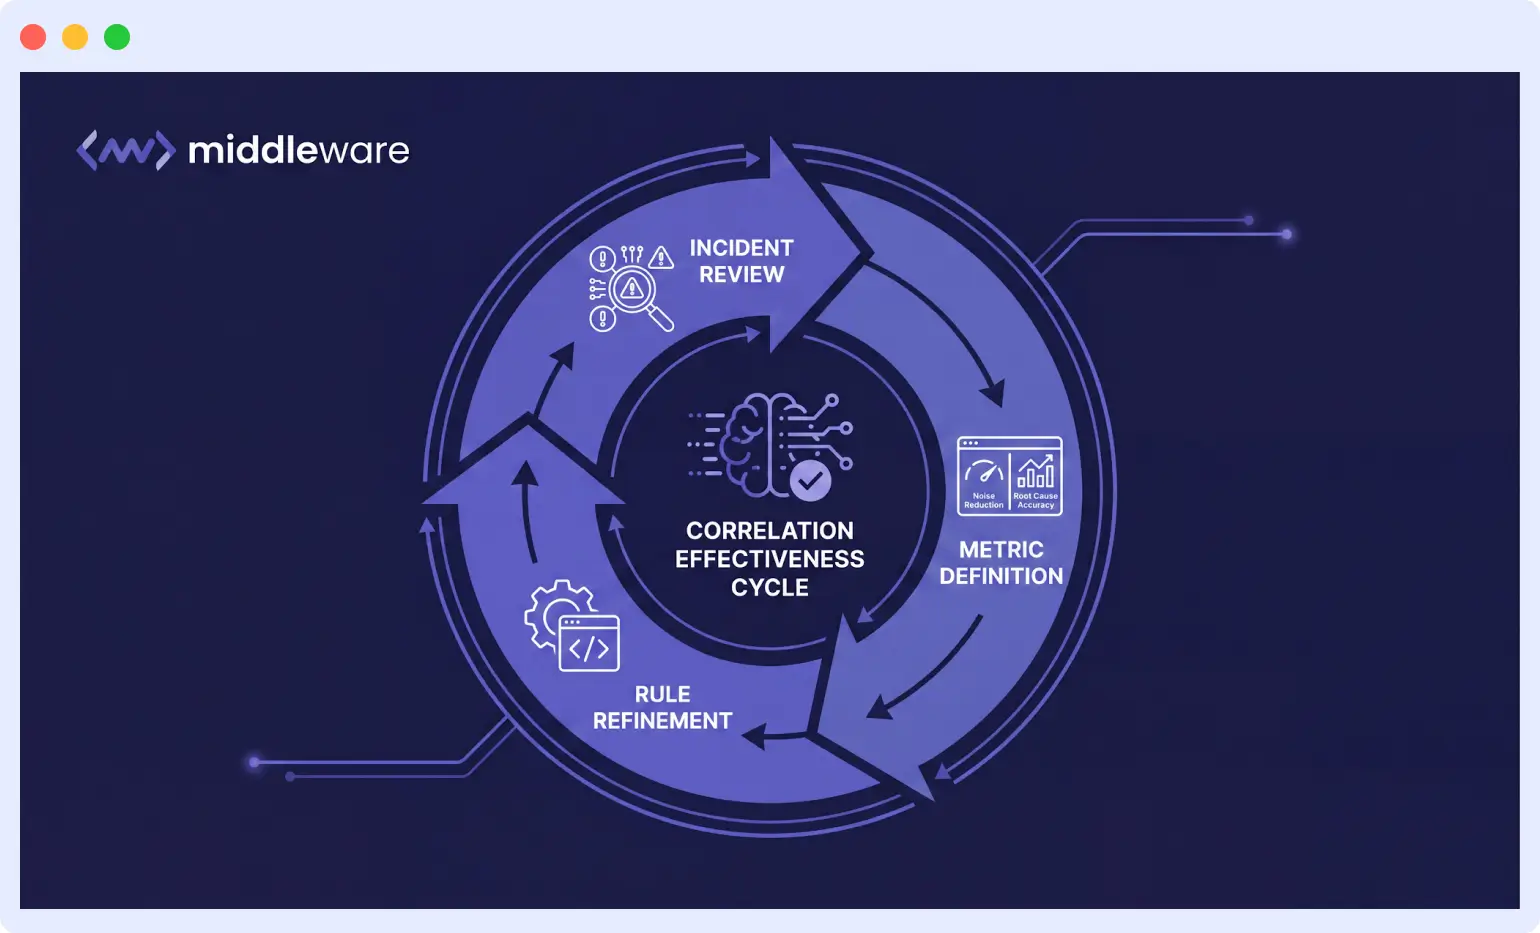
Define quantitative metrics for correlation quality:
- Alert noise reduction — how many individual notifications consolidate into grouped incidents.
- Root cause accuracy — how often the identified parent alert was indeed the root cause.
- False suppression rate — incidents where suppressed alerts represented independent issues requiring separate investigation.
Conduct regular correlation rule reviews with your SRE team. Engineers who respond to incidents develop intuition about which alerts relate to each other. Capture this knowledge systematically. When an engineer manually correlates alerts during an incident, prompt them to suggest a correlation rule. Review these suggestions periodically and implement those that generalize across multiple incidents.
Version your correlation rules alongside your infrastructure code. As your architecture evolves, dependencies change. New services create new correlation opportunities. Deprecated services invalidate existing rules. Treat correlation configuration as living documentation of your system’s failure modes, updated continuously as you learn from production incidents.
Effective alert correlation transforms incident response from reactive symptom chasing into systematic root cause identification. By combining topology awareness, statistical analysis, and unified observability data, SRE teams can reduce alert noise while improving diagnostic accuracy.
The key lies in treating correlation rules as living infrastructure, continuously refined through production incident feedback. Start with your highest-volume alert patterns, implement basic dependency-based grouping, measure the results, and iterate. Each improvement compounds, gradually converting your monitoring system from a noise generator into a genuine diagnostic tool.
FAQs
What’s the difference between alert correlation and alert deduplication?
Deduplication collapses repeated instances of the same alert into one notification. Correlation goes further, grouping different alerts that share a root cause, even when they come from different services or metrics entirely.
What causes alert fatigue in distributed systems?
Alert fatigue comes from treating every metric threshold breach as its own independent event. A single node failure can trigger DNS, timeout, health check, and resource alerts simultaneously, so teams facing dozens of alerts per incident start ignoring notifications or writing overly broad suppression rules, which buries the alerts that actually matter.
How do you choose a correlation time window?
Base it on observed propagation delay in your architecture, not a default. Synchronous call chains fail within seconds, so a short window works. Asynchronous, queue-based systems can delay downstream symptoms by minutes, which needs a wider window to avoid missing related alerts.
Does alert correlation require a full dependency graph to start?
No. Statistical correlation from historical incident data can surface implicit relationships before you’ve built out topology mapping. Most teams layer topology-aware grouping on top once the statistical approach proves the concept.
How does topology-aware alert grouping find the root cause?
It traverses the service dependency graph upstream from the alerts that fired, checking which services depend on which. If a downstream service and its upstream dependency both alert at once, the engine flags the upstream service as the likely root cause instead of treating both alerts as separate problems.
Can statistical correlation replace a dependency graph entirely?
It can get you most of the way there. Statistical correlation finds alerts that historically fire together, including implicit dependencies a topology map would miss, like shared network paths. But it needs enough incident history to be reliable, so most teams use it alongside, not instead of, topology awareness.
How do suppression rules avoid hiding real problems?
By building in escape hatches: suppression limits that re-enable child alerts after a threshold count or duration, severity levels that never suppress, manual override for engineers mid-incident, and audit logging on every suppressed alert so post-incident review can catch a rule that suppressed something it shouldn’t have.
What proves a correlation rule is actually working?
Three numbers: alert noise reduction, root cause accuracy (how often the flagged parent alert really was the cause), and false suppression rate (how often a suppressed alert turned out to matter). Track all three, not just noise reduction alone.
Should alert correlation live in the observability platform or a separate tool?
Running correlation inside the same platform that holds your metrics, logs, and traces removes the tool-switching overhead that slows incident response, since the correlation engine can query all three signal types directly instead of stitching them together through APIs across separate systems.

