



AWS Lambda is a serverless compute service that runs your code in response to events, without requiring you to manage any servers. Developers use it for event-driven and short-running tasks like processing file uploads, handling API requests, and running scheduled jobs.
The code you deploy to Lambda is called a Lambda function, and it handles the specific task you want Lambda to run. In this guide, you’ll use Python to write one, deploy it, prepare it for production, and monitor it.
TL;DR
- AWS Lambda runs your code in response to events without requiring you to manage servers.
- A Python Lambda function uses a handler to receive event data and process it.
- You can create and test a basic function in the AWS console, then connect triggers, such as Amazon S3, to invoke it automatically.
- As your setup grows, you can use layers for shared dependencies, tools like AWS SAM or CDK for repeatable deployments, and container images for larger packages.
- Production functions need proper permissions, input validation, sensible memory and timeout settings, and solid error handling.
- Monitoring logs, metrics, traces, and alerts together helps you catch slow or failed invocations before they affect users.
- Middleware can help you monitor Python Lambda functions alongside the rest of your stack.
What is an AWS Lambda function in Python?
An AWS Lambda function in Python is Python code that runs on AWS Lambda when an event triggers it. AWS provides the Python runtime and the compute resources, so you write the function, and Lambda handles everything else.
Each function usually handles one specific task. It might process a file uploaded to Amazon S3, respond to an HTTP request, or update a database after an event fires. You focus on the logic, and Lambda takes care of running it.
One thing worth clarifying before going further: AWS Lambda and Python’s built-in lambda keyword are completely different things. AWS Lambda is a cloud service that runs code in response to events. Python’s lambda keyword creates small anonymous functions inline, like this:
multiply = lambda x, y: x * yThat has nothing to do with AWS Lambda. You can write a regular Python function with def and deploy it as an AWS Lambda function just fine. Whenever you see “Python Lambda function” in this guide, it means an AWS Lambda function written in Python, not a function created with Python’s lambda keyword.
Now that you know what a Python Lambda function is, let’s look at how it actually works.
How does an AWS Lambda function in Python work?
A Python Lambda function runs when something triggers it. That trigger could be an API request, a file upload, a scheduled event, or a message from another AWS service. When it happens, AWS prepares the environment needed to run your code, calls your function, and passes the event data.
The basic flow looks like this:
- An event occurs
- Lambda starts or reuses an execution environment
- Lambda calls the function handler
- The handler processes the event
- The function returns a result or finishes the task
Python Lambda handler
The Python Lambda handler is the entry point Lambda calls every time your function runs. It receives two arguments: the event data and a context object.
A basic handler looks like this:
def lambda_handler(event, context):
    return {
        "statusCode": 200,
        "body": "Hello from Lambda"
    }
Lambda also needs to know where to find the handler. The handler setting follows this format: file_name.function_name. So if your file is lambda_function.py and the function is lambda_handler, the setting becomes lambda_function.lambda_handler. If you rename either one, update this setting too, or Lambda won’t find it.
Event object
The event object contains the data your function needs to process. Lambda passes it to the handler automatically when the function runs.
A simple test event might look like this:
{
    "name": "sanjay"
}
You can read that value in the handler:
def lambda_handler(event, context):
    name = event["name"]
    return {
        "message": f"Hello, {name}"
    }
The structure of the event depends on what triggered the function. An S3 event includes details about the bucket and uploaded object. An API Gateway event sends a different set of data. Your handler needs to read whatever structure the trigger sends.
Context object
The context object contains information about the current invocation and execution environment. AWS passes it to the handler automatically, along with the event.
You can use it to view details such as the request ID, function name, function version, allocated memory, and remaining execution time. For example:
request_id = context.aws_request_idYou won’t need every property in most functions, but context is useful for logging and debugging, especially when you need to track a specific invocation.
Python runtime
The Python runtime is the environment Lambda uses to run your code. It handles passing the event and context to the handler and returning the response.
As of August 2026, Lambda supports Python 3.10 through Python 3.14. Python 3.10 is scheduled to be deprecated on October 31, 2026, so choose a newer runtime, such as Python 3.14, for any new functions you create.
Triggers
A trigger connects your Lambda function to a service that can invoke it when an event occurs. Common examples include Amazon S3 invoking a function when someone uploads a file, API Gateway invoking it when an HTTP request arrives, and EventBridge invoking it on a schedule or when an event matches a rule.
Services like SQS, Kinesis, and DynamoDB Streams work a little differently. They use event source mappings, which poll for new records and invoke your function in batches rather than with a single event.
Let’s put everything together with a real example.
How to create your first AWS Lambda function in Python
In this example, you’ll create a Lambda function that works with Amazon S3. When you upload a file, S3 will trigger the function. The function will read the file metadata from the event and save it back to the bucket as a JSON file.
Before you start, you’ll need an AWS account, basic Python knowledge, and permission to create Lambda, S3, and IAM resources.
Important: When you create a Lambda function through the console, AWS can create an execution role for you. That basic role lets the function send logs to CloudWatch, but it does not give the function permission to write to S3. If your function later fails at
s3.put_object(), this is one of the first things to check.
Step 1: Create an S3 bucket
Create a general-purpose S3 bucket in the same AWS Region as the Lambda function. Give it a unique name like lambda-python-demo-sanjay.
Note: S3 bucket names are globally unique, so you’ll probably need to use a different name. Use that same bucket name anywhere you see
lambda-python-demo-sanjay.
Use the same bucket for both input and output:
uploads/    # files that trigger the function
processed/  # JSON files created by the function
Use uploads/ for files that should trigger the function and processed/ for the JSON files the function creates. Because the S3 trigger only watches uploads/, files written to processed/ won’t trigger the function again.
Step 2: Create the Lambda function
In the Lambda console, create a function from scratch. Give it a name like process-s3-upload and choose Python 3.14 as the runtime. Allow Lambda to create the basic execution role for now. You’ll add the S3 permission yourself so the function only gets the access it needs.
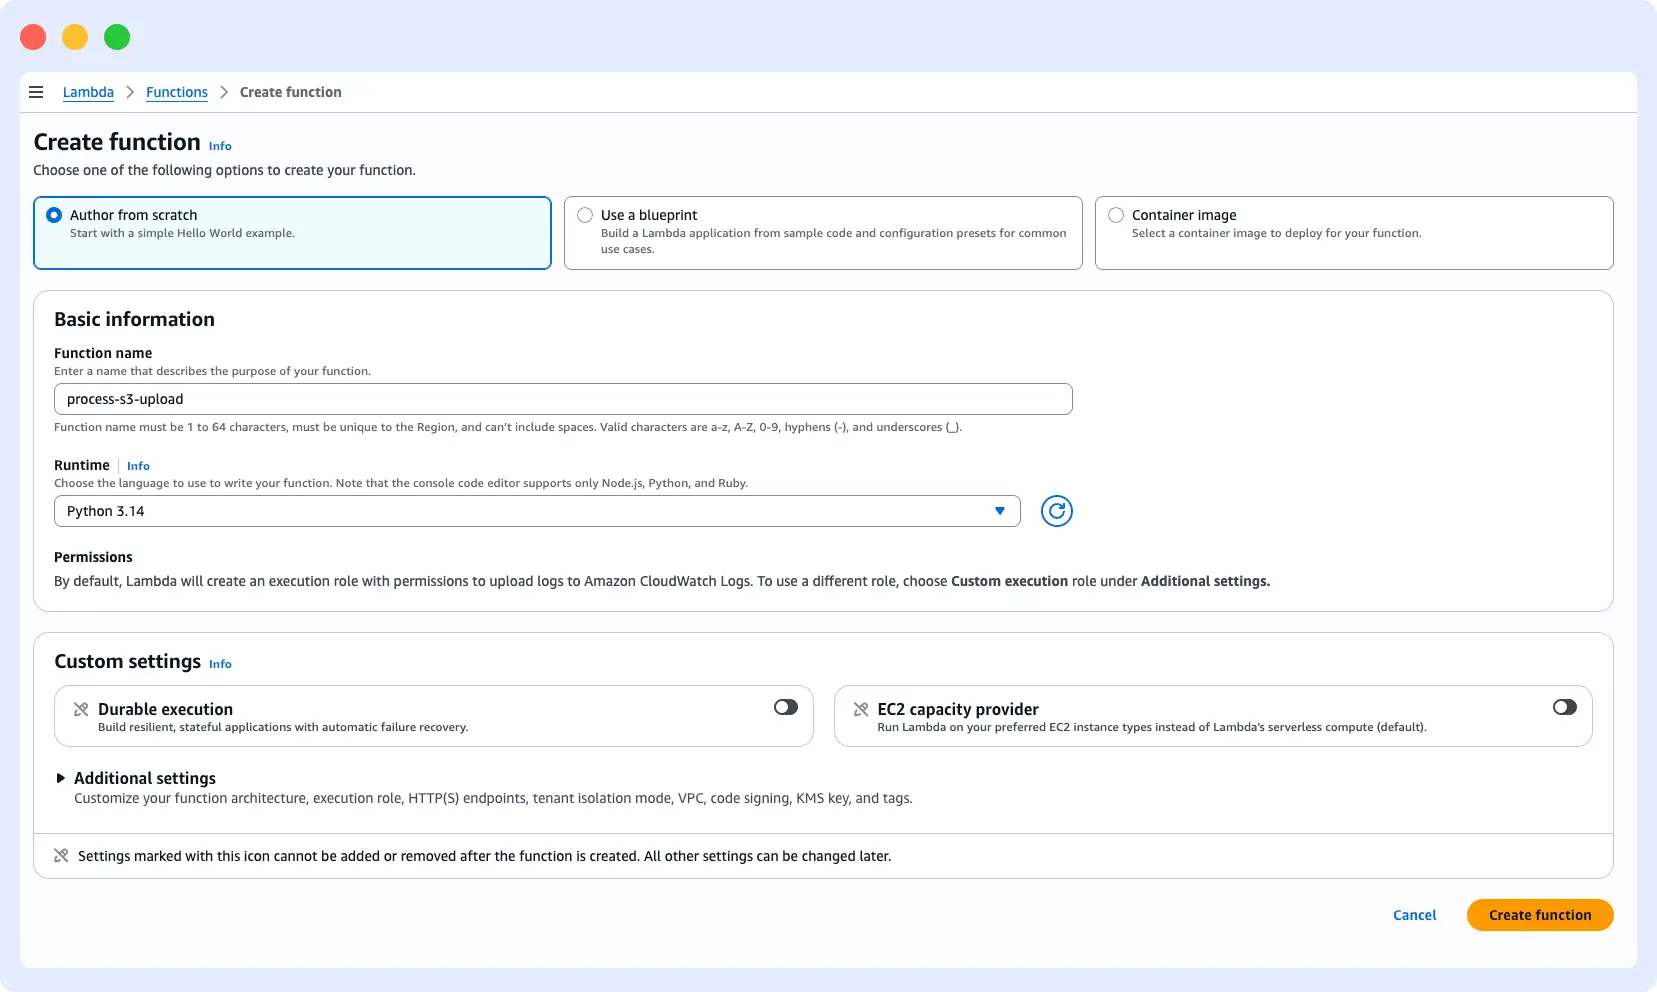
Once AWS creates the function, you’ll see the built-in code editor with a lambda_function.py file.
Step 3: Add the handler and configuration
Replace the starter code with this:
import json
import os
import urllib.parse

import boto3


s3 = boto3.client("s3")


def lambda_handler(event, context):
    record = event["Records"][0]["s3"]

    source_bucket = record["bucket"]["name"]
    object_key = urllib.parse.unquote_plus(record["object"]["key"])
    object_size = record["object"]["size"]

    output_bucket = os.environ["OUTPUT_BUCKET"]
    file_name = object_key.split("/")[-1]
    output_key = f"processed/{file_name}.json"

    metadata = {
        "source_bucket": source_bucket,
        "file_name": file_name,
        "size": object_size
    }

    s3.put_object(
        Bucket=output_bucket,
        Key=output_key,
        Body=json.dumps(metadata),
        ContentType="application/json"
    )

    print(f"Processed {object_key}")

    return {
        "statusCode": 200,
        "body": json.dumps(metadata)
    }
The function gets the bucket name, object key, and file size from the S3 event. It then creates a small JSON file and writes it under processed/.
Notice that the boto3 S3 client sits outside the handler. That lets Lambda reuse the client when it reuses the same execution environment, instead of creating a new client every time the handler runs.
After replacing the starter code, choose Deploy to save the code changes. Next, add an environment variable under the function configuration:
OUTPUT_BUCKET=lambda-python-demo-sanjayKeeping it outside the code makes the configuration easier to change later.
Now fix the permission gap we mentioned earlier. The function calls s3.put_object(), so its execution role needs permission to write under processed/.
Add an inline policy like this to the role:
{
    "Version": "2012-10-17",
    "Statement": [
        {
            "Effect": "Allow",
            "Action": "s3:PutObject",
            "Resource": "arn:aws:s3:::lambda-python-demo-sanjay/processed/*"
        }
    ]
}
This is better than giving the function full S3 access. It can write where it needs to and nowhere else.
Step 4: Test the function, then connect S3
Before connecting the real S3 trigger, test your AWS Lambda function manually using a test event. This helps you tell whether a problem comes from your code and permissions or from the S3 trigger.
Create a test event with:
{
    "Records": [
        {
            "s3": {
                "bucket": {
                    "name": "lambda-python-demo-sanjay"
                },
                "object": {
                    "key": "uploads/test-file.txt",
                    "size": 1024
                }
            }
        }
    ]
}
If it works, Lambda should show a successful execution. Then open your S3 bucket and check processed/. You should see:
processed/test-file.txt.jsonIf the function runs but no file appears, check the execution role first. The function may not have permission to use s3:PutObject.
Once the manual test works, connect the real S3 trigger. Choose your bucket, select All object create events, and use the prefix uploads/.
Finally, create an uploads folder in the bucket and upload a small file. S3 should now invoke the Lambda function automatically and create the matching JSON file under processed/.
How to deploy a Python Lambda function
When you deploy Python to AWS Lambda, the simplest way to start is with a ZIP package. It’s enough for most small functions. You’ll only need something else when your setup starts growing beyond what ZIP can handle.
If you have several functions, shared dependencies, or more AWS resources to manage, tools like SAM, Serverless Framework, CDK, layers, or container images can make deployment easier.
Deploy with a ZIP file
To create one:
- Put your Lambda code in a folder.
- Install any required packages into that same folder.
- ZIP the contents.
- Upload the ZIP file to Lambda.
For example, if your function uses requests, install it with:
pip install requests -t .Then create the ZIP file:
zip -r lambda-function.zip .Keep your handler file and dependencies at the root of the ZIP file. If you put them inside another folder, Lambda may not find the handler or packages when the function runs.
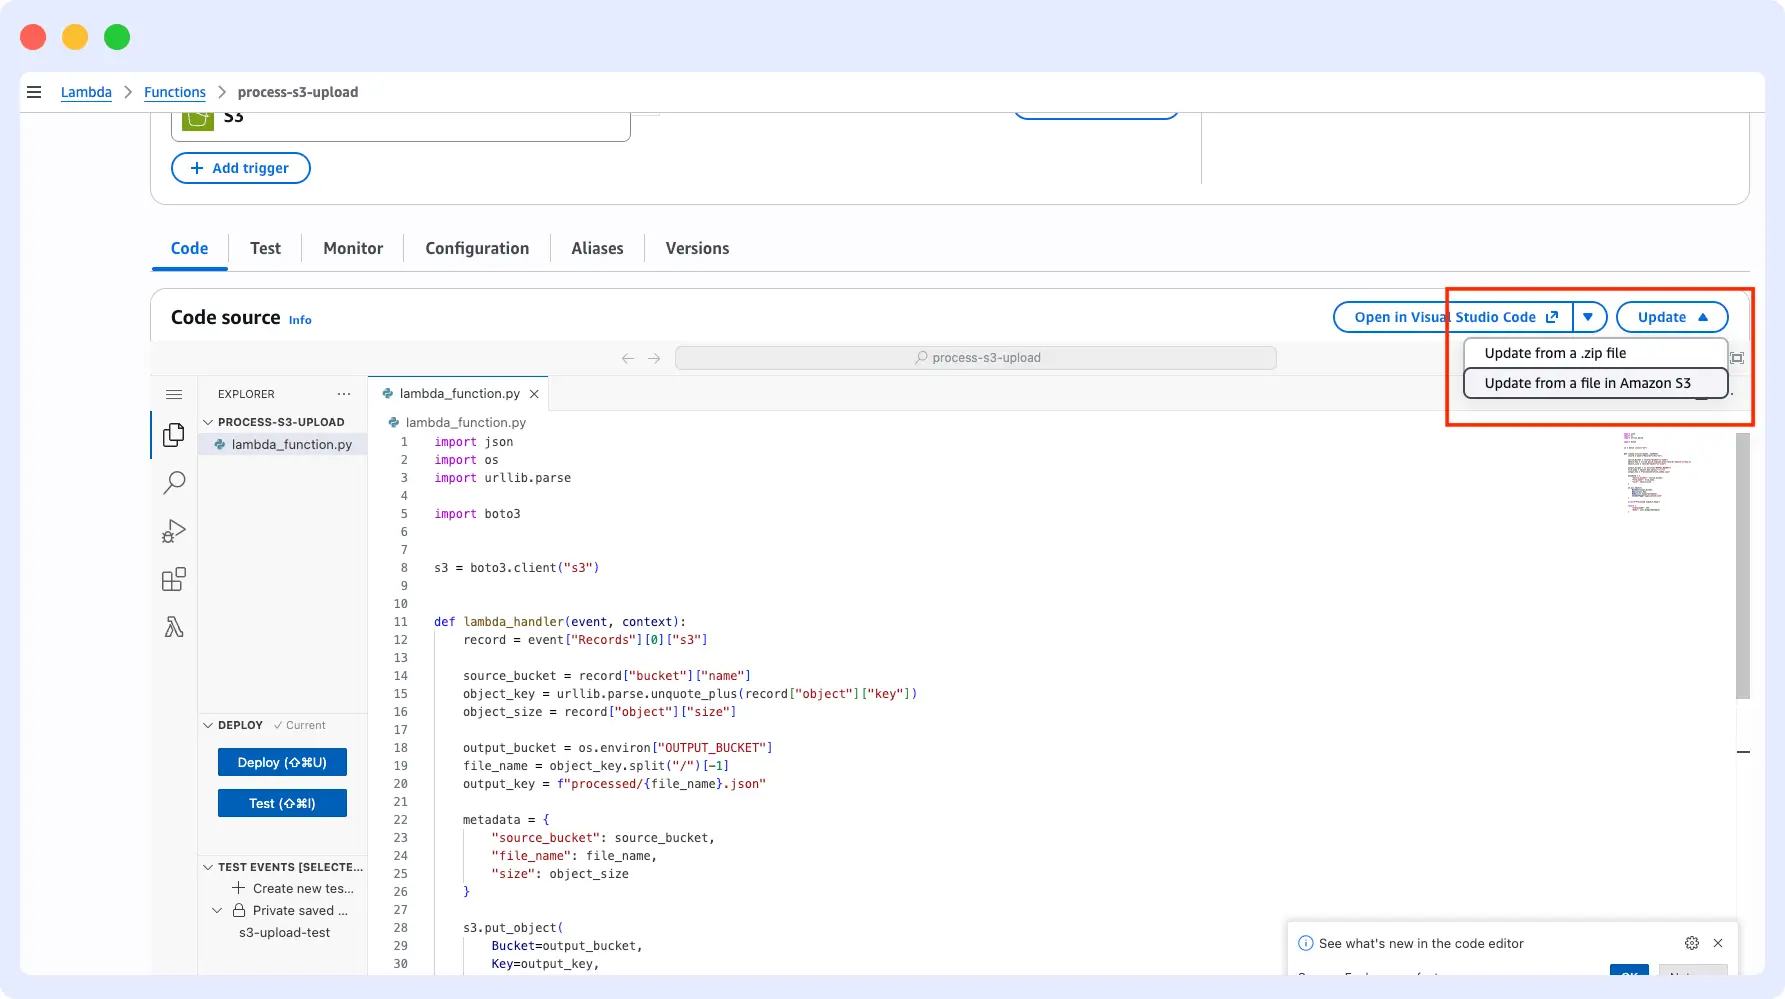
Once the ZIP file is ready, open your Lambda function, go to the Code tab, open the Update menu, and choose Update from a .zip file.
If your package includes libraries with compiled code, such as NumPy or Pandas, make sure they work with the Linux environment Lambda uses.
ZIP works well until you start managing several functions, shared resources, or repeatable deployments. At that point, doing everything manually can become harder to manage.
Other deployment options
Each option fits a different kind of setup, so pick the one that actually solves your problem.
- AWS SAM: Use SAM when you have several Lambda functions or other AWS resources and want to define and deploy them together. It also gives you a repeatable way to build, test, and deploy from your local machine.
- Lambda layers: Use layers when multiple functions need the same libraries or shared code. Instead of packaging the same dependency with every function, you can keep it in a layer and reuse it.
- Container images: Use a container image when your function has extensive dependencies, requires OS-level packages, or needs greater control over the runtime environment.
- Serverless Framework and AWS CDK: Both can help you manage Lambda functions and related infrastructure as code. Serverless Framework is useful if your team already uses it for serverless applications, while CDK is better suited to teams that prefer defining AWS infrastructure in languages such as Python or TypeScript.
If you’re building one small function, a ZIP package is the easiest place to start. If you’re managing several functions and AWS resources together, use a tool like SAM, Serverless Framework, or CDK. Use layers for shared dependencies, and move to containers when a ZIP package no longer meets your function’s needs.
AWS Lambda Python best practices for production
Getting a Lambda function to run is the easy part. Production is where small choices around retries, permissions, memory, and concurrency start to matter.
For a broader look at keeping AWS workloads healthy in production, see Middleware’s AWS monitoring best practices guide.
Validate event data
Don’t assume every event will contain exactly what your function expects. Check required fields early and handle missing or invalid values before the rest of your code runs.
This matters even more when events come from APIs, file uploads, queues, or other services you don’t fully control. A missing field should cause a clear validation error, not turn into an error that is hard to debug halfway through the function.
Handle errors and retries
Some Lambda invocations can run more than once, especially when AWS retries a failed event. That becomes a problem if one invocation sends an email, creates a payment, writes a file, or updates a database, then the next attempt does the same thing again.
Design functions that can run more than once to be idempotent. In simple terms, processing the same event twice should ideally leave you with the same result as processing it once.
For asynchronous invocations, you can also control how Lambda retries failed events and send events that still fail to a destination or dead-letter queue. Don’t just keep trying and hope the next attempt works. Save failed events somewhere you can review them later.
Limit permissions and protect secrets
Give the function only the AWS permissions it actually needs. For example, if it only needs to write files to a single S3 path, don’t grant it full access to every S3 bucket.
This also makes permission problems easier to handle. When a function has a small, specific policy, you can quickly see what it can and can’t access.
Keep passwords, API keys, and database credentials out of the code too. Environment variables work well for normal configuration like bucket names, but use a secrets service like AWS Secrets Manager for sensitive values.
Configure memory, timeout, and concurrency
Don’t automatically choose the lowest memory setting because it looks cheaper. Lambda gives your function more CPU as you increase memory, so a function with more memory can sometimes finish faster and cost less overall.
Test a few settings against the workload your function actually handles.
Do the same with timeout. Set enough time for normal execution, but don’t give a function several minutes when it should usually finish in a few seconds. A long timeout can leave a stuck function running longer than expected. For a deeper look at diagnosing and fixing timeout issues, see Middleware’s guide to Lambda timeout best practices.
Concurrency matters when Lambda talks to something with its own limits. A sudden spike in Lambda invocations can overwhelm a database, third-party API, or another downstream service. Reserved concurrency can help you put a ceiling on how many executions run at once. If you’re unsure where those limits sit, Middleware’s guide to AWS Lambda’s service quotas covers what’s adjustable and what’s fixed.
Reduce cold starts
A cold start occurs when Lambda must create a new execution environment before running your function.
You can reduce unnecessary startup work by:
- Keeping the deployment package small
- Removing packages you don’t use
- Initializing reusable clients outside the handler
- Avoiding heavy setup work before the handler runs
If startup latency really matters, provisioned concurrency can keep execution environments ready before requests arrive.
But don’t optimize cold starts just because they exist. Measure your function first. If cold starts aren’t causing noticeable latency for users or downstream systems, you probably have more important things to fix.
Monitor your Python Lambda functions in production
Once your Python Lambda function is running, the next question is how to know it’s working the way you expect. Lambda gives you logs, metrics, traces, and alerts to work with. The important thing is knowing which signals actually matter and what to do when they tell you something is wrong. Middleware’s AWS observability solution brings those signals together with the rest of your AWS stack.
What to watch and why it matters
Logs
Start with logs when something goes wrong. Look for the error, the request ID, and the event that triggered the invocation. That combination usually tells you what happened and where.
Don’t log everything, though. Too much noise makes it harder to find the things you’re actually looking for. Stick to errors, request IDs, and a few meaningful processing details. Keep passwords, API keys, and other sensitive data out entirely.
One thing you should know is that if your function completes successfully but the full request is still slow, the logs may not show anything wrong. That usually means Lambda isn’t the problem. Check other services the function depends on, because the delay is likely happening there. For more on getting useful signals from CloudWatch, see how to analyze AWS CloudWatch logs and metrics with Middleware.
Metrics
The major Lambda metrics are invocations, errors, duration, throttles, and concurrent executions. But if you look at them in isolation, you’ll miss the point. The real signal is how they move together.
For example, if duration starts climbing and errors rise shortly after, the function is probably slowing down until some invocations start failing. At that point, check what the function depends on. If concurrent executions are also climbing, the problem may not be Lambda at all. A database or third-party API struggling under load will appear to be a Lambda problem if you’re not looking at the full picture.
Throttles need separate attention. Throttling means Lambda couldn’t run some invocations because it hit a concurrency limit. Those requests get rejected, delayed, or retried depending on how the function is invoked. If throttling keeps recurring, something needs to change upstream, whether that’s the concurrency limit, the rate at which events are arriving, or both.
Traces
When a request takes longer than expected, logs and metrics can tell you something is slow but rarely show where all the time was spent. A trace follows the request from the moment it hits your function through every downstream call it makes. If Lambda finishes in 40ms but the full request takes two seconds, a trace will show you exactly which downstream call consumed that time. Without it, you’d just be guessing.
If distributed tracing is new to you, Middleware’s distributed tracing guide is a good place to start.
Alerts
Alerts should tell you when something needs attention, not every time a metric moves. A single failed invocation doesn’t need an alert. However, a steady climb in error rate over several minutes, repeated timeouts, or throttling that keeps recurring are patterns worth alerting on because they indicate something that will keep getting worse.
Focus alerts on error rate, duration consistently exceeding normal, throttling that runs for several minutes, and failed async events piling up in a dead-letter queue. Keep them focused on problems someone can act on. Too many alerts lead to the important ones getting ignored.
Monitor your Python Lambda function with Middleware
Middleware collects traces, metrics, logs, and custom telemetry from your Lambda function and brings them into one place. Instead of switching between CloudWatch and X-Ray, you get a single view of what the function is doing, how it’s performing, and what’s happening across the services it talks to. See how Middleware compares to CloudWatch for the fuller breakdown. For a broader look at what Lambda observability covers, see Middleware’s AWS Lambda observability guide.
How does Middleware instrument a Python Lambda function?
For Python Lambda functions, Middleware uses OpenTelemetry delivered through two Lambda layers. For more on how Middleware handles auto-discovery and zero-code instrumentation more broadly, see how Middleware simplifies OpenTelemetry setup.
- OpenTelemetry Collector layer: It runs as an in-process Lambda extension, meaning it starts alongside your function and remains alive until the container freezes. This matters because Lambda containers freeze immediately after your handler returns, and any telemetry that hasn’t been flushed by then is lost. The
decoupleprocessor incollector.yamlhandles that by buffering spans and flushing them before the freeze. - Python auto-instrumentation layer: It patches your handler and Python libraries using
AWS_LAMBDA_EXEC_WRAPPER=/opt/otel-instrument, so instrumentation starts before your handler runs. You don’t have to change your application code.
Add the Collector layer first, then the auto-instrumentation layer. The order is important because the Collector must be running before the instrumentation layer attempts to export to it. The layer ARNs also need to match your function’s AWS Region and CPU architecture. Always copy the current values from the AWS Lambda setup guide since layer versions change over time.
Environment variables
After adding both layers, set these environment variables in your Lambda configuration:
AWS_LAMBDA_EXEC_WRAPPER=/opt/otel-instrument
OPENTELEMETRY_COLLECTOR_CONFIG_URI=/var/task/collector.yaml
OPENTELEMETRY_EXTENSION_LOG_LEVEL=info
OTEL_BSP_SCHEDULE_DELAY=500
OTEL_EXPORTER_OTLP_ENDPOINT=http://localhost:9320
OTEL_LAMBDA_DISABLE_AWS_CONTEXT_PROPAGATION=true
OTEL_PROPAGATORS=tracecontext
OTEL_EXPORTER_OTLP_ENDPOINT points to localhost:9320, not directly to Middleware. Your function exports telemetry to the local in-process Collector, which re-exports it to your Middleware account. The collector.yaml file handles that routing.
Log correlation
To connect logs to their originating traces, set your Lambda log format to JSON first. Go to Lambda → Functions → your function → Configuration → Monitoring and operations tools, click Edit, and set log format to JSON.
Then configure your logger in the handler:
import json
import logging

def lambda_handler(event, context):
    logger = logging.getLogger("your-service-name")
    logger.setLevel(logging.DEBUG)
    logger.debug("Debug message")
    logger.info("Processing started")
    logger.propagate = False  # prevents duplicate logs in Middleware
    logging.shutdown()
    return {"statusCode": 200, "body": json.dumps("Hello from Lambda!")}
Setting logger.propagate = False is important. Without it, the same log entry gets picked up by both the root logger and your named logger, and you’ll see duplicates in Middleware.
What can you see in Middleware after setup?
After setup, invoke the function and open APM → Services in Middleware. Find the service name you configured. If traces and logs are coming through, you’ll see requests, latency, error rate, and individual traces from the service page.
From there, you can open a specific trace to see exactly where time was spent, whether that’s inside the function, waiting on a database call, or blocked on a downstream API. If your function talks to other instrumented services, Service Maps will show the connections between them, with request traffic, errors, and latency on each edge.
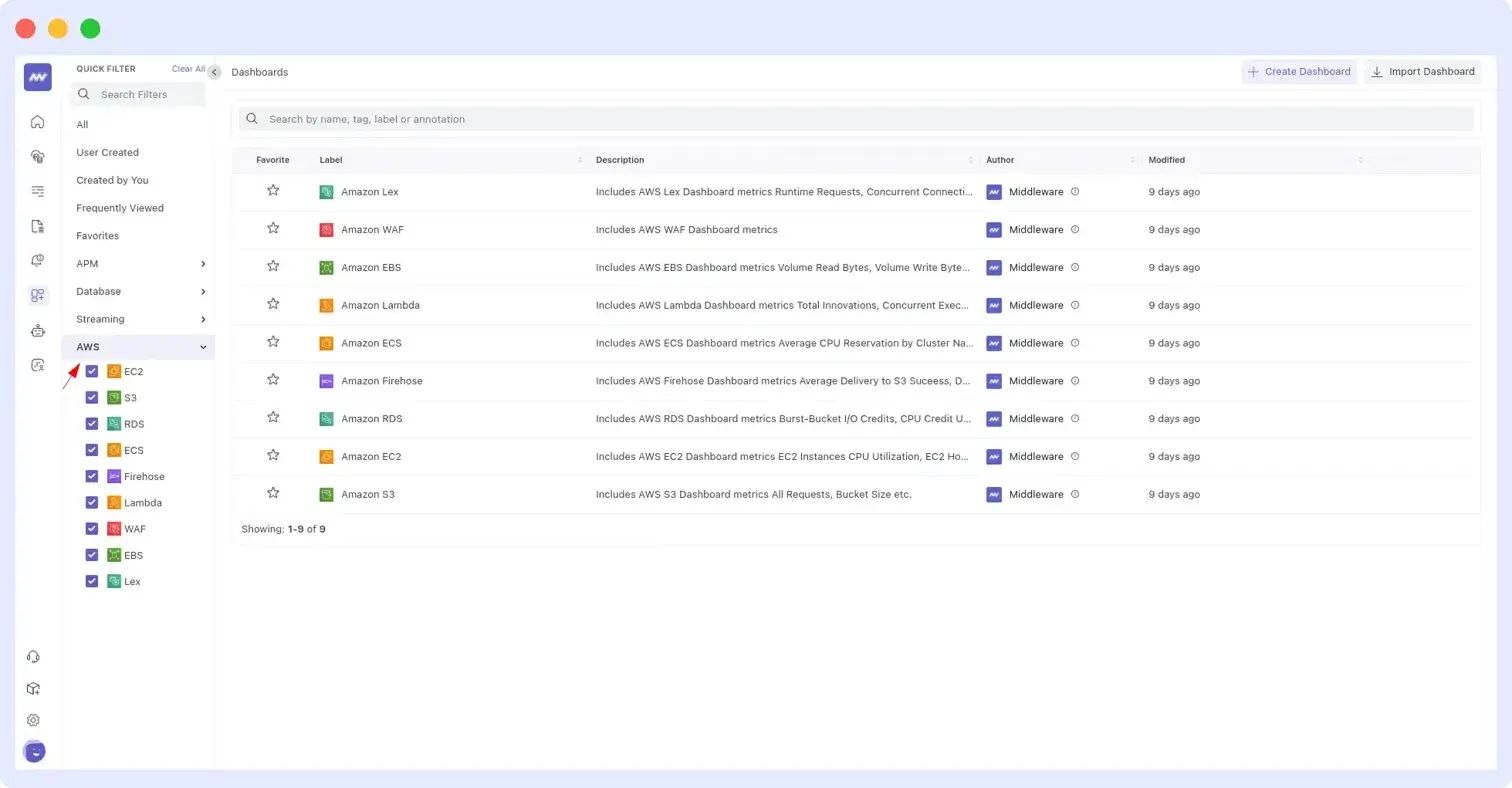
For CloudWatch metrics, invocations, errors, duration, throttles, and concurrent executions, enable the AWS Integration in Middleware and toggle the Lambda namespace. Middleware pulls those metrics automatically and generates a Lambda dashboard so you’re not building one from scratch. For a deeper look at AWS monitoring best practices, see Middleware’s AWS monitoring guide.
Alerting and OpsAI
Once your metrics and traces are flowing, set up two-tier alerts, a Warning threshold and a Critical threshold, evaluated over 5 to 10 minute windows. The metrics worth alerting on are error rate, p95/p99 duration, throttle count, and concurrent executions. One spike doesn’t mean much. If the same metric keeps crossing that threshold over a 10-minute window, that’s worth paying attention to.
Setting those thresholds manually takes time, so OpsAI lets you describe what you want in plain language. Something like “alert me when Lambda duration p99 exceeds 800ms” is enough to generate the alert config. It also flags new or spiking errors automatically and can suggest fixes for supported SDKs, which speeds up triage when something breaks in production.
FAQs
What can trigger an AWS Lambda function?
AWS Lambda can run in response to events from services like Amazon S3, API Gateway, EventBridge, SNS, SQS, and DynamoDB. You can also invoke a Lambda function directly from an application or another AWS service.
How do I run Python code in AWS Lambda?
Write your function with a handler that accepts event and context, choose a supported Python runtime like Python 3.14 when creating the function, deploy your code as a ZIP package or through the console editor, then invoke it with a test event or connect a trigger. The handler is the entry point Lambda calls every time the function runs.
Does AWS Lambda include Boto3?
Yes. AWS Lambda’s managed Python runtimes include Boto3, the AWS SDK for Python. For deployment packages, AWS recommends including your own dependencies, such as Boto3, so you can control their versions and avoid dependency mismatches.
Can I use external Python packages in AWS Lambda?
Yes. You can include external packages in a ZIP deployment package, add them through a Lambda layer, or include them in a container image. Make sure compiled packages match the Linux environment and CPU architecture your Lambda function uses.
How do I test a Python Lambda function?
The fastest way is to create a test event in the Lambda console and invoke the function manually. A test event is a JSON payload you define that simulates what a real trigger would send, like an S3 upload or API request. Lambda runs the function with that payload and shows you the execution result, logs, and any errors. For larger projects, you can write unit tests locally and use AWS SAM to test functions before deploying them.
How long can a Python Lambda function run?
A standard Lambda function can run for up to 900 seconds, or 15 minutes, per invocation. You can configure the timeout from 1 second up to that limit. If your workload regularly needs more time than that, see AWS Fargate vs Lambda for when a longer-running compute option makes more sense.
How do I monitor a Python Lambda function?
Start with CloudWatch for Lambda logs and core metrics like errors, duration, invocations, and throttles. For deeper visibility, add distributed tracing so you can follow a request across the services your function calls, not just what happens inside Lambda. Middleware connects traces, metrics, and logs in one place, so when a function slows down or fails, you can see exactly where the problem started without jumping between tools.
Is AWS Lambda the same as Python’s lambda function?
No. AWS Lambda is a cloud service that runs code in response to events. Python’s lambda keyword creates small anonymous functions inline for short expressions. You can write a regular Python function with def and deploy it to AWS Lambda without ever using Python’s lambda keyword.

