



Lambda makes shipping serverless applications fast, but troubleshooting slow executions, cold starts, or failed invocations often means switching between CloudWatch, X-Ray, and multiple monitoring tools. This guide walks you through setting up end-to-end AWS Lambda observability with Middleware from connecting your AWS account and enabling OpenTelemetry-based remote instrumentation to collecting correlated logs, metrics, and traces. You’ll also see a real production debugging scenario that shows how unified observability helps you identify and resolve issues much faster.
Key takeaways
- AWS Lambda observability means having traces, logs, and metrics correlated in one place, not scattered across CloudWatch, X-Ray, and separate dashboards.
- Middleware brings Lambda observability and monitoring together using OpenTelemetry based remote instrumentation, with no changes to function code.
- Setup takes under 15 minutes: connect AWS, select functions to monitor, add two Lambda layers, and configure alerts.
- Alerts with click-to-correlate take you straight from a fired alert to the exact trace and logs involved, no manual hunting across tools.
- In a real debugging scenario, correlated observability data cut Lambda root cause identification from roughly 40 minutes to under 8.
- Middleware is OpenTelemetry native, giving you a vendor-neutral path to serverless observability across Lambda and the rest of your AWS stack.
- Middleware runs on a 14-day free trial with unlimited ingestion, then $0.30/GB pay-as-you-go, no credit card required to start.
What is AWS Lambda observability?
AWS Lambda observability is the ability to understand what’s happening inside your Lambda functions by correlating three signals: traces, logs, and metrics, instead of checking them separately. Native AWS tools split this across CloudWatch (logs and metrics) and X-Ray (traces), so diagnosing a problem means manually connecting a timestamp in one tool to a trace in another. Proper Lambda observability links all three automatically, so a slow invocation, a spike in errors, or a cold start pattern can be traced back to its root cause from a single screen.
What this AWS Lambda monitoring guide covers
We’ll start by connecting your AWS account to Middleware, then narrow down to the Lambda functions worth monitoring. From there, we’ll enable remote instrumentation and configure logs, traces, and metrics the way your team needs them for full serverless observability.
Once that’s in place, you’ll have real-time dashboards, distributed traces, and correlated logs sitting in one view. To make it concrete, we’ll also walk through a real debugging scenario: a slow Lambda function, how Middleware catches it, and how quickly you get to root cause.
Lambda is genuinely great to build on. Functions scale automatically, cost nothing when idle, and deploy in seconds. Your team ships faster, infrastructure overhead drops, and everyone’s happy.
Until something breaks.
Suddenly you’re jumping between CloudWatch, X-Ray, and a couple of other tabs trying to figure out why a function that worked fine yesterday is now timing out in production. No context, no trace, just a timestamp and a guess.
The problem usually isn’t the code. It’s the lack of a single place to see what’s actually happening. Middleware’s AWS monitoring platform addresses this with remote instrumentation built on OpenTelemetry, giving you Lambda observability across traces, logs, and metrics in one platform, without touching a single line of function code. It takes under 15 minutes to set up, and you can start your 14-day free trial with unlimited ingestion, no credit card required, to see it running on your own functions while you read.
Let’s start with connecting your AWS account.
How do I connect my AWS account to Middleware?
Before Middleware can see anything inside your Lambda functions, it needs access to your AWS account.
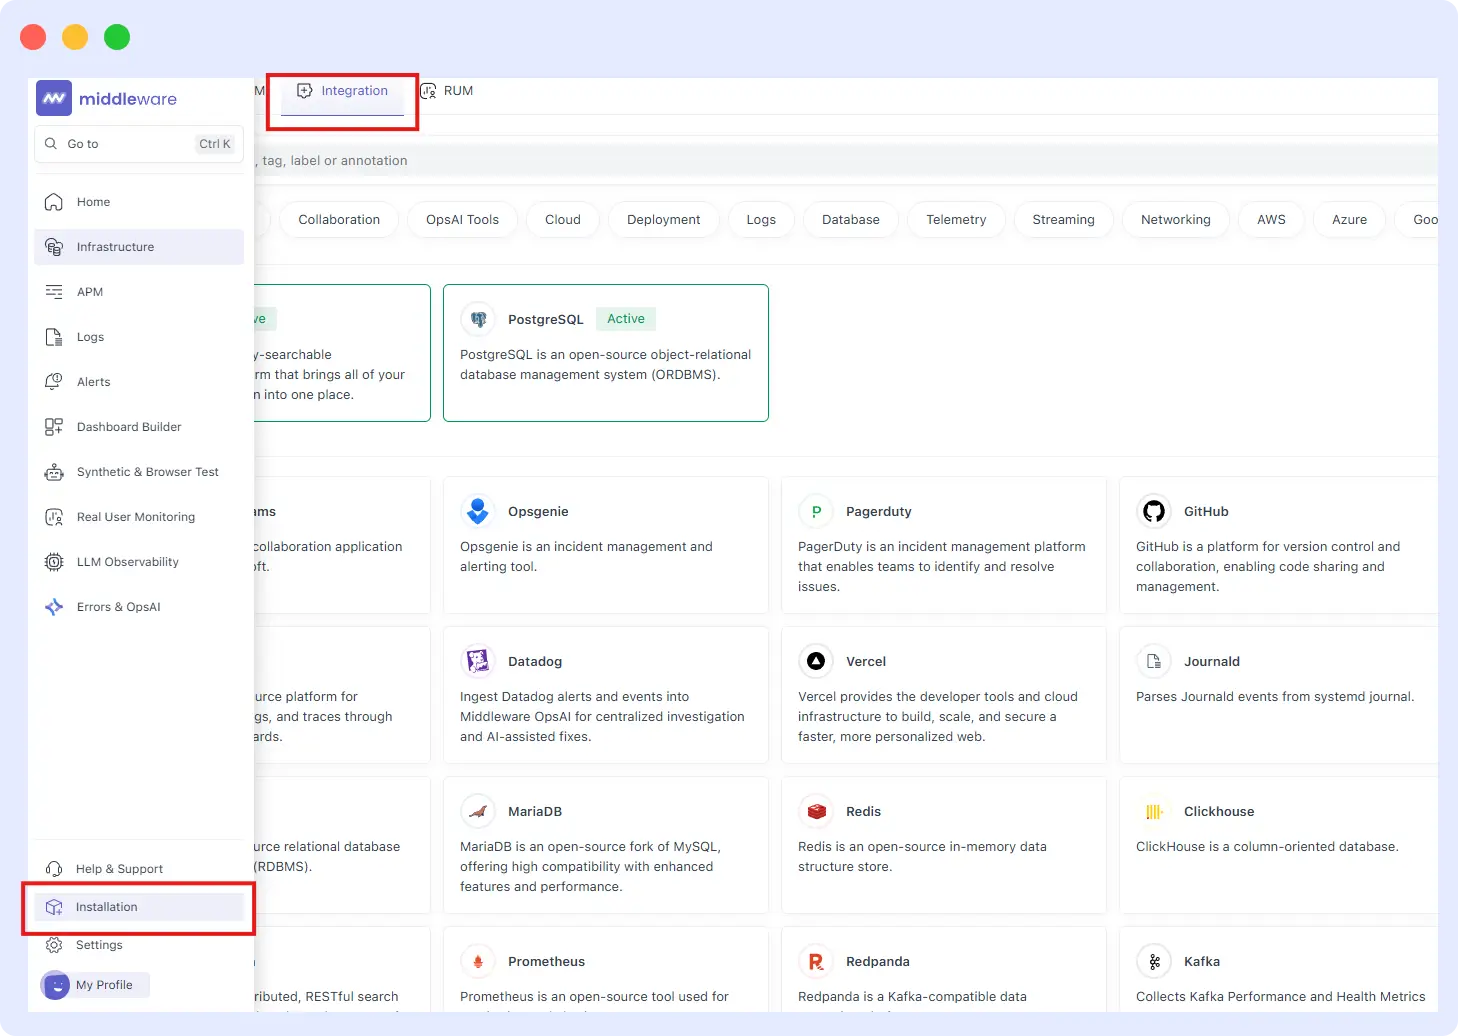
In your Middleware account, go to Installation → Integrations → AWS. You’ll see two setup options, pick whichever fits your team’s constraints.
Option A: Kinesis stream (recommended)
This method uses CloudWatch Metric Streams and Amazon Data Firehose to push metrics into Middleware, with roughly a two to three minute lag. Middleware provides a CloudFormation template that handles the setup automatically, so there’s no manual configuration required.
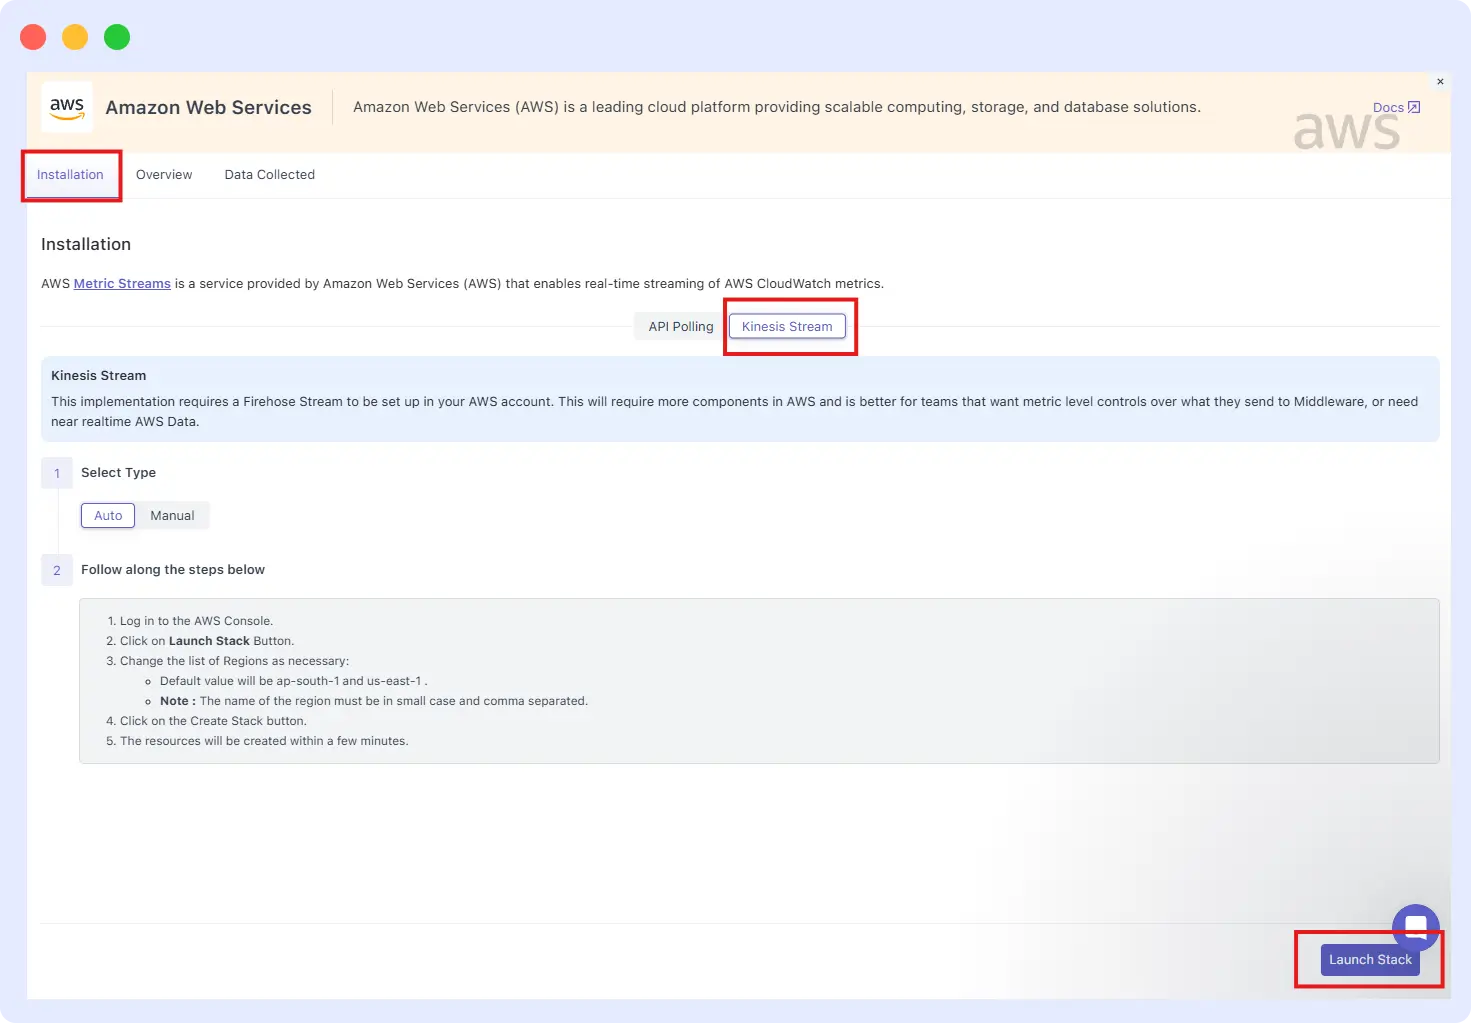
- On the AWS integration page, click Launch Stack.
- Middleware will ask for an IAM role. If you have one, paste it in. If not, create one with these policies: IAMFullAccess, CloudWatchFullAccess, AWSCloudFormationFullAccess, AmazonKinesisFirehoseFullAccess, and AmazonS3FullAccess.
- Once the role is linked, click Create Stack.
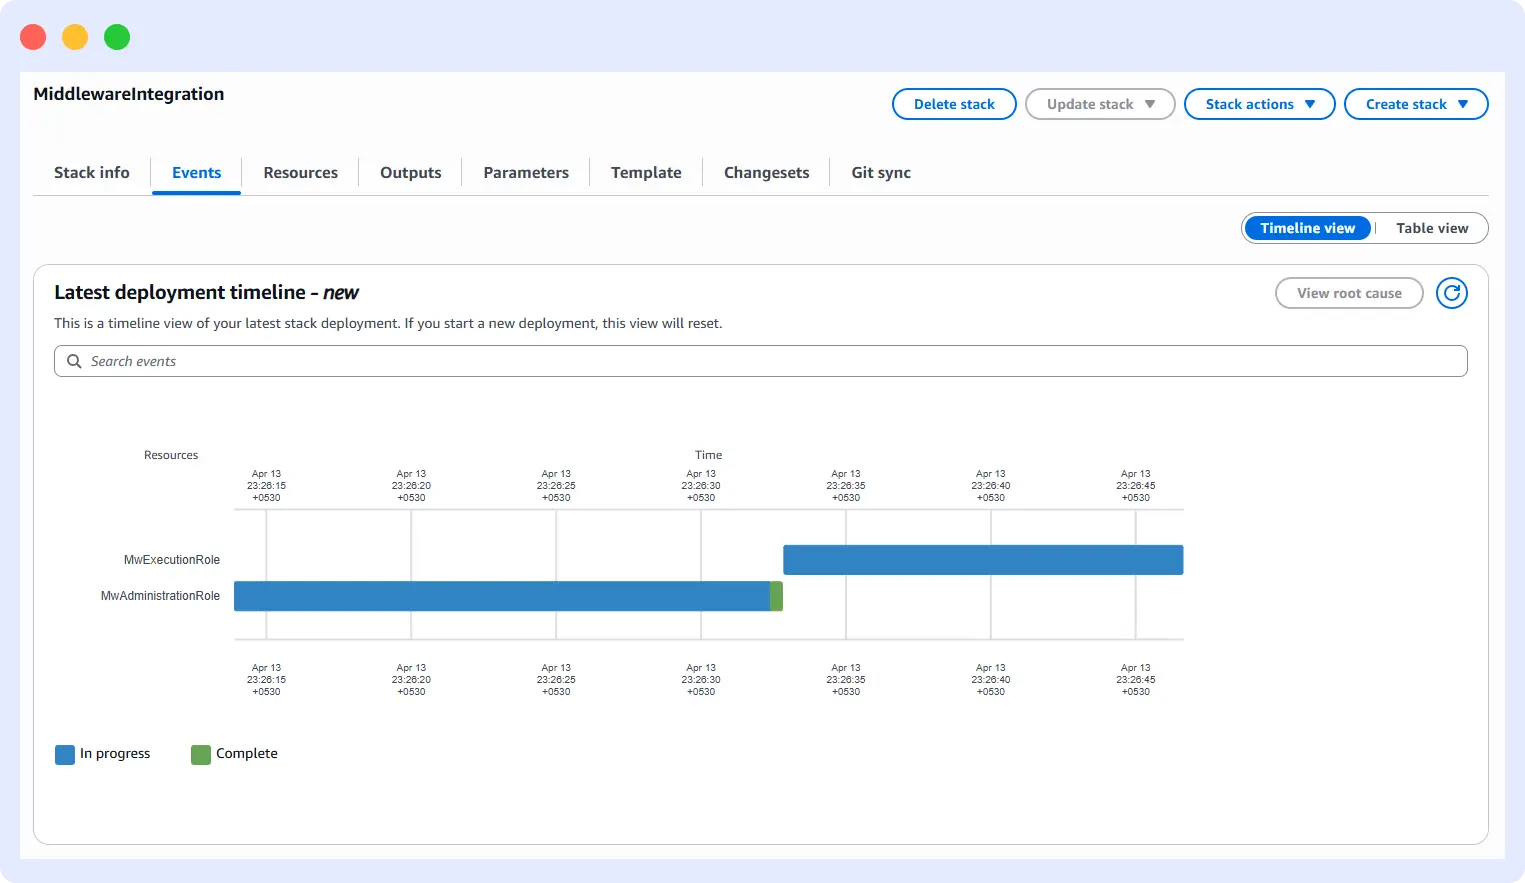
Note: CloudWatch Metric Streams only pull data from the same AWS region as your stack. If your Lambda functions run in us-east-2, create the stream in us-east-2 too.
Option B: API polling (simpler)
If your team has strict policies around provisioning new AWS resources, API polling is the easier path for monitoring Lambda functions. No new resources are created, Middleware polls your CloudWatch APIs directly using an IAM role or access keys. The tradeoff is a slightly longer lag, around five minutes on metrics.
- On the AWS integration page, choose API Polling.
- Pick role delegation, which keeps your API keys internal, or access keys.
- Follow the prompts to link your credentials and hit Save.
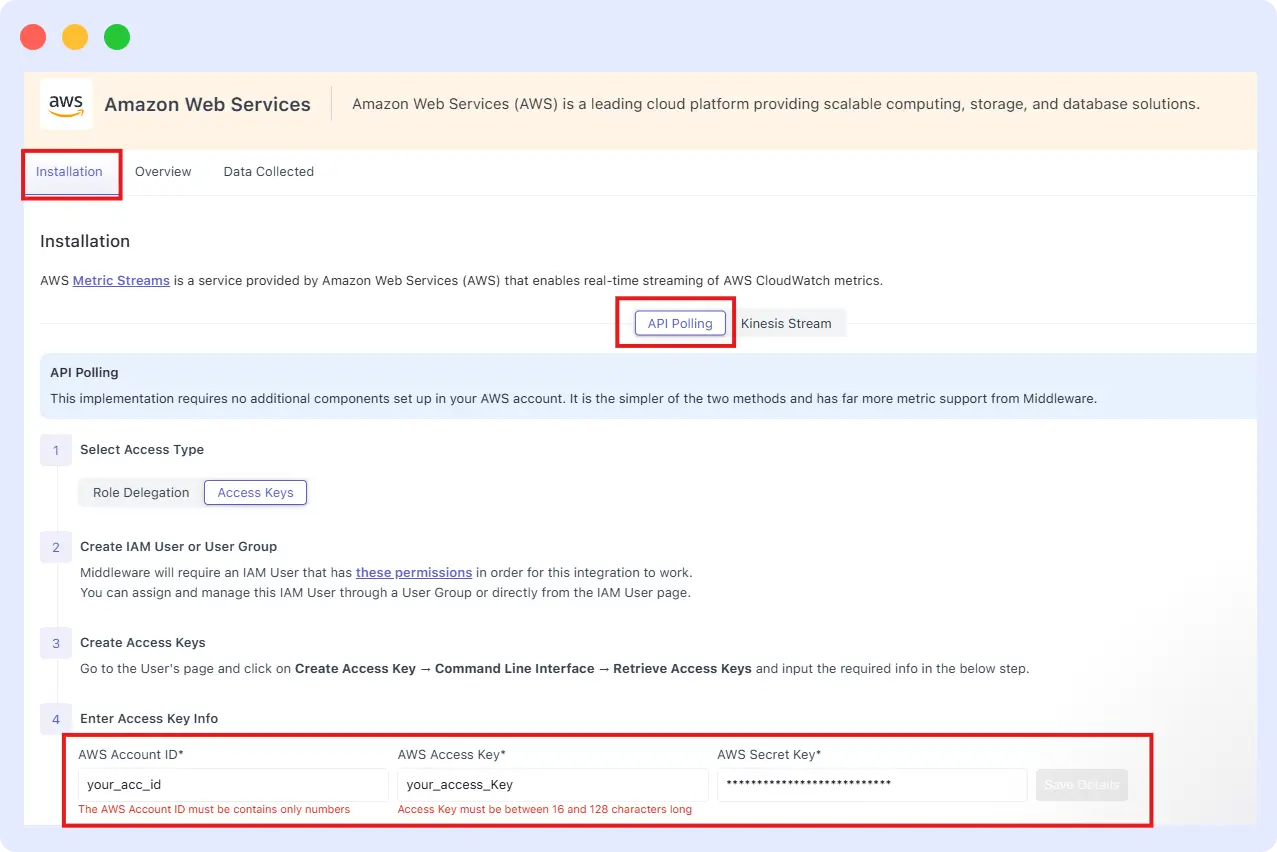
Heads up: API polling relies on CloudWatch APIs, which can incur additional AWS costs. Check AWS’s pricing page before enabling it at scale.
Once connected, Middleware automatically discovers resources across your AWS account, including EC2, RDS, ECS, S3, and every Lambda function across your namespaces. No manual selection is needed at this stage.
How do I choose which Lambda functions to monitor?
With your AWS account connected, Middleware pulls in every discovered Lambda function automatically. But you don’t want to monitor everything, especially across multiple environments, so this is where you narrow it down.
In your Middleware dashboard, go to Serverless Monitoring → AWS Lambda. You’ll see the full list of functions discovered from your connected account.
- Filter by tags or services. If your functions are tagged in AWS (for example env:production or team:payments), those tags carry over into Middleware automatically. Use them to filter down to what matters.
- Select functions individually or in bulk by tag group.
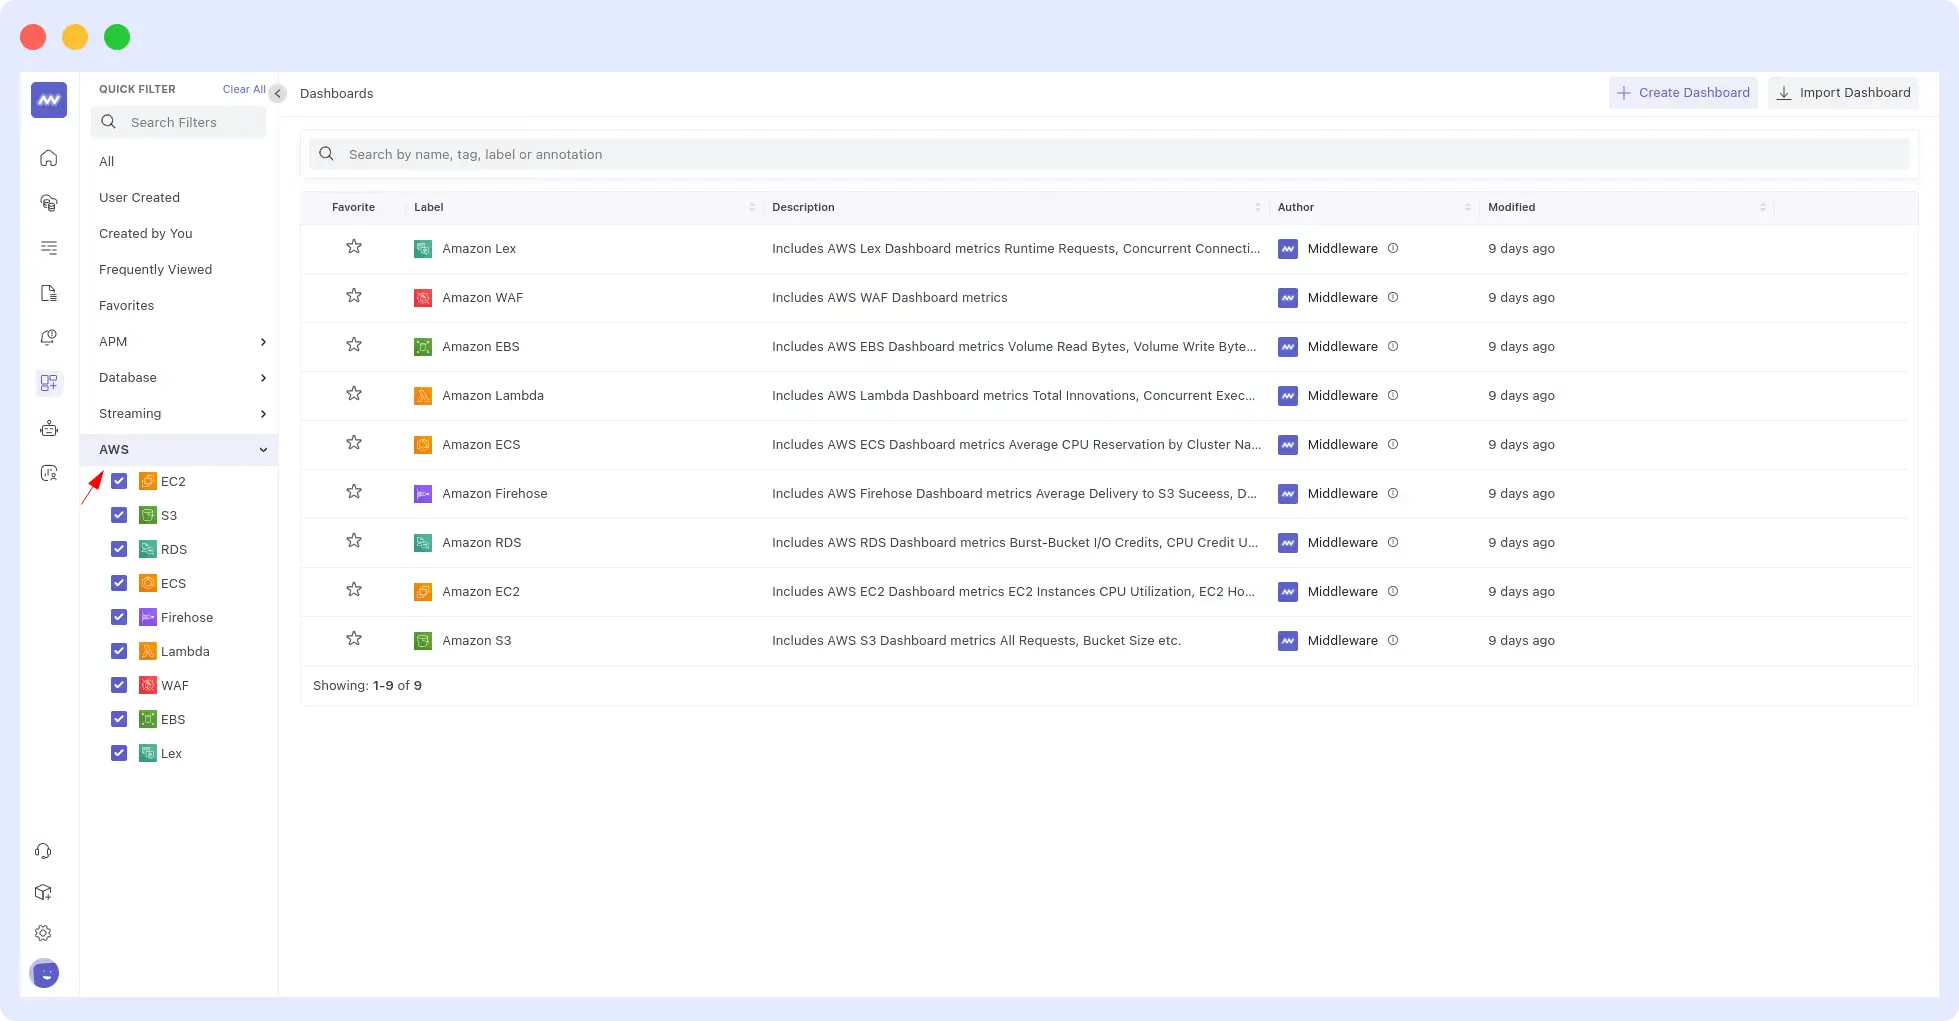
- Separate environments. Middleware supports multi-environment monitoring, so tagging your functions correctly in AWS keeps dev, staging, and prod cleanly separated in the dashboard.
Pro tip: start with your production functions, the ones that are customer-facing and highest impact. You can always expand coverage later.
Once you’ve made your selection, hit Save. Middleware now knows exactly which functions to watch. Next, let’s get instrumentation running.
How do I instrument Lambda functions for observability?
With your functions selected, it’s time to get Middleware actually looking inside them. Middleware uses OpenTelemetry based instrumentation delivered through Lambda layers, two layers, a few environment variables, and one config file. Your functions start sending traces, logs, and metrics on every invocation, with no changes to function logic and no redeploy cycle to wait on.
Here’s how to set it up.
1. Add the OTel Collector layer. In the OpenTelemetry Collector Lambda repository, find the ARN matching your region and architecture:
arn:aws:lambda:<region>:184161586896:layer:opentelemetry-collector-<amd64|arm64>-0_11_0:12. Add the auto-instrumentation layer. From the OpenTelemetry Lambda repository, copy the Node.js instrumentation layer ARN for your region:
arn:aws:lambda:<region>:184161586896:layer:opentelemetry-nodejs-0_9_0:4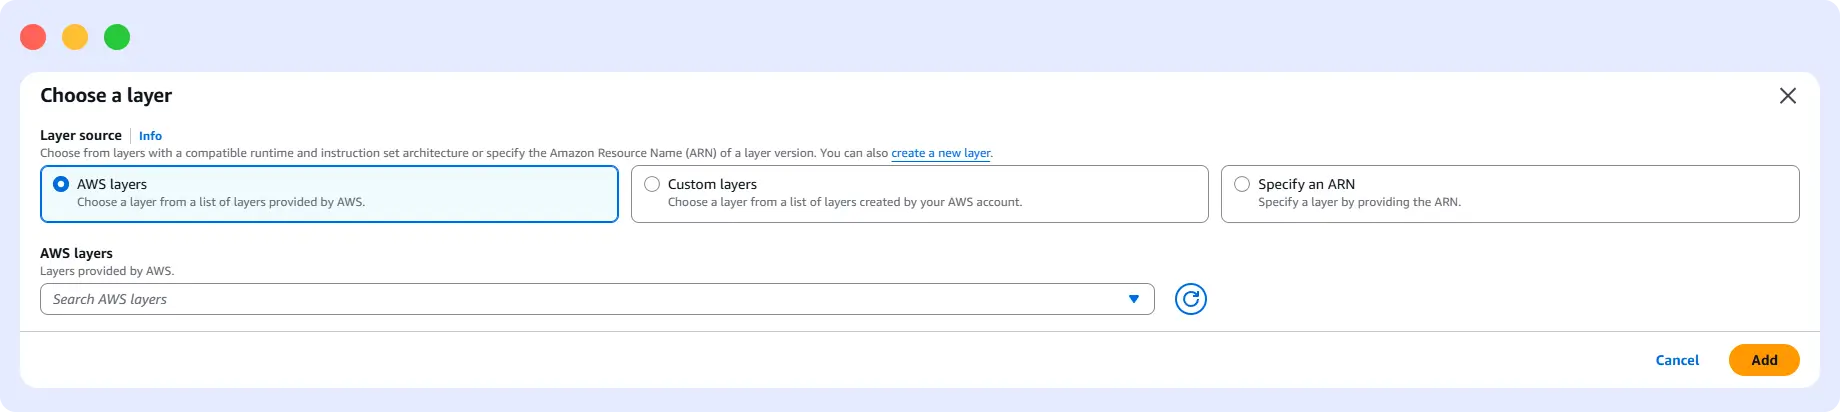
3. Attach both layers. In the AWS Console, go to Lambda → Functions → your function → Layers, and add both ARNs.
Important: add the Collector layer first, then the auto-instrumentation layer. Order matters here, swapping them is the most common reason instrumentation silently fails.
4. Add environment variables. Under Configuration → Environment Variables, add:
AWS_LAMBDA_EXEC_WRAPPER=/opt/otel-handler
NODE_OPTIONS=--require ./lambda-config.js
OTEL_SERVICE_NAME=your-service-name
OTEL_EXPORTER_OTLP_ENDPOINT=https://<MW_UID>.middleware.io:443
OTEL_RESOURCE_ATTRIBUTES=mw.account_key=<MW_API_KEY>
OTEL_LAMBDA_DISABLE_AWS_CONTEXT_PROPAGATION=true
OTEL_PROPAGATORS=tracecontext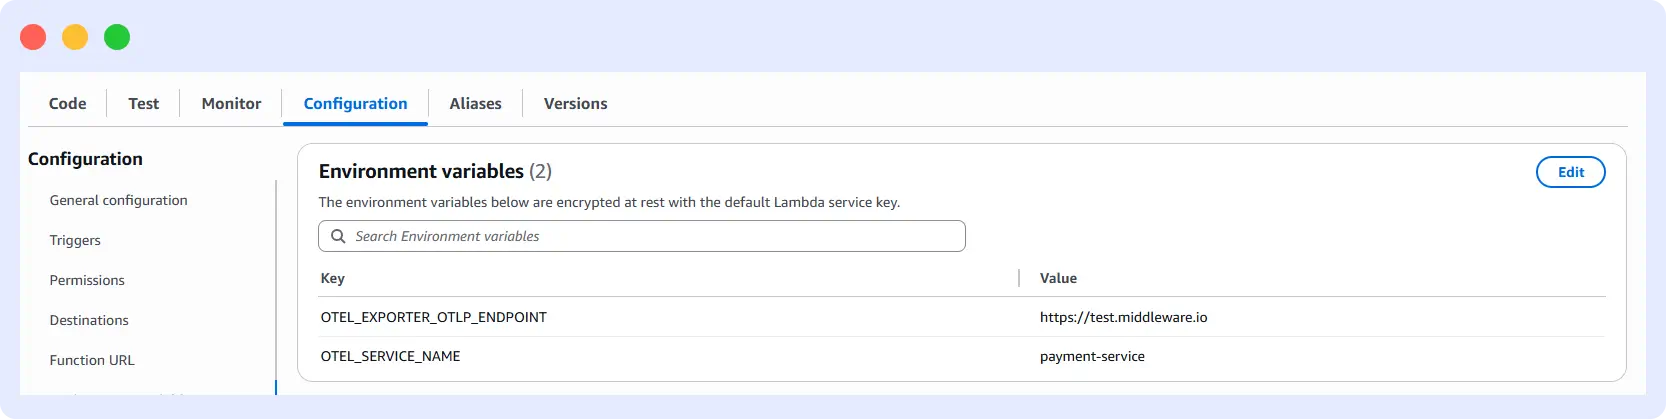
Replace <MW_UID> with your Middleware account subdomain and <MW_API_KEY> with your account key.
5. Add a config file. In your function’s root directory, create lambda-config.js:
const { SimpleSpanProcessor } = require("@opentelemetry/sdk-trace-base");
const { OTLPTraceExporter } = require("@opentelemetry/exporter-trace-otlp-proto");

global.configureTracerProvider = (tracerProvider) => {
  const spanProcessor = new SimpleSpanProcessor(new OTLPTraceExporter());
  tracerProvider.addSpanProcessor(spanProcessor);
};
Once this is in place, every Lambda invocation sends traces, logs, and metrics straight to Middleware. Now let’s configure what you actually want to see.
What should I configure for Lambda performance monitoring?
Instrumentation is live, so now it’s about making sure Middleware is collecting the right signals, traces, logs, metrics, and alerts, from your Lambda functions.
- In your Middleware dashboard, go to Serverless Monitoring → AWS Lambda and open the function you want to configure.
- Enable tracing. In the AWS Console, go to Lambda → Functions → your function → Configuration → Monitoring and operations tools → Edit, and toggle Active Tracing on. This adds X-Ray correlation on top of your OTel traces, giving you better service maps and context propagation across downstream services like DynamoDB, SQS, and API Gateway.
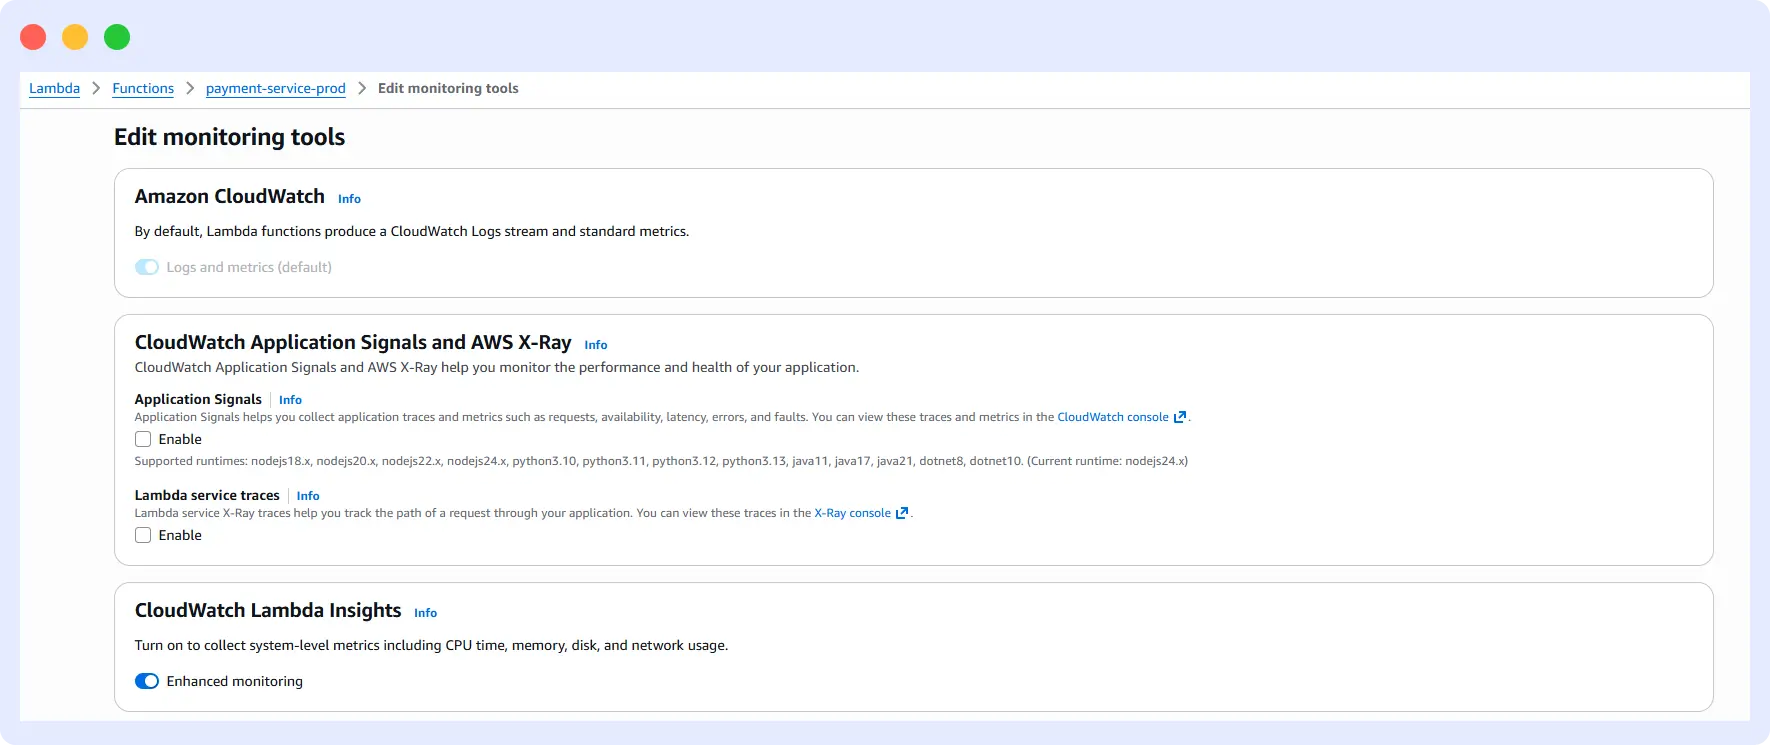
3. Configure logs. In the same Configuration → Monitoring and operations tools panel, set Log Format to JSON. Structured logs let Middleware link every log line directly to the trace that produced it, so you’re not manually piecing timestamps together across tabs. Middleware’s guide to observability covers how logs, metrics, and traces work together as the core telemetry signals, if you want the fuller picture before you configure this.
4. Verify metrics are flowing. Back in your Middleware dashboard, confirm these are visible for your function: invocation count, error rate, duration (p50, p95, p99), cold start frequency, and throttle count.
5. Set up alerts. In your Middleware dashboard, go to Alerts and create rules for your Lambda functions. A few solid starting points: error rate above 5%, p95 duration above 3 seconds, cold start spikes, and throttle count above 0.
When an alert fires, Middleware’s click-to-correlate takes you straight to the trace and logs behind it, no manual hunting required.
How do I visualize and monitor Lambda functions in real time?
With instrumentation running, telemetry starts flowing into your dashboard within minutes of the first invocation. Here’s what you’ll find.
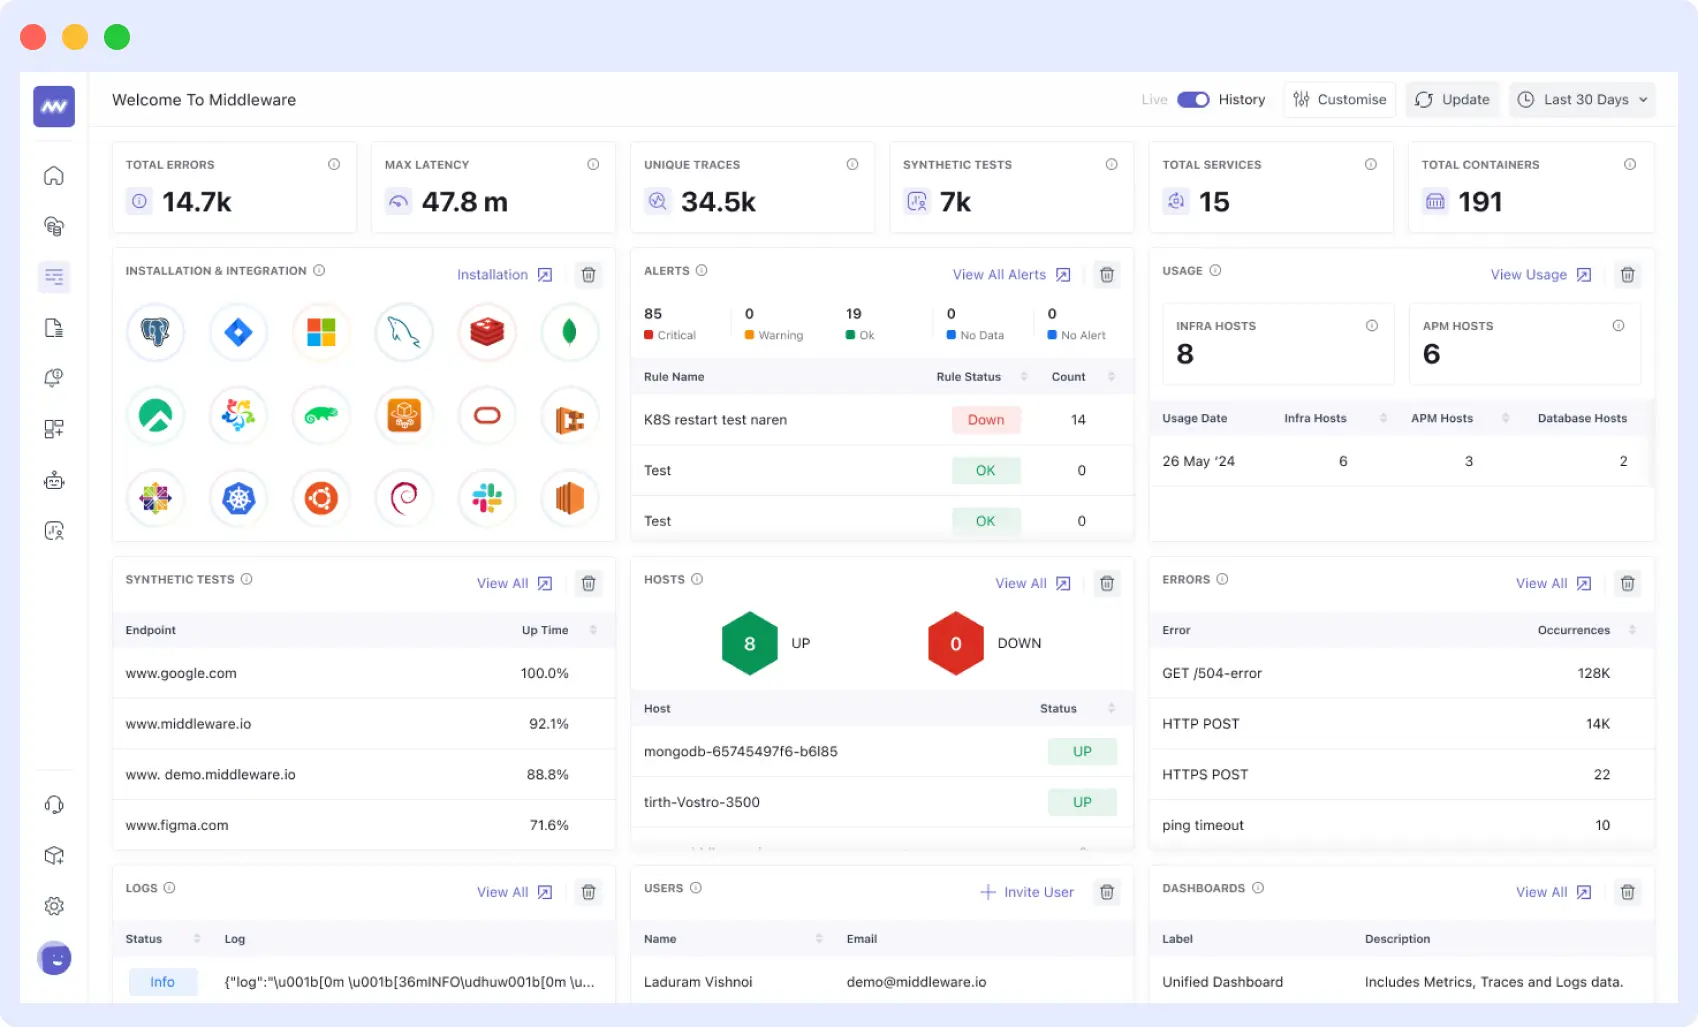
Dashboards. Under Serverless Monitoring → AWS Lambda, Middleware provides a pre-built dashboard covering invocation count, error rate, duration percentiles, cold starts, and throttles, all live.
Distributed traces. Under APM → Distributed Tracing, every Lambda invocation shows up as a full trace, so you can see exactly how long each span took and which downstream service, DynamoDB, SQS, API Gateway, was involved. Middleware’s complete guide to distributed tracing is worth a read if you want to understand how traces and spans work across your entire stack, not just Lambda.
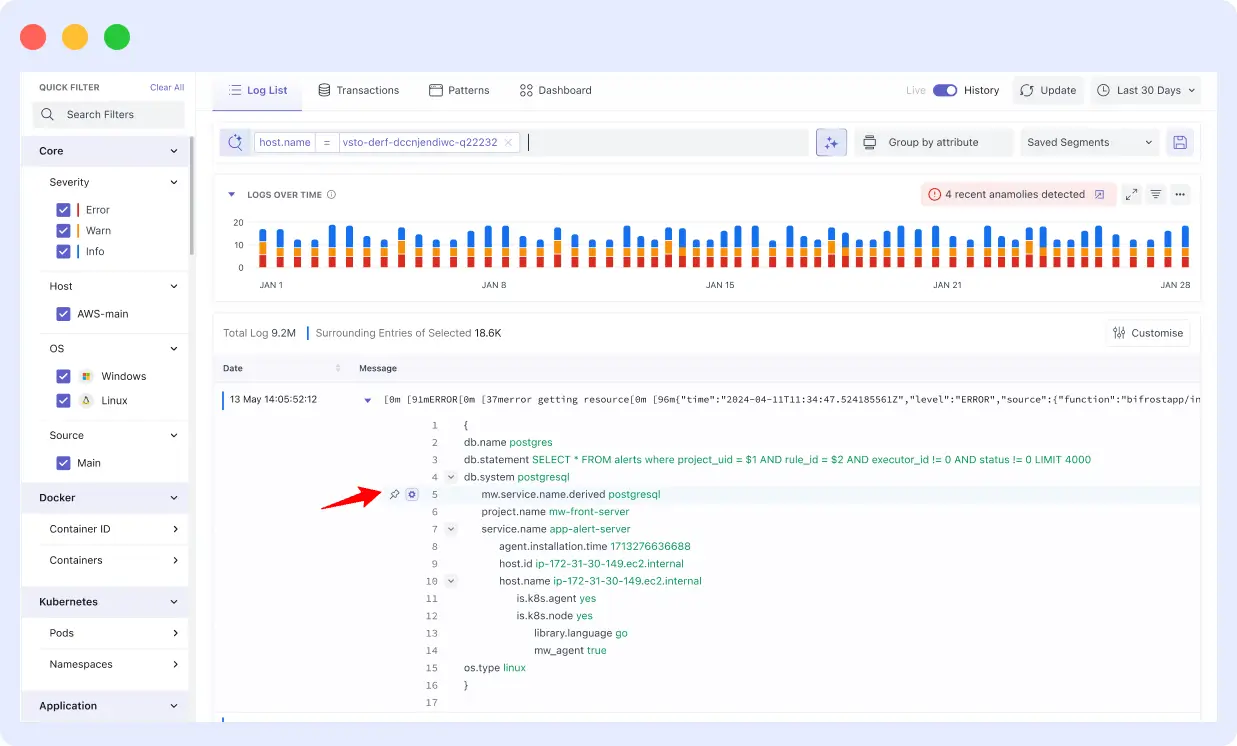
Log correlation. In the Log Explorer, logs are automatically linked to the trace they were emitted in. Click a trace, and the associated logs sit right there on the same screen.
Service map. Under APM → Service Map, you get a live visual of how your Lambda functions connect to the rest of your stack, upstream triggers, downstream dependencies, and where latency is building up.
What changes once observability is in place
Most teams notice the difference within the first few invocations. Latency spikes surface the moment they happen instead of after someone files a ticket. Error rates show up automatically without anyone writing an alert query. Cold start patterns become visible across every function at once, which is genuinely hard to spot by scrolling through raw CloudWatch logs.
Before this setup, debugging a slow Lambda invocation usually meant pulling CloudWatch logs, switching tabs to X-Ray for traces, checking a separate metrics dashboard, and manually connecting the dots. That could easily eat 30 to 40 minutes just to locate the problem.
With everything correlated, you click the alert, land on the trace, see the slow span, and check the linked log, all on one screen, in a fraction of the time.
If this kind of correlated Lambda observability sounds like what your team is missing, it takes about 15 minutes to connect your own AWS account and see it working on real traffic. Start your free trial and instrument your first function today, no credit card needed.
Example: debugging a slow Lambda function
Here’s how this plays out in practice.
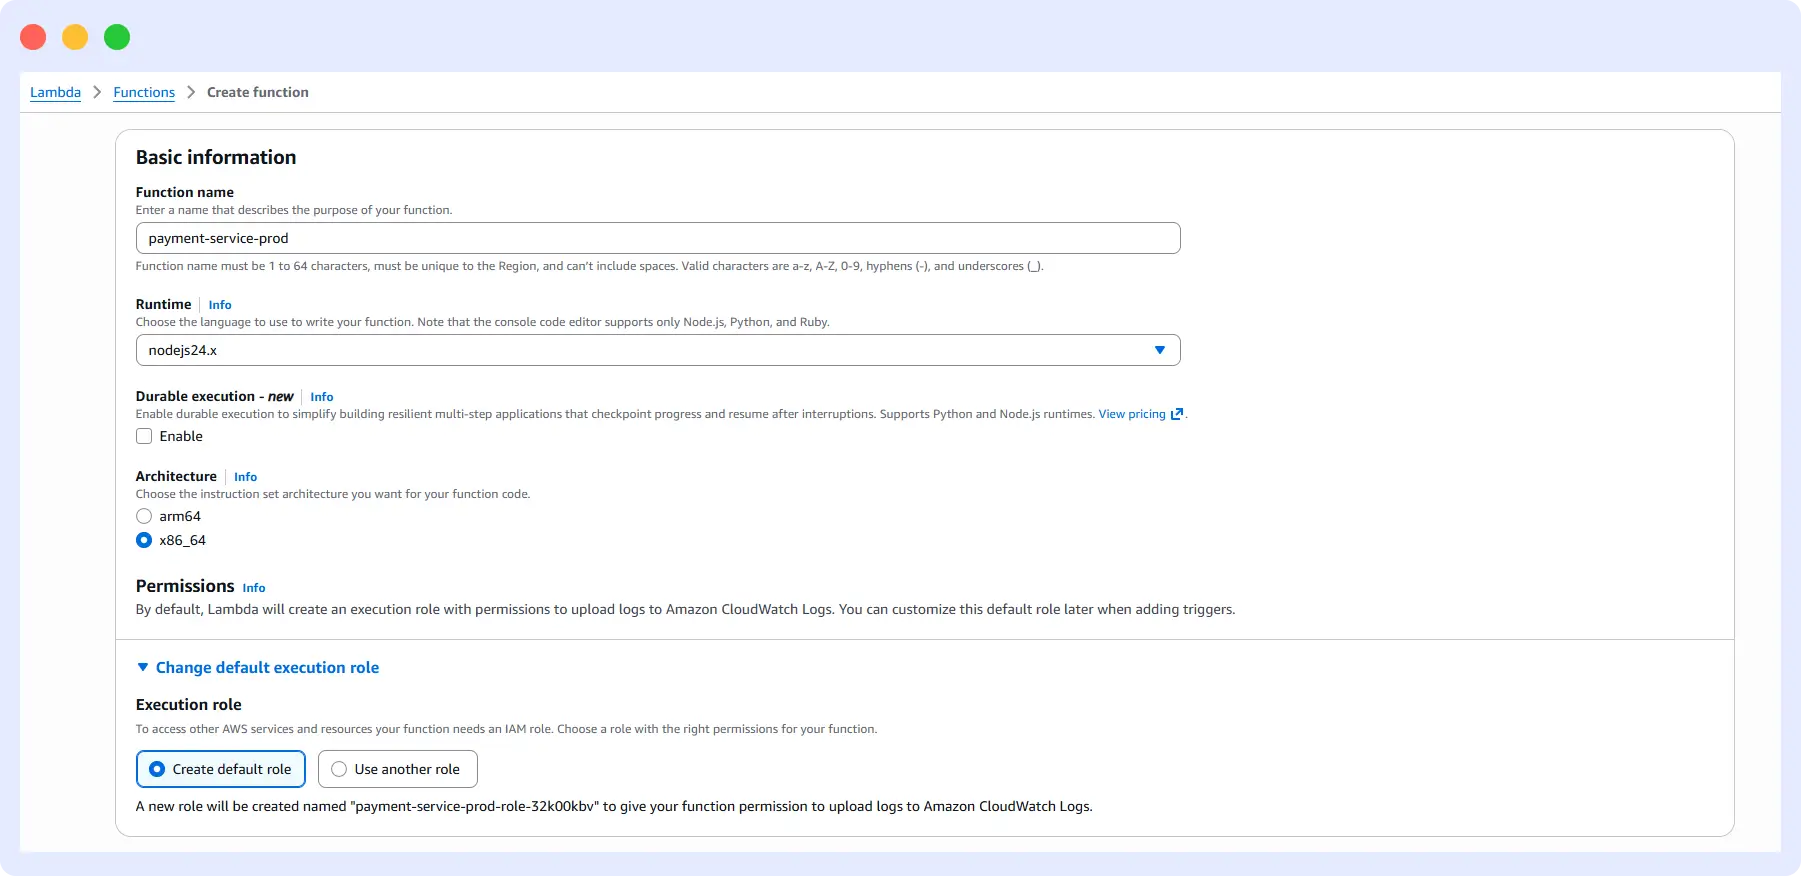
The problem. A payment processing Lambda function starts timing out in production. p95 latency jumps from 400ms to over 3 seconds. Users hit checkout errors and the on-call engineer gets paged.
Without correlated telemetry, this usually means opening CloudWatch, searching logs by timestamp, switching to X-Ray to find a trace, manually cross-referencing metrics, and asking a teammate which DynamoDB table the function touches. Forty minutes later, you might have an answer.
Detection. The p95 duration alert fires in Middleware and links directly to the affected traces. The engineer opens the trace waterfall: the Lambda handler itself completes in under 100ms, but a DynamoDB:GetItem span is taking 2.8 seconds.
Root cause. A hot partition key issue, triggered by a deployment earlier that day, visible in the trace metadata and correlated with the deployment marker in the dashboard.
Outcome. Root cause identified in under 8 minutes. The deployment gets rolled back, latency recovers, and the fix is confirmed by live traces in Middleware. MTTR drops from roughly 40 minutes to under 10.
Why choose Middleware for AWS Lambda observability and monitoring?
There are several tools that monitor Lambda. Here’s what tends to matter most to teams comparing them, and this roundup of the top observability tools is a useful reference if you’re evaluating more than one platform.
OpenTelemetry native. Middleware is built on OpenTelemetry from the ground up. There’s no proprietary agent and no vendor lock-in, so if you ever switch backends, your instrumentation setup comes with you.
Unified observability. Logs, metrics, traces, and service maps all live in one platform. Instead of stitching together CloudWatch for logs, X-Ray for traces, and a separate tool for dashboards, everything sits behind a single click-through view.
Fast setup. Two Lambda layers, a handful of environment variables, one config file. The whole process takes well under 15 minutes and doesn’t require touching function code or waiting on a deployment cycle.
Predictable pricing. Middleware runs on a 14-day free trial with unlimited ingestion, then $0.30/GB pay-as-you-go after that, so there are no per-host fees or surprise bills when your invocation count spikes.
Lambda observability is one piece of a bigger picture. If you’re monitoring other AWS services alongside Lambda, Middleware’s AWS monitoring guide covers best practices and tooling across EC2, RDS, ECS, and the rest of your AWS account.
Get started with AWS Lambda observability
Setup takes well under 15 minutes: connect your AWS account, select your Lambda functions, add the OTel layers, and you’re live with real-time telemetry. Read the full AWS Lambda setup documentation for reference while you configure your account.
Start your 14-day free trial today, no credit card required, and see your Lambda functions’ traces, logs, and metrics correlated in one dashboard. If you’d rather have someone walk through it with you first, book a demo and we’ll show you how it fits your existing AWS setup.
FAQs
What is AWS Lambda observability?
AWS Lambda observability is the practice of correlating traces, logs, and metrics from your Lambda functions in one place, instead of checking CloudWatch and X-Ray separately. It lets you trace a slow or failing invocation back to its root cause, whether that’s the function code, a downstream service, or a cold start, without manually cross-referencing tools.
How is Lambda observability different from Lambda monitoring?
Monitoring tells you something is wrong, for example, an error rate spike or a latency increase. Observability lets you understand why by correlating that signal with the underlying trace and log data. Middleware combines both: dashboards and alerts for monitoring, correlated traces and logs for root cause analysis.
Do I need to change my Lambda function code to add observability?
No. Middleware uses OpenTelemetry based remote instrumentation delivered through Lambda layers and environment variables. You add two layers, a handful of environment variables, and one config file, no changes to your function’s business logic and no redeploy cycle tied to code changes.
How long does it take to set up AWS Lambda observability with Middleware?
Most teams have Lambda functions instrumented and sending telemetry within 15 minutes: connecting AWS, selecting functions, adding the two OpenTelemetry layers, and confirming metrics are flowing.
Does Middleware support both Kinesis Stream and API Polling for AWS integration?
Yes. Kinesis Stream, using CloudWatch Metric Streams and Data Firehose, has roughly a 2 to 3 minute lag and requires no manual configuration. API Polling has a longer lag, around 5 minutes, but avoids creating new AWS resources, useful for teams with strict provisioning policies.
What signals does Middleware track for Lambda functions?
Invocation count, error rate, duration at p50, p95, and p99, cold start frequency, and throttle count, along with distributed traces and structured logs correlated to each invocation.
Is Middleware’s Lambda observability OpenTelemetry native?
Yes. Middleware is built on OpenTelemetry from the ground up, so there’s no proprietary agent locking you into the platform. If you switch backends later, your instrumentation setup comes with you.
What does Middleware cost for AWS Lambda observability?
Middleware offers a 14-day free trial with unlimited ingestion, no credit card required. After the trial, pricing is $0.30/GB pay-as-you-go, with no per-host fees.
Related AWS resources
- AWS monitoring: a practical guide with best tools
- 10 AWS monitoring best practices
- AWS ECS vs EKS: complete comparison and decision guide
- How Middleware compares to AWS CloudWatch for monitoring
- AWS CloudWatch metrics explained
- How to analyze AWS CloudWatch resources with Middleware
- AWS Profiler: find and fix inefficiencies in your infrastructure
- 10 proven practices to reduce AWS cost by 40%
- AWS terminology 101: a complete glossary
- How to create and deploy a virtual machine on AWS

