Although Cassandra, an open-source NoSQL database, is renowned for its use in high-scale environments, Cassandra monitoring is a constant headache for many Devs. You wouldn’t blame Cassandra; impeccably handling such huge volumes of data must come at a cost.
In many teams, 20–30% of high‑severity incidents are linked to missing or misconfigured Cassandra alerts, which turn small, observable issues into full-blown outages.

A key cause of this headache: there are too many disparate components of the Cassandra architecture, so the metrics are so abundant that you can easily lose sight of what matters.
Cassandra monitoring means tracking node health, request rates, client errors, read/write latency, CPU and memory usage, disk and compaction activity, and JVM metrics such as heap and garbage collection.
This guide explains which Cassandra metrics matter, how to interpret them, which thresholds to alert on, and which monitoring tools help teams detect issues before they turn into outages.
How Cassandra Works (and Why Monitoring Is Hard)
Cassandra follows a peer-to-peer architecture where every node is equal. There is no master node.
While this design improves availability, it makes troubleshooting more difficult because failures rarely occur in a single place. A single slow disk, long garbage collection pause, or compaction backlog can cascade into:
- Increased read latency
- Timeouts at the coordinator node
- Client-side errors
- Eventually partial outages
That’s why Cassandra monitoring must correlate node metrics, JVM behavior, and OS-level signals, not just request latency.
Client → Coordinator → Replica nodes → SSTables → Compaction
Top Cassandra Monitoring Metrics
By observing the following key metrics, you will gain insight into activities within your Cassandra cluster and make informed decisions to optimize system reliability.
1. Dedicated Cassandra Performance Metrics:
These metrics describe how the Cassandra system and its components work.
a. Nodes
Nodes are individual servers that work together to store and manage data in a Cassandra cluster. Monitoring each node’s status helps you achieve a balanced workload distribution. It helps you know when a node is down, slowing down, or functional and when to repair or restart the node to avoid pressure on other nodes.
b. Request Count
This metric tracks the number of requests made to the Cassandra cluster on a requests-per-second basis.
c. Client error request count
This metric counts client requests that result in errors and helps assess client-side issues, such as data unavailability, data inconsistencies, or network errors.
d. Read and write performance metrics
This includes metrics like average range slice latency, average read latency, and average write latency. By showing how long it took certain requests to be executed, these latencies help you identify potential issues that may arise from increased load or the number of compactions.
2. Operating System Metrics:
These metrics provide information regarding the container or virtual machines:
a. CPU utilization
Monitoring CPU utilization helps gauge the level of computational resources used by Cassandra processes across the cluster or on individual nodes. Spare CPU cycles indicate the node’s capacity for handling data and queries.
The division of CPU usage between user and wait pinpoints specific needs or bottlenecks in I/O or the network. It helps you consider the impact of garbage collection on CPU cycles when planning resource allocation.
b. Memory usage
Keeping track of memory usage helps you ensure the system has enough memory to efficiently handle data processing. Since the latest Cassandra version utilizes both off-heap and heap memory, it is crucial to configure the heap size of your Cassandra nodes accurately and ensure sufficient off-heap memory for optimal cluster performance.
c. Disk usage
Monitoring disk usage provides visibility into storage capacity and potential disk space constraints that could impact Cassandra’s performance and data storage. It helps you determine whether a node is keeping up with compaction or falling behind. Compaction Metrics can give you deeper insights into this.
Compaction merges smaller data instances (SSTables) and removes outdated data. Monitoring compaction counts and compacted data volume is important to maintain sufficient disk space for ongoing performance. You can set alerts for low disk space to avoid compaction failures.
3. Java Virtual Machine (JVM) metrics:
These metrics provide details about the environment where Cassandra is executed and running:
a. Heap memory usage
Heap memory is where Cassandra stores data, and excessive memory allocation or inefficient memory management can degrade performance and even cause out-of-memory errors.
Keeping a close watch on heap memory usage helps you understand how Cassandra is utilizing memory resources and reveals potential memory-related issues that might affect the system’s stability.
⚠️ Experiencing unexplained heap growth or frequent JVM restarts? These symptoms often point to memory leaks, which can silently degrade Cassandra performance long before an outage occurs.
b. Garbage collection
Garbage collection helps reclaim memory that the application no longer uses. It helps you prevent excessive pauses that could affect the database’s responsiveness.
Monitoring garbage collection metrics, such as frequency, duration, and efficiency, helps you optimize garbage collection settings to minimize disruptions and ensure that the JVM efficiently manages memory resources.
c. Thread counts
Thread counts are the number of active threads within the Java Virtual Machine. High thread counts indicate heavy processing and potential contention, while low thread counts might suggest an underutilization of available resources.
These metrics help you understand the level of concurrent activity and resource utilization within your database. Using the metrics, you can gauge the system’s workload and fine-tune resource allocation.
Top 10 Cassandra Monitoring Tools
This section compares popular Cassandra monitoring tools based on features, deployment model, and pricing, so you can quickly pick the right fit for your cluster size and stack.
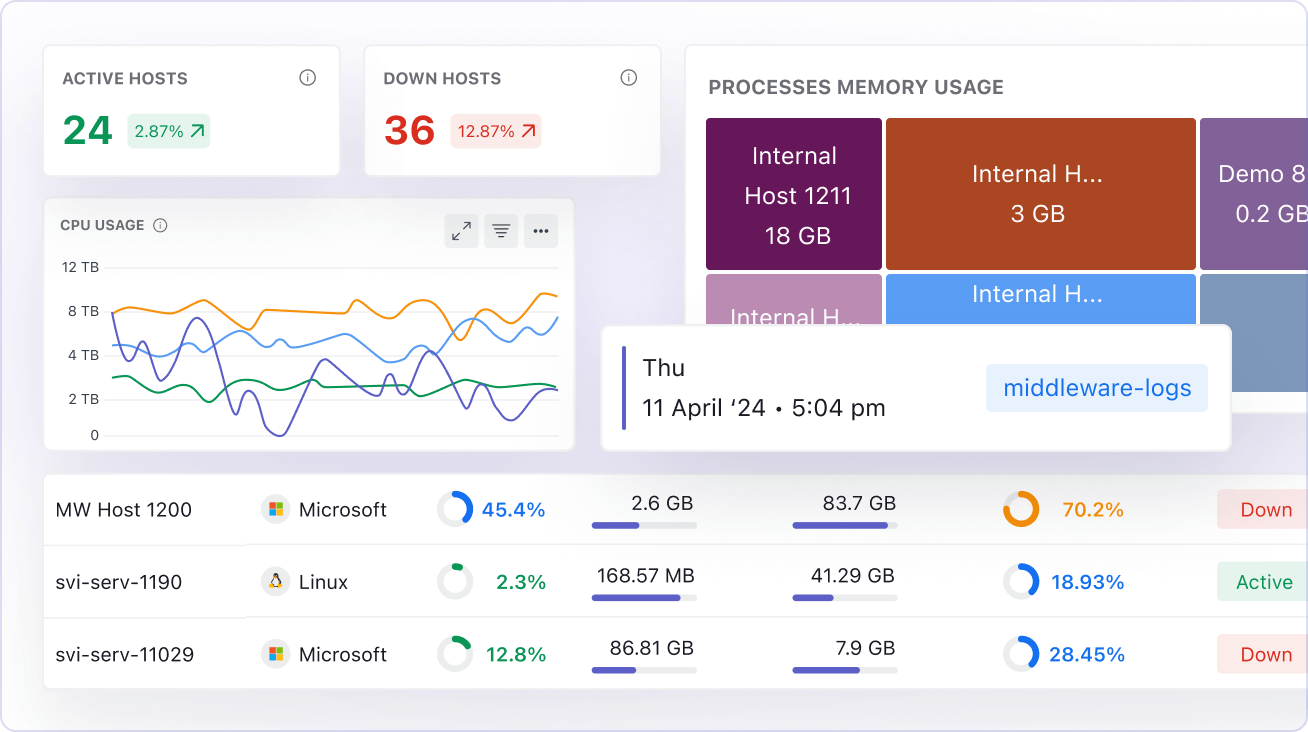
1. Middleware
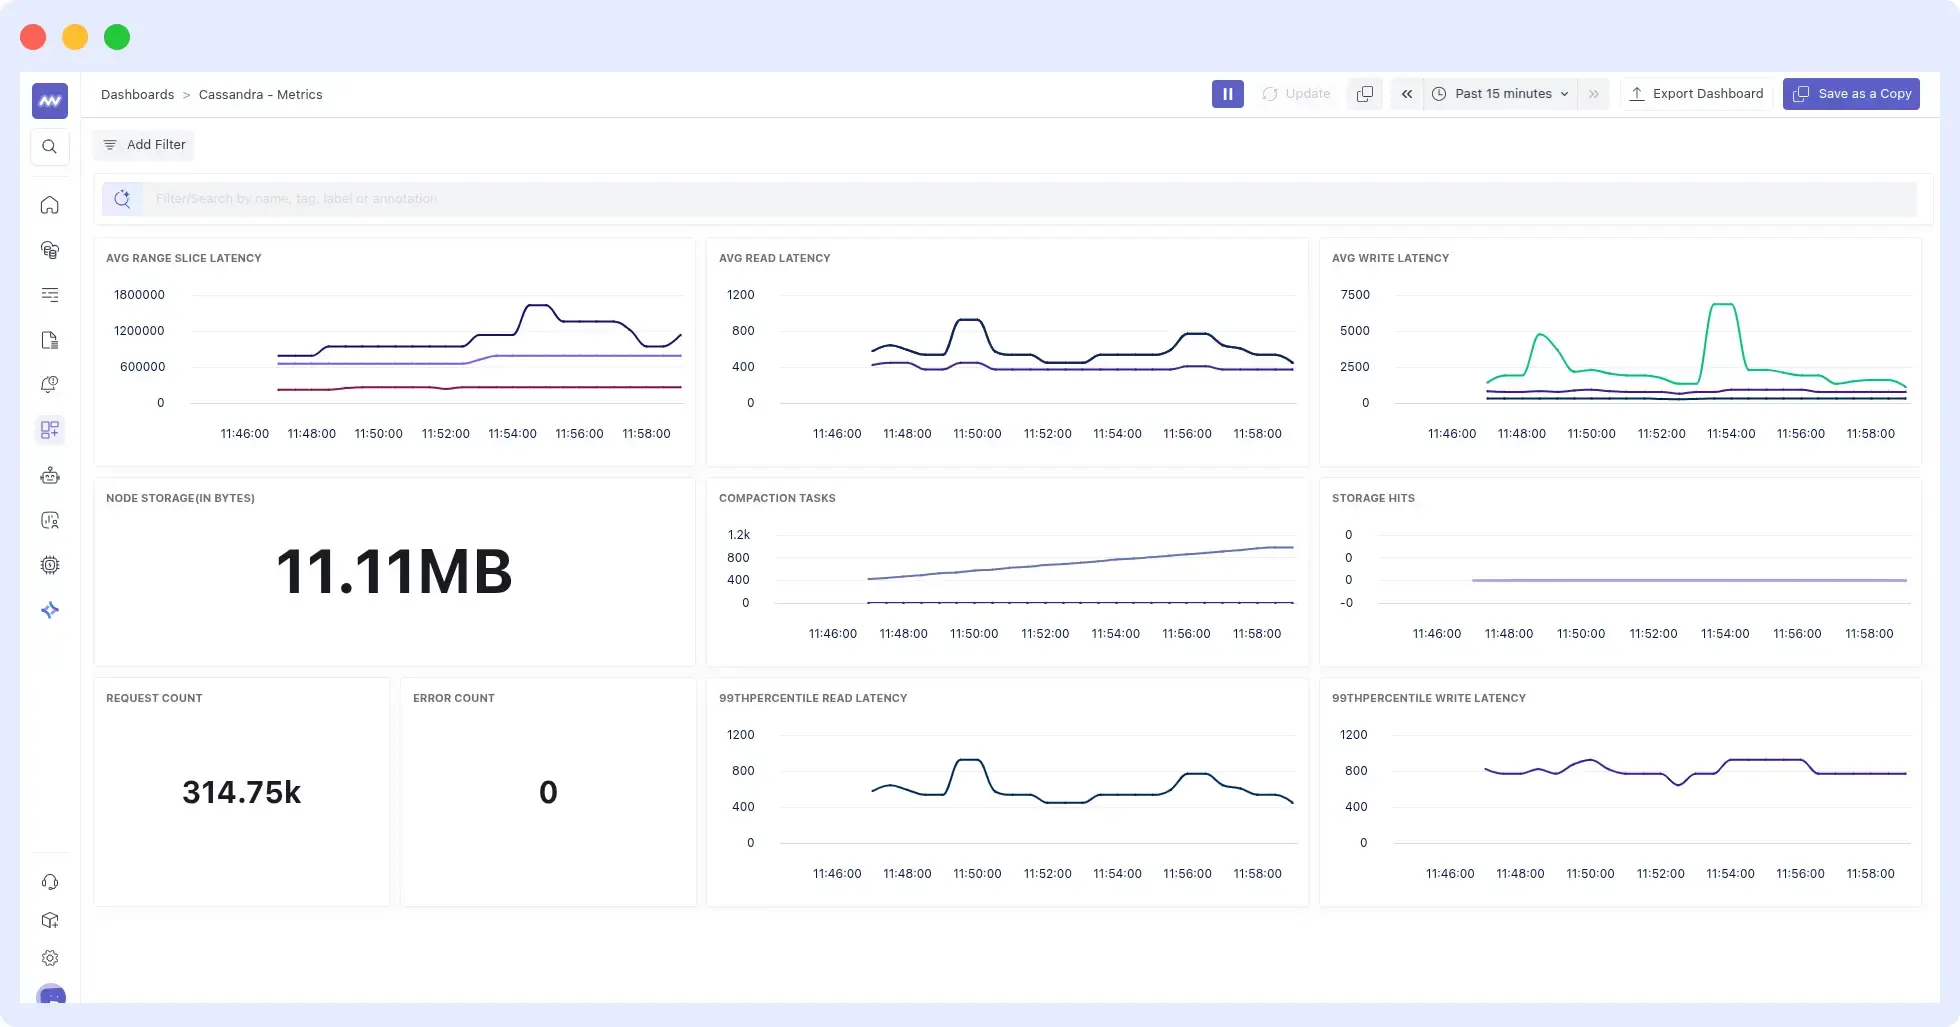
Middleware is a full-stack cloud observability platform with dashboards that offer end-to-end visibility. Its integration with Cassandra is seamless, providing a single dashboard where you can view all the key metrics described earlier.
Check the Middleware Cassandra documentation and find out how easy and fast it is to monitor the Cassandra cluster:
Features
- Automatic correlation of metrics.
- Offers metric segmentation, allowing you to view node and cluster metrics.
- Causation-to-correlation feature that identifies when the problem begins and where it ends.
- Prebuilt Cassandra metrics dashboards
- Reduced alert noise through behavior-based thresholds
- Offers enterprise-level security and complies with GDPR, CCPA, and SOC 2.
- Provides 24/7 technical support.
Pricing
Middleware offers 3 pricing tiers: Free Trial, Pay-as-you-go, and enterprise. Middleware offers a 14-day free trial with unlimited data ingestion. After the trial, users can opt for the pay-as-you-go plan at $0.30/GB for metrics, logs, and traces. Middleware also offers custom pricing for enterprises. Check Middleware pricing.
Best For: Teams needing fast setup and full-stack correlation
👉Start monitoring your Cassandra database with Middleware free for 14 days.
2. Sematext
Sematext also offers a comprehensive monitoring solution that simplifies Cassandra monitoring by consolidating metrics, logs, dashboards, and alerts into a single platform. It provides the tools you need to troubleshoot Cassandra node performance and health.
Sematext enables the identification of slow nodes and issues with reads and writes, and monitors SSTable compactions.
Features
- Powerful dashboarding capabilities for graphing diverse data.
- Auto-discovery of services for hands-off auto-monitoring of Cassandra clusters.
- Ability to observe Cassandra metrics in microservices and containerized environments, including Kubernetes and Docker.
- Alerting with anomaly detection and support for external notification services like PagerDuty, OpsGenie, and WebHooks.
Pricing
With Sematext, you only pay for what you’ve used based on the number of monitored hosts or containers. There’s a limited free plan available for both metrics and logs, and paid plans start at $2.8/month for metrics and $50/month for logs.
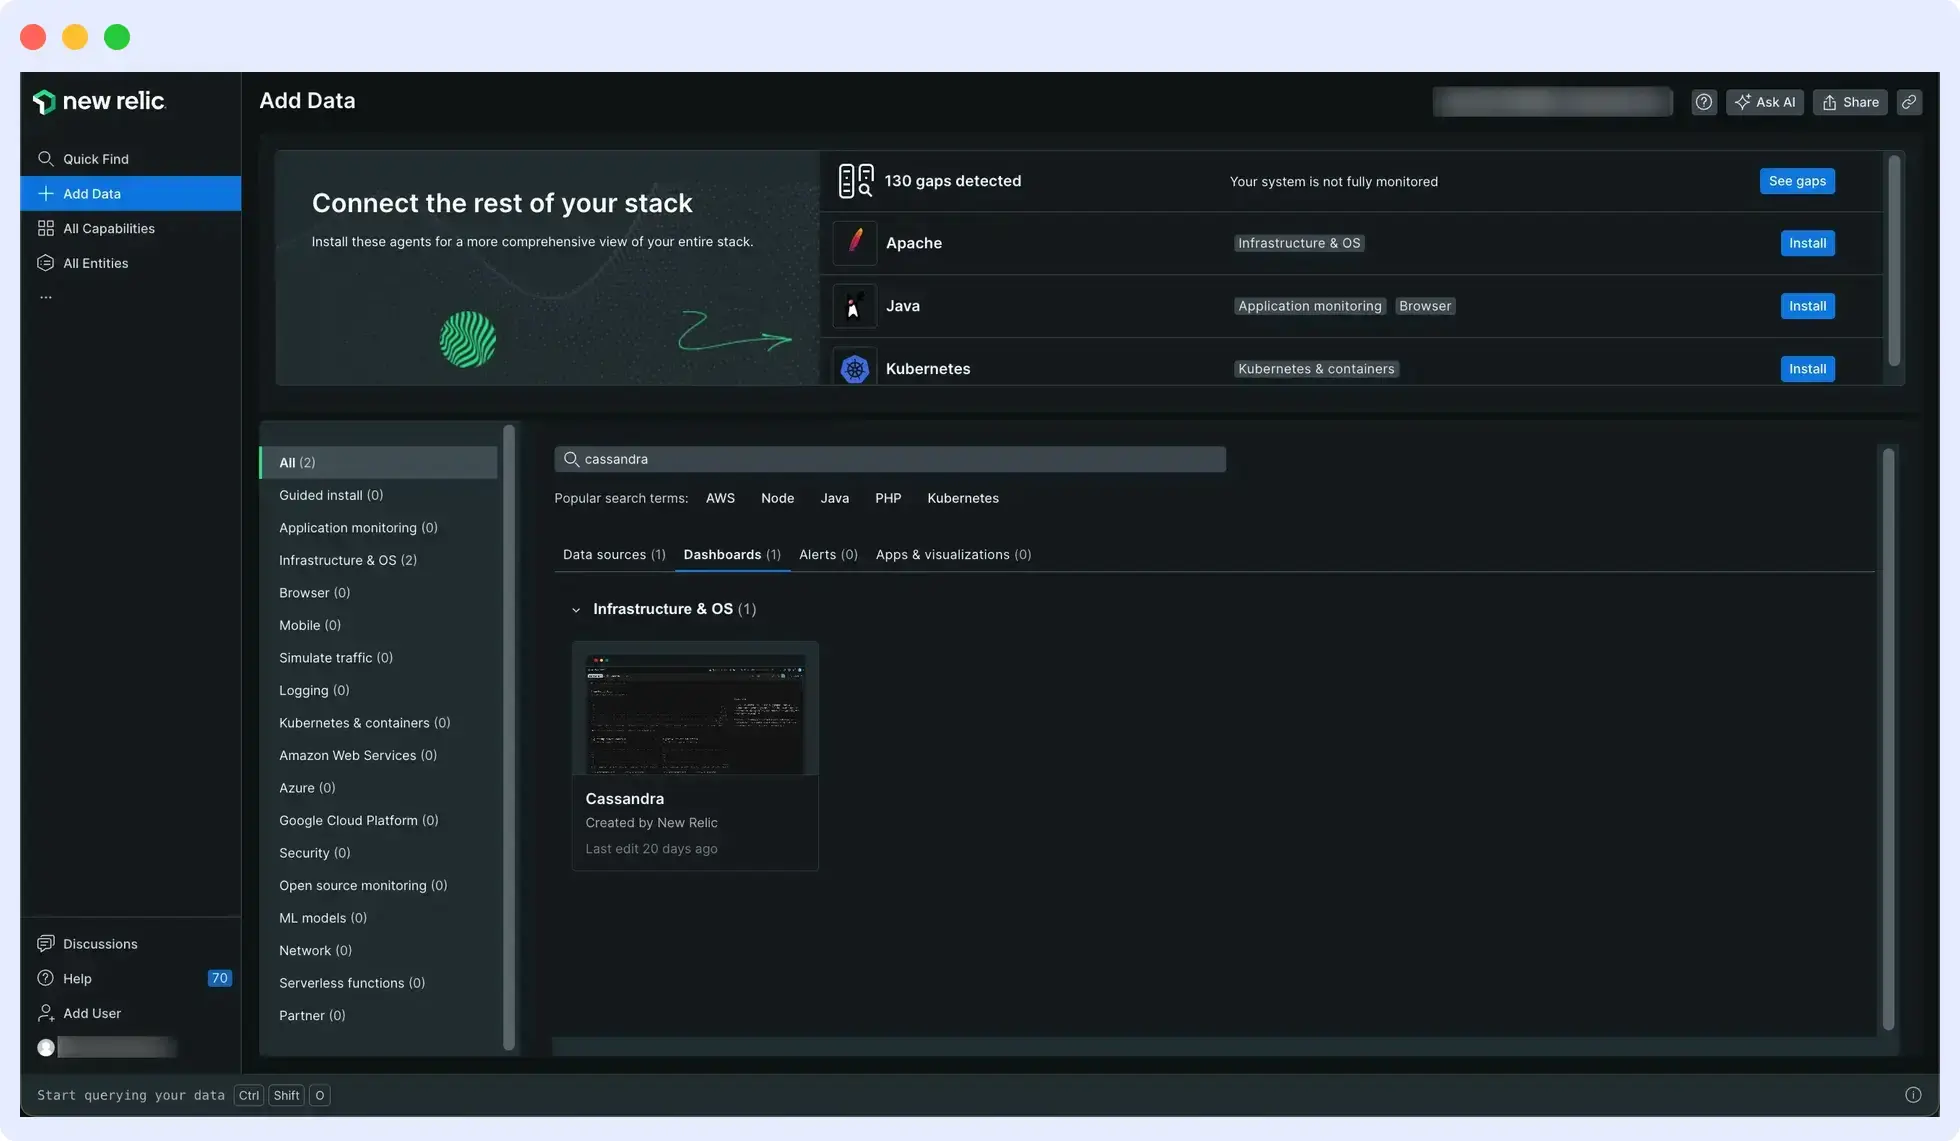
3. New Relic Cassandra Monitoring
New Relic provides comprehensive monitoring of database, JVM, and operating system metrics, offering full visibility into the Cassandra cluster and its execution environment.
With its alerting system and query language, New Relic equips you with all the necessary tools to manage and monitor Apache Cassandra-related aspects.
See our New Relic Alternatives guide if you’re evaluating other monitoring tools.
Features
- Log centralization and analysis for both Apache Cassandra metrics and logs.
- Application performance monitoring with dashboarding.
- Integrated alerting with anomaly detection.
- Seamless monitoring of Apache Cassandra on major cloud providers like AWS, Azure, and Google Cloud Platform.
Pricing
New Relic offers a pay-as-you-go pricing model. Their pay-as-you-go plan costs $0.35 per GB for logs, metrics and traces after 100GB of data ingestion. Plus, $49-99 per user per month, per plan, for complete observability.
💰 Understand New Relic pricing and how usage costs impact observability budgets.
4. Datadog
Datadog is a monitoring tool that works with various platforms and databases, including Cassandra. Through advanced tracing and latency breakdowns, Datadog streamlines Cassandra monitoring and provides detailed insight into slow-running queries and error rates.
🔹If you’re comparing observability platforms, see our detailed Datadog vs New Relic comparison.
It provides a comprehensive suite of metrics on query throughput, execution performance, and resource usage. Datadog enables navigation between logs and metrics and the setup of anomaly-based alerts to proactively prevent issues.
Features
- Monitoring of Cassandra application performance with support for distributed tracing.
- API for working with data, tags, and dashboards.
- Ability to analyze logs and ship Cassandra logs for correlation with metrics.
- Collaboration tools that allow for team-based and cross-sectoral discussions.
You can also explore other options in our Datadog alternatives guide.
See why businesses are migrating from Datadog to Middleware.
Read the migration guidePricing
Datadog uses a complex tiered model where infrastructure monitoring starts at $15 per host/month (Pro) or $23 per host/month (Enterprise) when billed annually. Additional products like APM are billed separately (starting at $31 per host/month), and log ingestion costs $0.10 per GB plus $1.70 per million events for indexing.
💰For a detailed breakdown of Datadog costs and usage-based pricing, refer to our Datadog pricing guide.
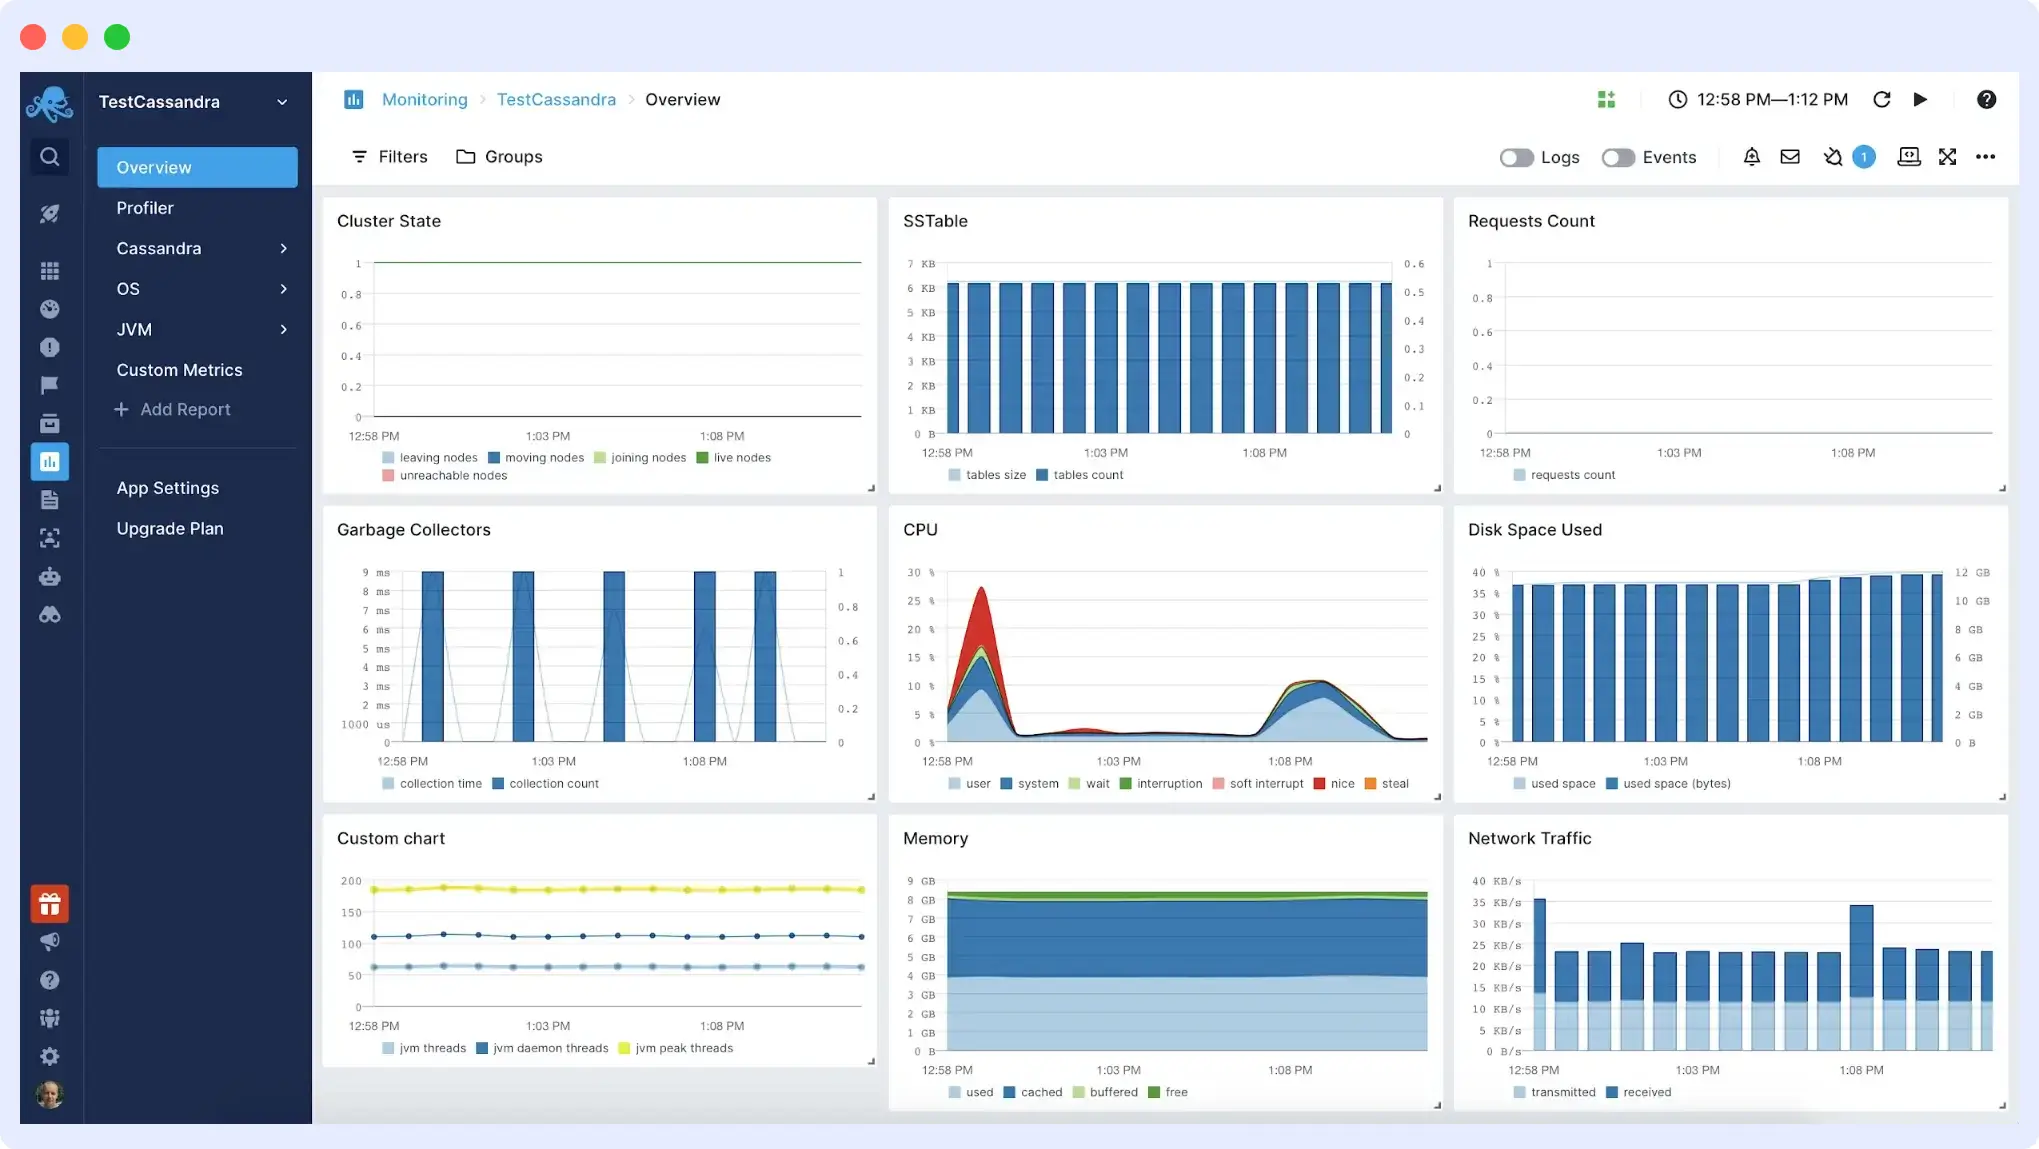
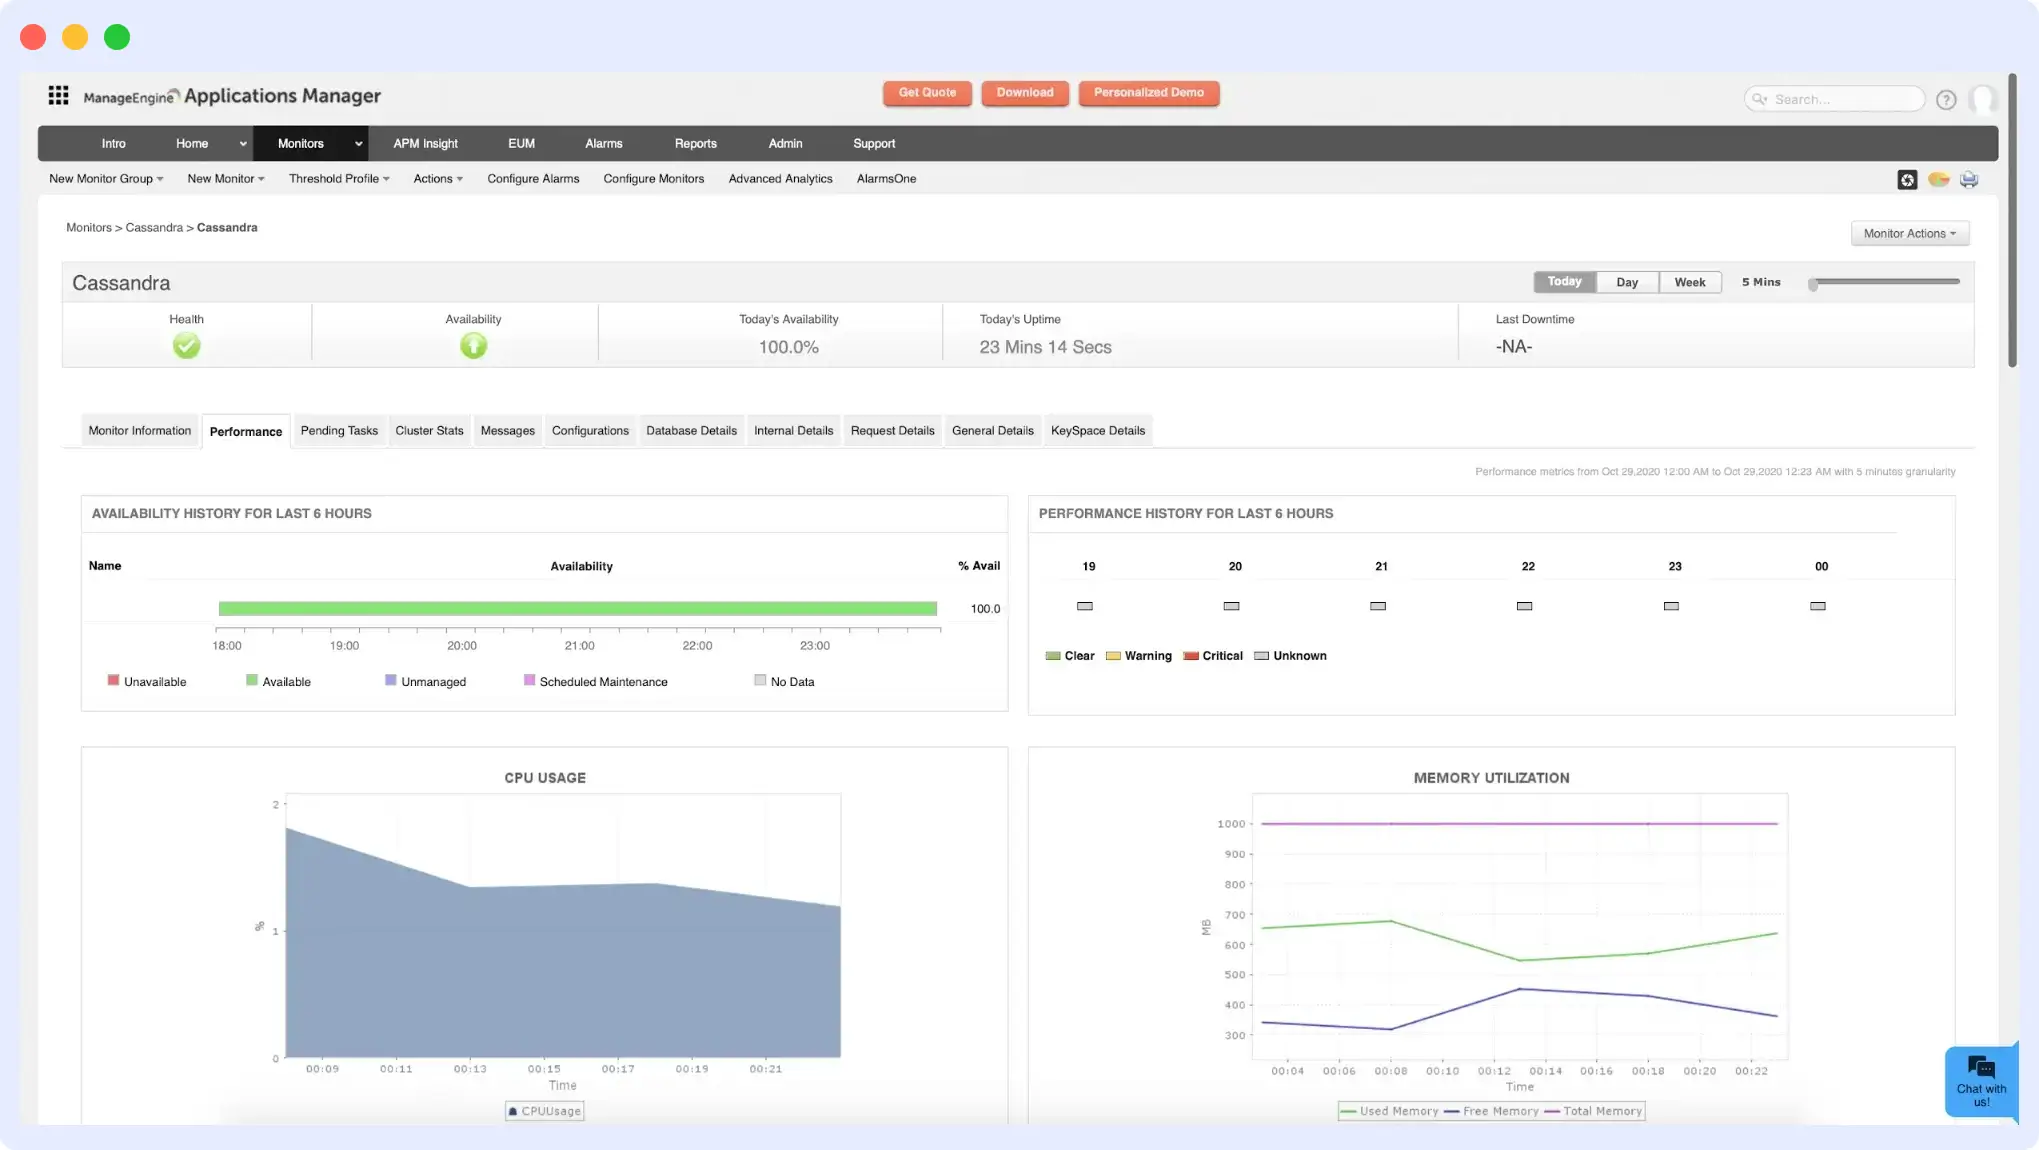
5. ManageEngine Applications Manager
ManageEngine Applications Manager enables a centralized view of nodes within the Cassandra cluster. It collects crucial statistical data, including key Cassandra metrics such as memory usage, thread pool task statistics, storage utilization, CPU performance, operation latency, and pending tasks.
Its comprehensive insights reach live, leaving, moving, joining, and unreachable nodes. Sematext closely monitors memory usage and sends alert notifications for high CPU usage and hardware-related performance issues.
Features
- Monitoring of Apache Cassandra with numerous additional integrations.
- Seamlessly monitors Cassandra running in Docker or Kubernetes.
- Alerting engine with notifications support.
Pricing
The pricing is determined by the version of ManageEngine Applications Manager you choose, that is, between Professional and Enterprise.
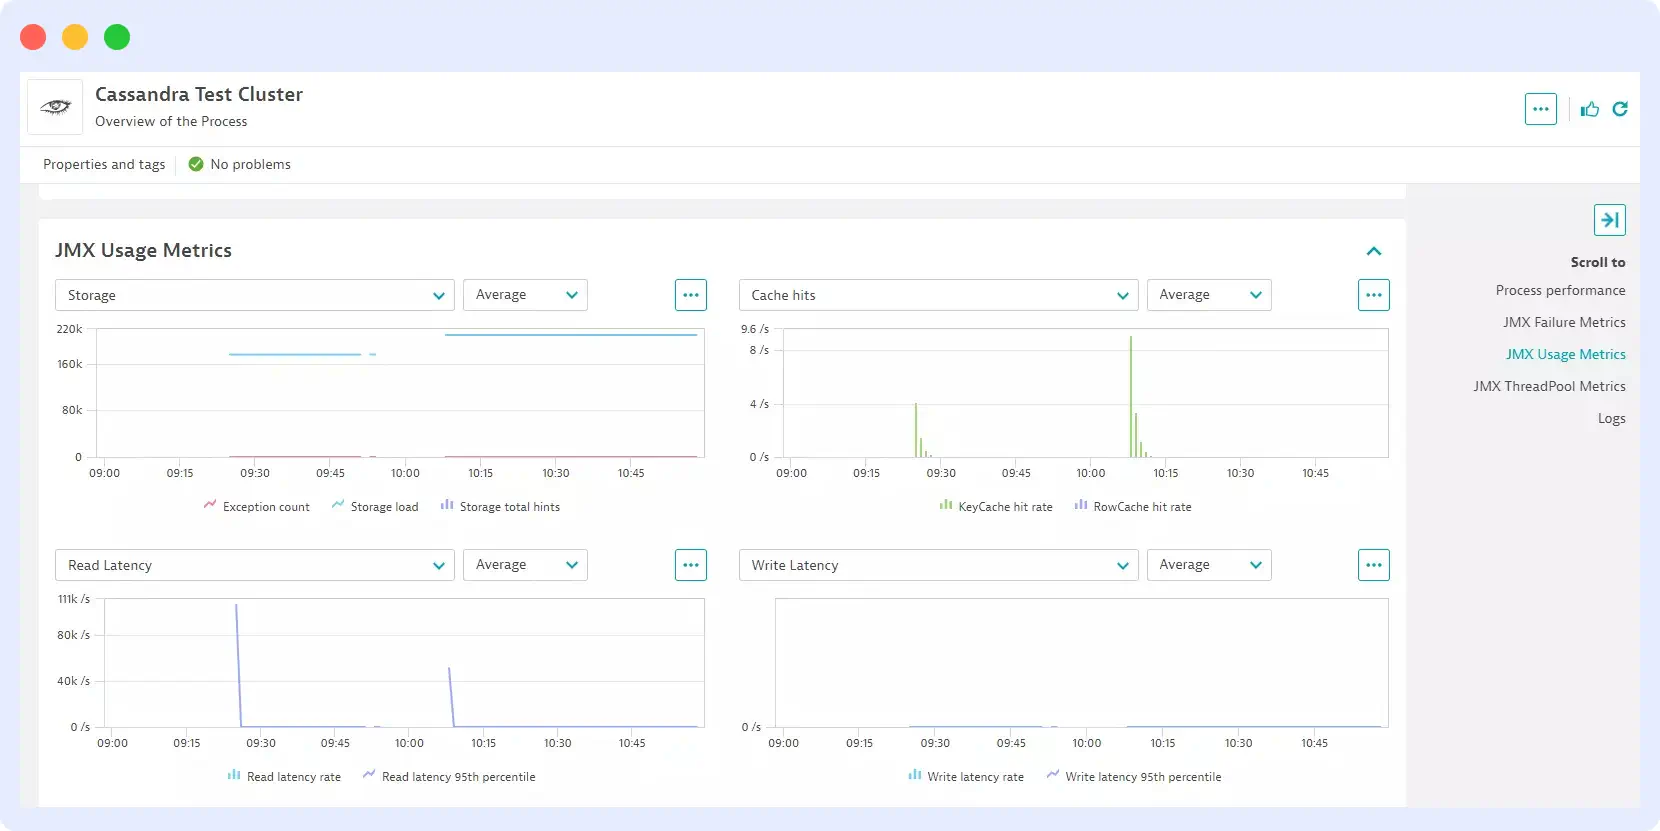
6. Dynatrace
Dynatrace streamlines Cassandra monitoring by automatically detecting key metrics, including CPU usage and garbage collection times.
Once enabled globally, it seamlessly collects metrics when it detects a new Cassandra host across the entire environment, requiring no manual setup.
With its plug-and-play functionality, you can promptly optimize your Cassandra database, while its charting capabilities, such as “Exceptions and Failed requests,” enable you to track metrics and identify potential performance issues.
Features
- Monitoring Apache Cassandra performance with dashboards, as well as code-level tracing.
- First-class log analysis support with automatic detection of common application log types.
- Diagnostic tools for memory dumps, exceptions, and CPU analysis to aid in Cassandra troubleshooting.
- Integrations with Docker, Kubernetes, and OpenShift for simplified Cassandra monitoring.
Pricing
Dynatrace‘s pricing structure is feature-based; it starts at $15 per host/month (Pro) or $23 per host/month (Enterprise) when billed annually. Additional products like APM are billed separately (starting at $31 per host/month)
Looking for a detailed Datadog vs Dynatrace comparison?
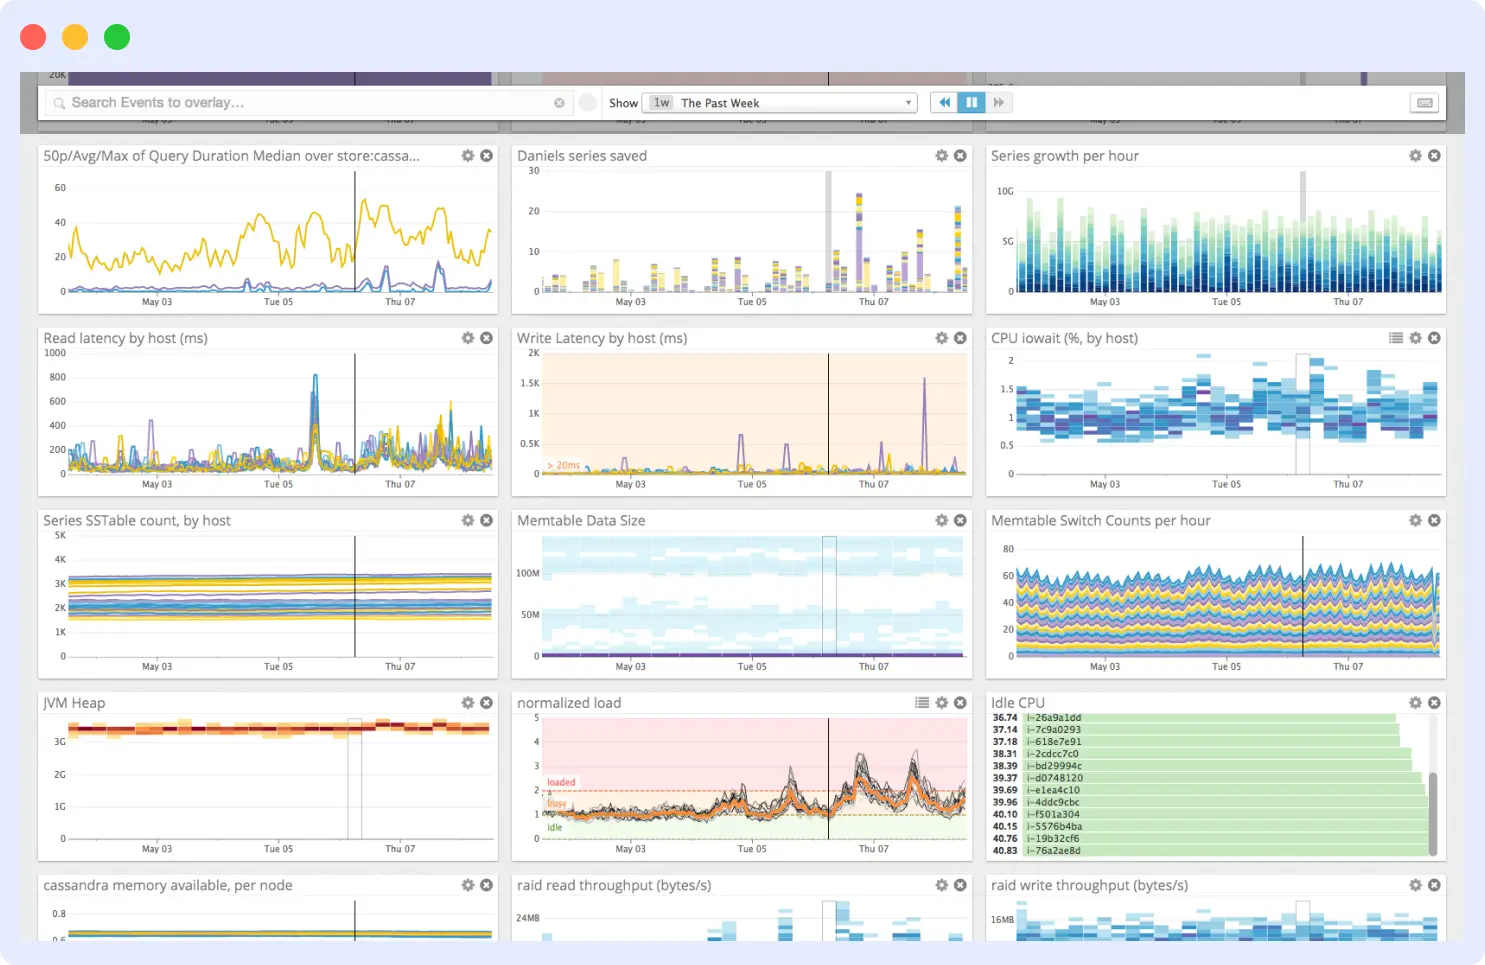
7. Prometheus & Grafana
Prometheus and Grafana form a robust open-source combination that offers flexibility for backend monitoring. This setup allows monitoring of metrics beyond just Apache Cassandra.
With numerous integration configurations for both Prometheus and Grafana, constructing an observability platform for Cassandra and its environment is seamless.
While Prometheus collects Cassandra metrics, you use Grafana dashboards to visualize and explore them.
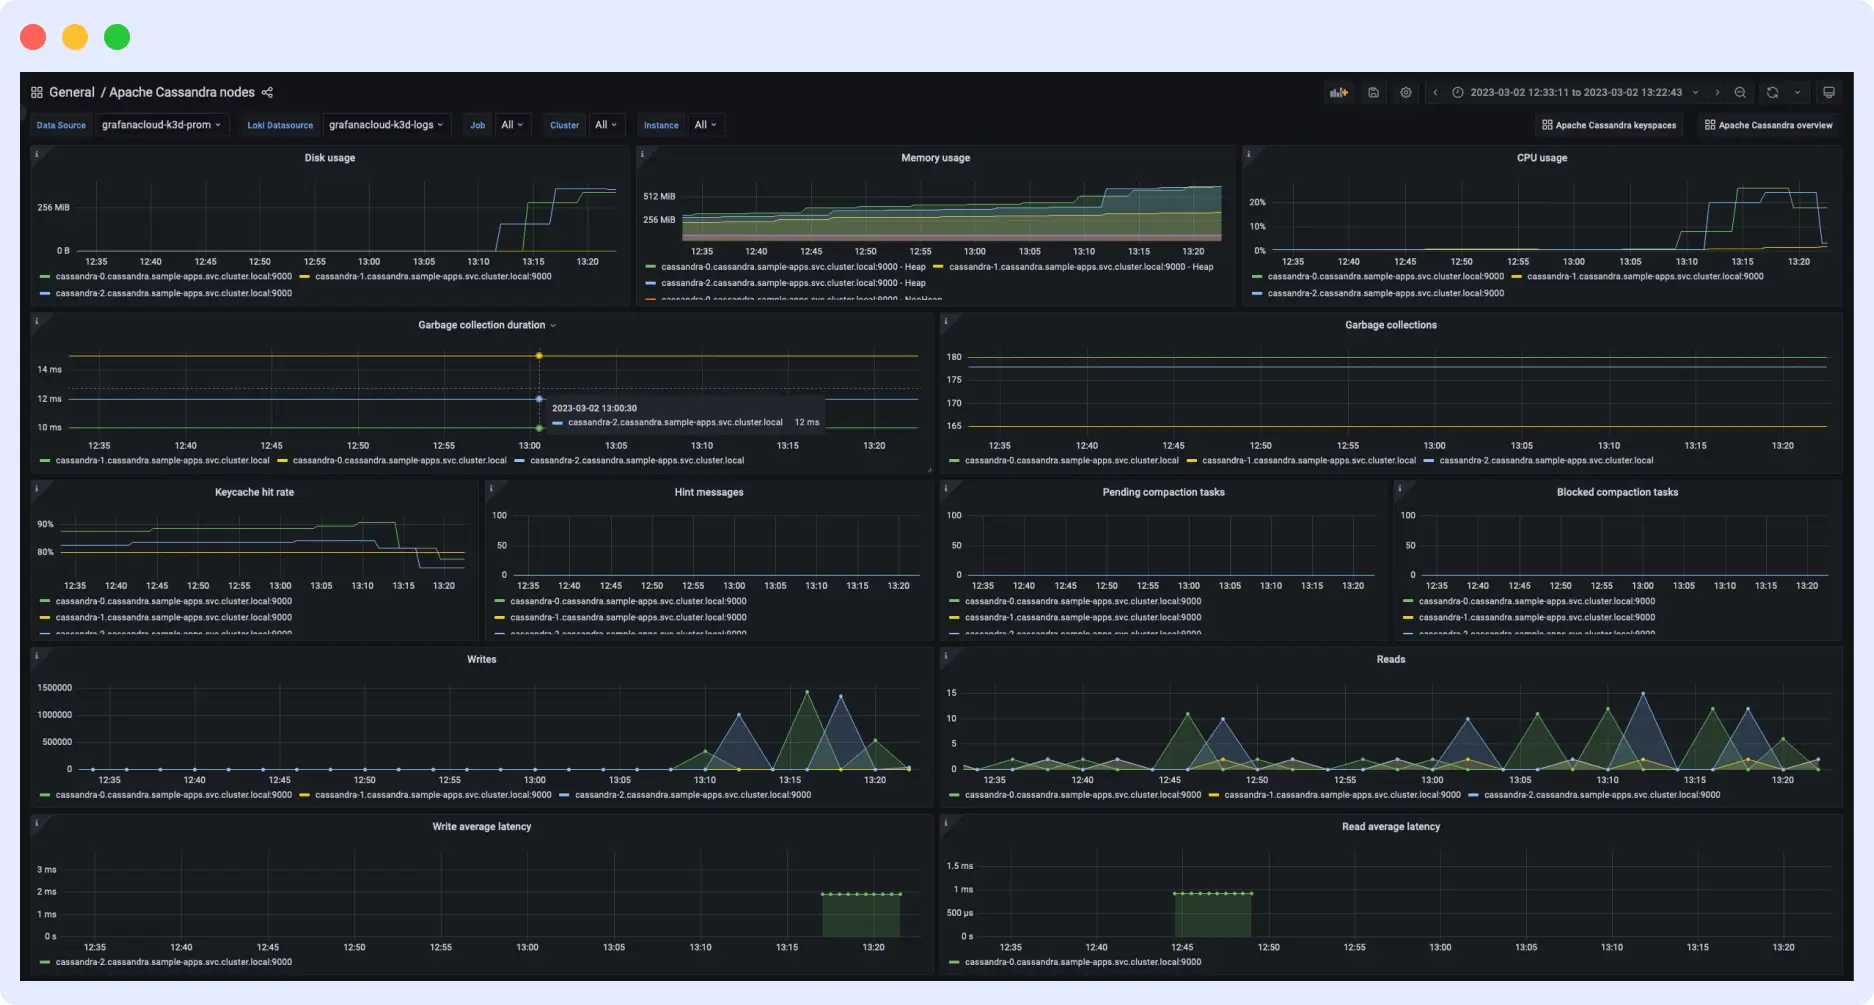
Features
- A highly dimensional datastore implementation for gathering a wide range of Apache Cassandra metrics.
- Efficient time-series storage.
- A comprehensive dashboard with graphing features.
- Out-of-the-box alerting based on Prometheus query language to create alerts for Cassandra metrics.
Pricing
Although it is free, you’ll need to pay for the maintenance and storage of your metrics.
Compare Prometheus, Grafana, and Middleware side‑by‑side.
8. AppDynamics APM
AppDynamics automatically discovers and displays your Cassandra metrics on its dashboard. With its out-of-the-box configurations, you can analyze your transactions through graphs and charts.
AppDynamics captures detailed information that allows users to delve deeply into the components that initiate Cassandra backend calls. The information shown may include a call graph that lets users inspect the actual calls and their timings within their application code.
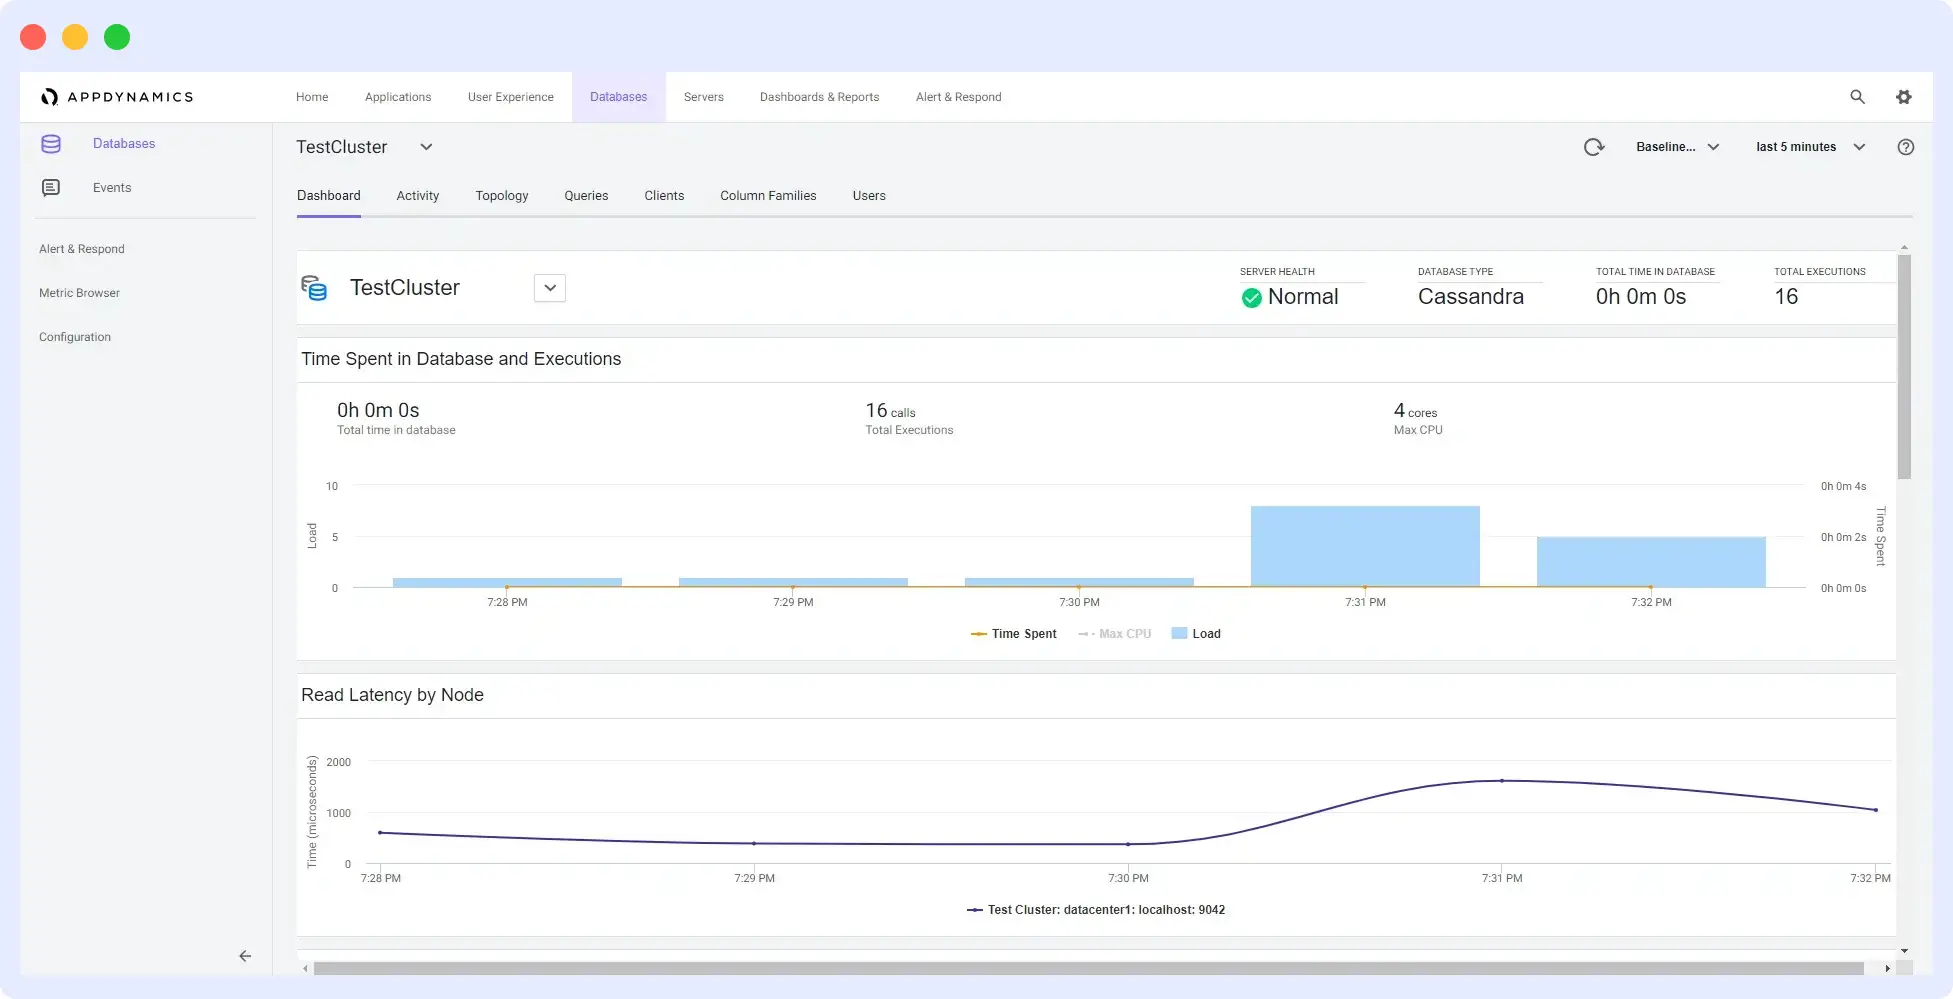
Features
- A full-stack monitoring that offers visibility into Cassandra’s top-level transactions and backend calls.
- Comprehensive infrastructure monitoring that encompasses network components, databases, and servers.
- Anomaly detection that reports with root cause analysis.
- Alerting functionality with email templating and periodic digest capabilities.
Pricing
Pricing is determined based on the features needed from the platform and the agents required. For instance, to access vital CPU, memory, and disk metrics, you must select the APM Advanced plan.
9. SolarWinds
SolarWinds offers comprehensive monitoring for Cassandra clusters and is an ideal on-premise monitoring solution for Microsoft Windows.
It provides visibility into Apache Cassandra metrics, along with Windows and Linux metrics based on the chosen environment.
With built-in alerting and dashboarding capabilities, SolarWinds is well-suited for monitoring both Cassandra and the execution environment.
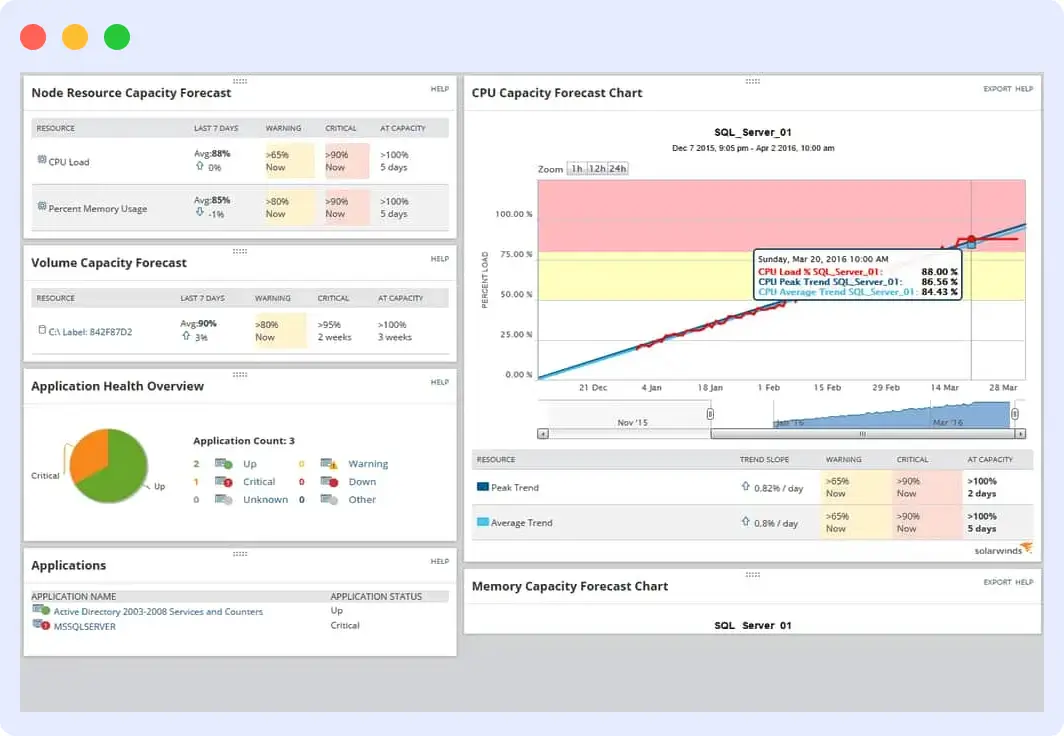
Features
- Support for the Microsoft Windows environment, inclusive of Cassandra monitoring.
- Built-in intelligent alerting to monitor Cassandra metrics and stay on top of critical issues.
- Ability to set alerts tailored to your Cassandra server’s thresholds to prevent slowdowns and bottlenecks.
- Seamless integration with Microsoft Windows-based services such as Active Directory or IIS.
Pricing
You can choose either a periodic subscription or a perpetual license, with pricing starting at $1,275 and a 30-day free trial.
Explore top alternatives to SolarWinds.
10. Zabbix
Zabbix is an open-source, enterprise-level monitoring solution designed to monitor distributed network components and servers, including Cassandra.
It supports both polling- and trap-based monitoring, with email-based alerting that responds to any event within the monitored system. Zabbix provides a web portal for viewing metrics and configuring monitoring behavior.
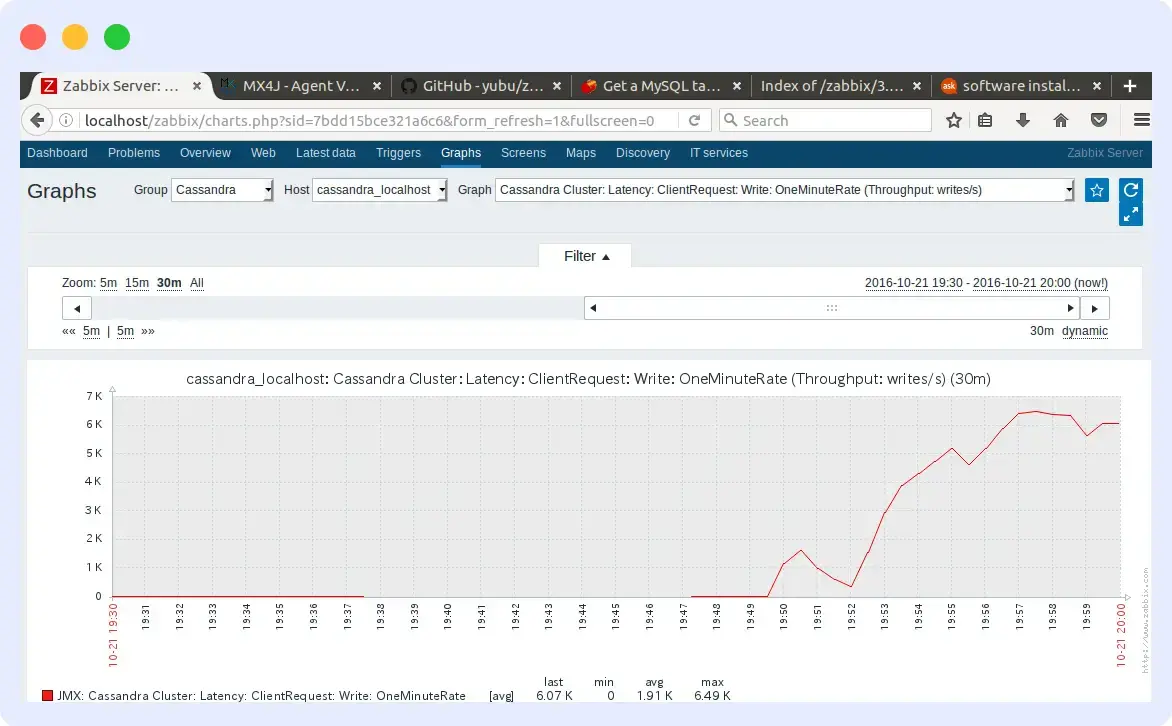
Features
- Template-based host management and auto-discovery.
- Multi-lingual, multi-tenant and flexible user interface with dashboarding capabilities and geolocation support.
- Ideal for large organizations with dispersed data centers housing multiple Cassandra clusters.
- Support for customizable notifications with built-in backing for email, SMS, Slack, etc
Pricing
It is free, but you can subscribe for support, consultancy, and training to expand your knowledge of using the solution.
| Tool | Type | Deployment | Free tier |
| Middleware | Full-stack observability | SaaS | 14-day trial |
| Sematext | Observability & monitoring | SaaS | Yes |
| New Relic | Full-stack observability | SaaS | Yes |
| Datadog | Full-stack observability | SaaS | Limited |
| ManageEngine Applications Manager | Application & infrastructure monitoring | Self-hosted / SaaS (editions vary) | Trial |
| Dynatrace | Full-stack observability | SaaS | Trial |
| Prometheus & Grafana | Open-source monitoring & dashboards | Self-hosted | N/A |
| AppDynamics APM | Application performance monitoring | SaaS / self-hosted | Trial |
| SolarWinds | IT & database monitoring | Primarily self-hosted | Trial |
| Zabbix | Open-source monitoring | Self-hosted | N/A |
Monitor Cassandra Performance with Middleware
Middleware enables metric segmentation, where you closely observe both node-specific and cluster-wide metrics. Cassandra issues rarely come from a single metric; they emerge from patterns across nodes, JVMs, and infrastructure.
Middleware automatically correlates Cassandra metrics with infrastructure signals, helping teams identify the root cause rather than guessing.
With prebuilt Cassandra dashboards, node-level views, and predictive alerts, teams can detect failures before users notice.
It takes a few minutes to integrate Cassandra with the Middleware agent, and accessing your Cassandra data on the Middleware is easy. Simply navigate to the Dashboard Builder and select the Cassandra – Metrics Dashboard, where you visualize all top Cassandra metrics needed to be observed.
FAQs
What are the most important Cassandra monitoring metrics to track?
Track node status (UP/DOWN), read/write latency (<10ms target), client error rates (>1% needs attention), CPU utilization (>80% signals bottlenecks), heap memory usage, garbage collection pauses (>5s problematic), disk usage, and compaction backlog. These cover cluster health, performance, and resource constraints.
How often should I monitor my Cassandra cluster?
Monitor continuously with 1-5 minute intervals for critical metrics (node status, latency, errors) and 5-15 minute intervals for resource metrics (CPU, memory, disk). Set alerts for deviations from your established baselines, reviewing dashboards daily and thresholds quarterly as workloads evolve.
What’s the best Cassandra monitoring tool for small teams?
Middleware offers the best balance with its 14-day free trial, usage-based pricing, dedicated Cassandra dashboard, and 5-minute setup. Open-source Prometheus and Grafana work well for budget-conscious teams willing to invest in operations.
Why is Cassandra disk usage and compaction monitoring critical?
Cassandra’s compaction merges SSTables and removes deleted data, preventing disk overflow that kills performance. >80% disk usage often signals compaction backlog, causing read amplification and latency spikes. Set alerts at 75% disk to stay ahead of failures.
What causes high read latency in Cassandra?
High read latency is usually caused by compaction backlog, disk I/O saturation, hot partitions, or long garbage collection pauses. Monitoring compaction metrics alongside disk and JVM metrics helps identify root cause.
What is the most common Cassandra monitoring mistake?
The most common mistake is monitoring averages instead of percentiles (p95/p99). Cassandra latency issues usually appear in tail latency long before averages change.


