The difference between a 10-minute incident and a 2-hour outage often comes down to five specific practices. Teams that master these consistently report 50% faster resolution times and significantly fewer escalations. This guide breaks down what those practices are, why they work, and how to start implementing them today.
Tool sprawl is one of the most common causes of slow incident response. When logs live in one system, metrics in another, and traces somewhere else entirely, every investigation starts with the same painful question: where do I even look? This fragmentation adds minutes to every incident, and those minutes compound fast. The teams with the lowest MTTR have systematically eliminated that fragmentation.
Whether you’re running Kubernetes clusters, containerized microservices, or hybrid cloud workloads, the five practices below give you a concrete framework for detecting issues faster, resolving them quicker, and building confidence across every deployment.
TL;DR
- Consolidate metrics, logs, and traces into a single dashboard to eliminate context switching during incidents
- Use AI-powered anomaly detection to catch issues before users report them
- Invest in correlated telemetry so related signals are linked automatically for faster root cause analysis
- Monitor deployments in real time against performance baselines to catch regressions early
- Use container-native observability that automatically discovers and tracks dynamic workloads
- Start with your biggest pain point — each practice compounds the benefit of the others
Practice 1: Consolidate your observability stack into a single dashboard
Unified observability means having your metrics, logs, and traces in a single platform where signals are automatically correlated so you can follow one thread from an anomalous metric to the relevant log to the distributed trace that explains what went wrong.
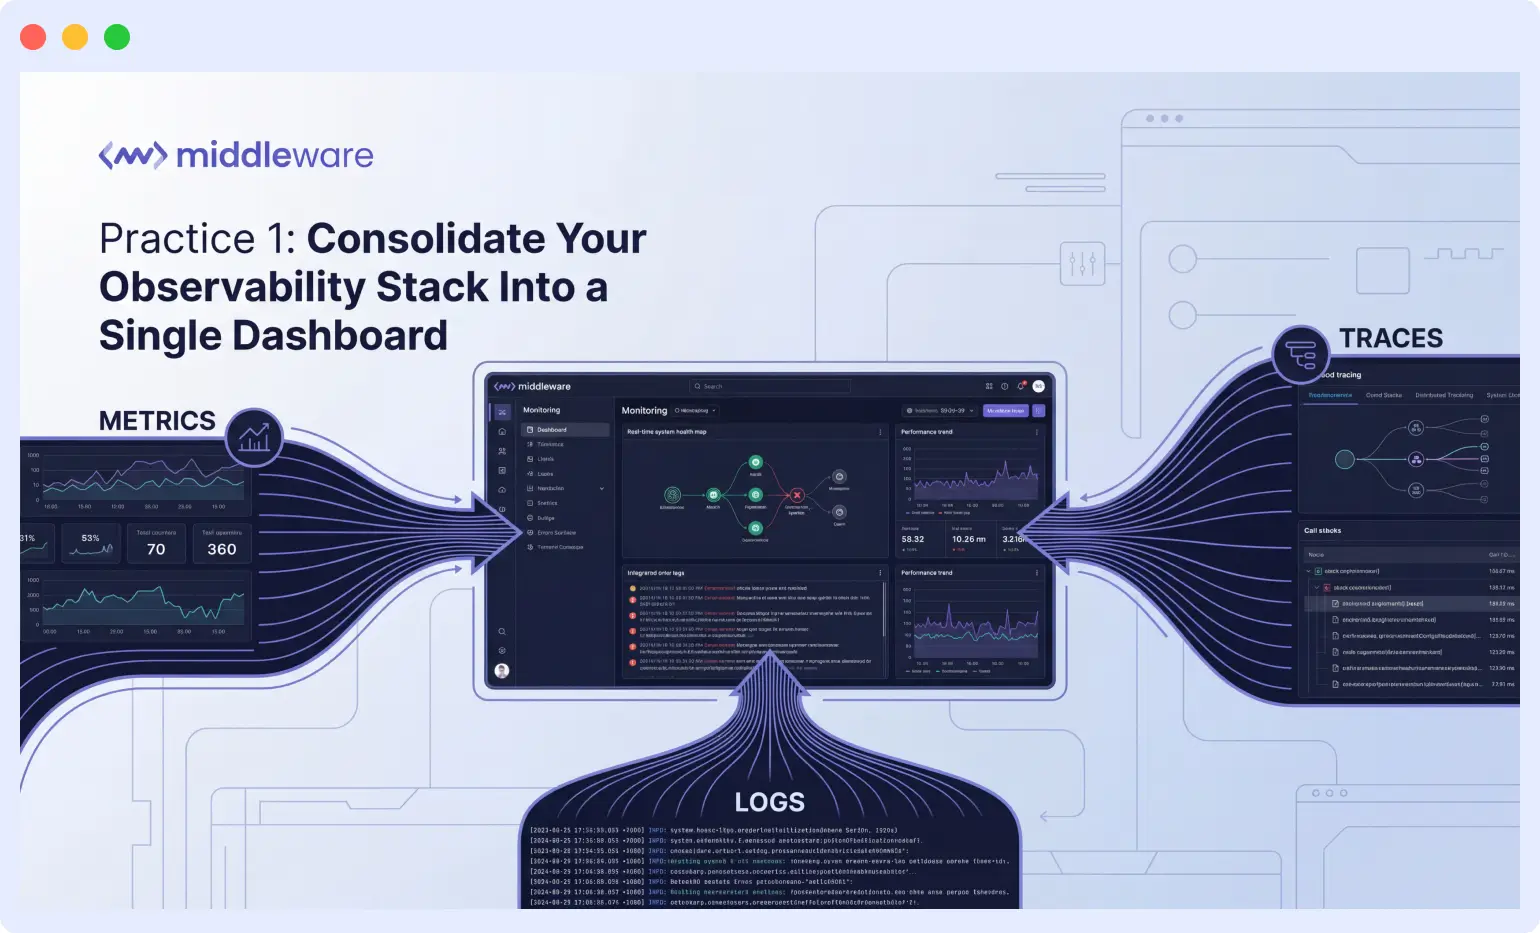
The most impactful change high-performing teams make is eliminating tool switching during incidents. When your telemetry lives in three separate systems, you lose critical context at every handoff and you lose time mentally stitching together information across disconnected dashboards.
Centralized dashboards typically eliminate 5 to 10 minutes of context switching per incident. Over dozens of incidents per month, that compounds into hours of engineer time recovered every week.
How to start: Audit your current toolchain. Map every tool to its primary function and identify overlaps. Most teams find they’re paying for redundant capabilities while still missing visibility in certain areas. A unified platform addresses both.
“Middleware helps us get complete visibility into our cloud infrastructure and application performance in one place. Before using it, we had to rely on multiple tools for monitoring, logging, and alerting, which made it hard to correlate issues quickly.”
Engineer at ChatNCharge
For a deeper look at how full-stack observability reduces detection time, see what is observability and why it matters.
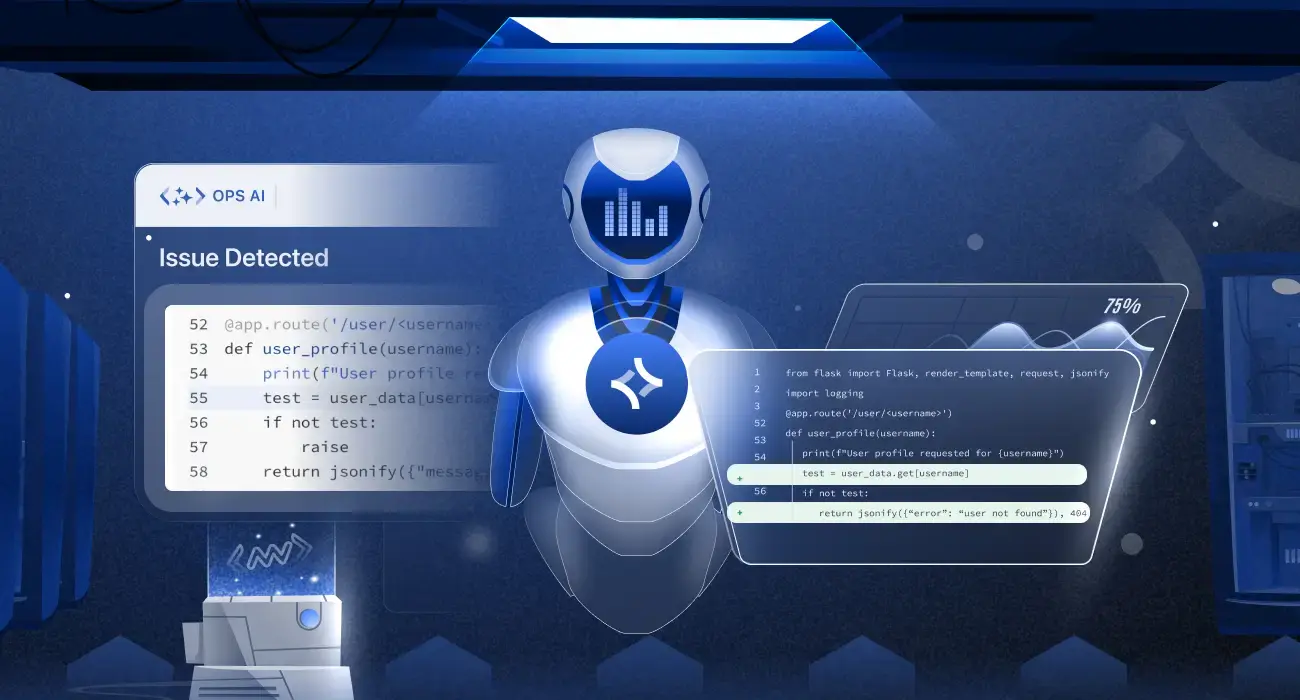
Practice 2: Implement proactive alerting that catches issues before users do
Reactive monitoring is a losing strategy. By the time a customer reports an issue, trust is already damaged, and your team is working from a defensive position. High-performing teams flip this dynamic by detecting anomalies before they become incidents.
Effective proactive alerting requires three components:
- Baseline metrics that define normal behavior for your systems
- Anomaly detection that identifies deviations from those baselines automatically
- Alert routing that notifies the right people with enough context to act immediately
AI-powered anomaly detection has become essential for teams running complex distributed systems. Manual threshold configuration cannot keep pace with dynamic workloads, seasonal traffic patterns, and constantly evolving application behavior. Machine learning models that adapt to your system’s patterns catch issues that static thresholds miss entirely.
“Using real-time alerts and AI-powered anomaly detection, I can proactively address issues before they impact users, leading to better performance and customer satisfaction.”
Engineer at a technology company
Practice 3: Master root cause analysis with correlated telemetry
Finding the root cause of an incident is often harder than fixing it. In distributed systems, a single user-facing error can originate from any of dozens of services, infrastructure components, or external dependencies. The teams that resolve incidents fastest share one trait: they have correlated telemetry that automatically connects the dots.
Correlated telemetry means that when a slow API response triggers an alert, you can immediately see the associated database queries, container resource utilization, network latency between services, and any error logs generated during that request all linked together.
Distributed tracing plays a critical role here. Traces follow requests across service boundaries, showing exactly where time is spent and where errors occur. Combined with logs automatically linked to the same trace ID, you can reconstruct the complete story of any request without manual log searching.
The difference between searching through logs for 30 minutes and clicking directly to the relevant trace span is often the difference between a minor blip and an extended outage.
“The real-time monitoring and alert notifications help me detect issues quickly, and the root-cause analysis feature saves a lot of debugging time.”
Engineer at LDRP ITR
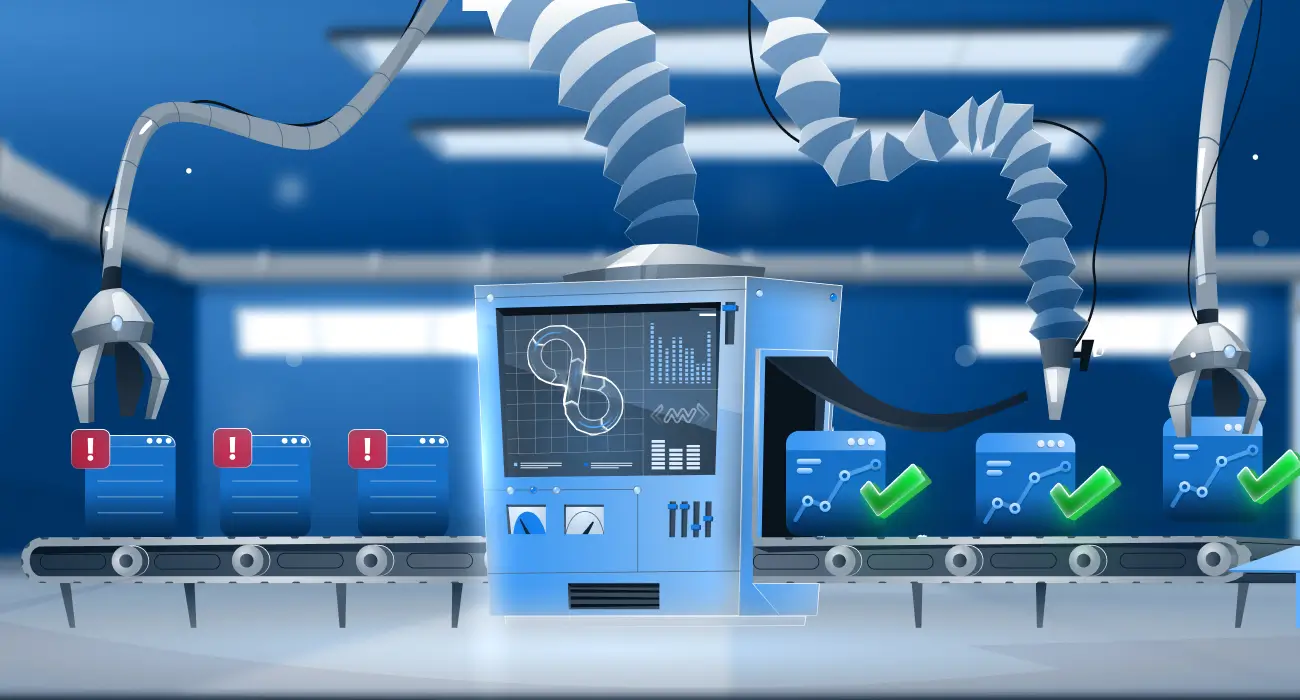
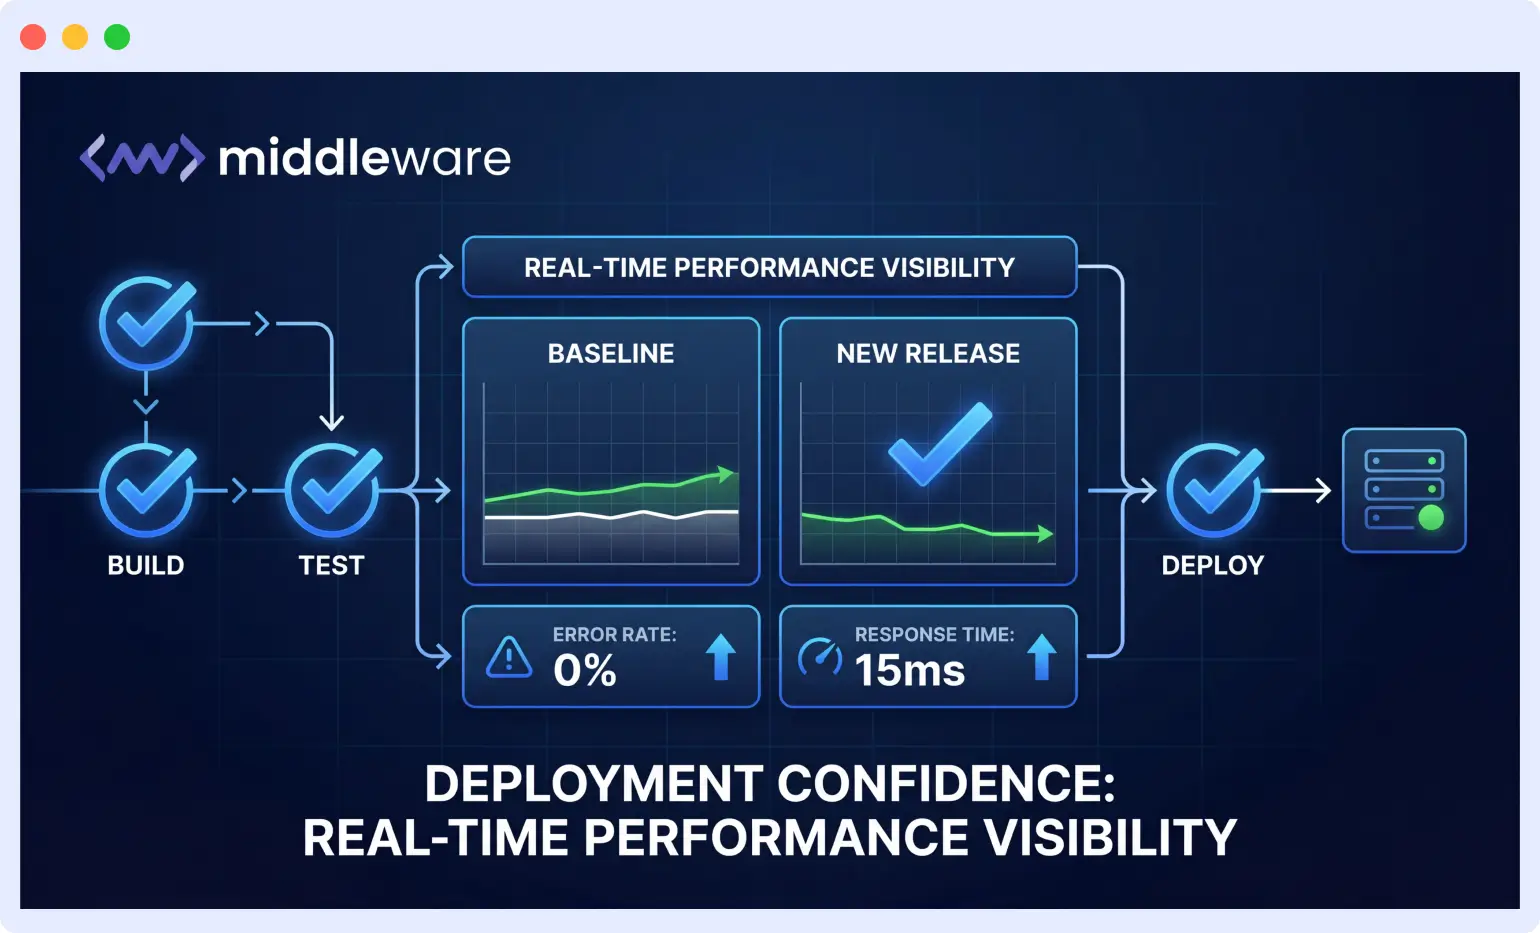
Practice 4: Build deployment confidence with real-time performance visibility
Every deployment is a potential incident. High-performing teams reduce that risk by monitoring deployments in real time, comparing new release performance against established baselines, and catching regressions before they reach all users.
What deployment monitoring requires:
- Performance baselines for critical paths: response times for key endpoints, error rates for essential operations, and resource utilization under normal load
- Real-time overlays of pre- and post-deployment metrics to surface regressions immediately
- Integration with canary or blue-green deployment strategies, so problems surface when only a small percentage of traffic is affected
The psychological impact matters as much as the technical benefit. When your team trusts the monitoring system to catch regressions, they deploy more frequently with less stress. That confidence accelerates release velocity while actually reducing incident rates and compounding return on observability investment.
“It has significantly reduced our mean time to detect (MTTD) and resolve (MTTR) issues, improved system uptime, and given our team confidence during deployments.”
Engineer at ChatNCharge
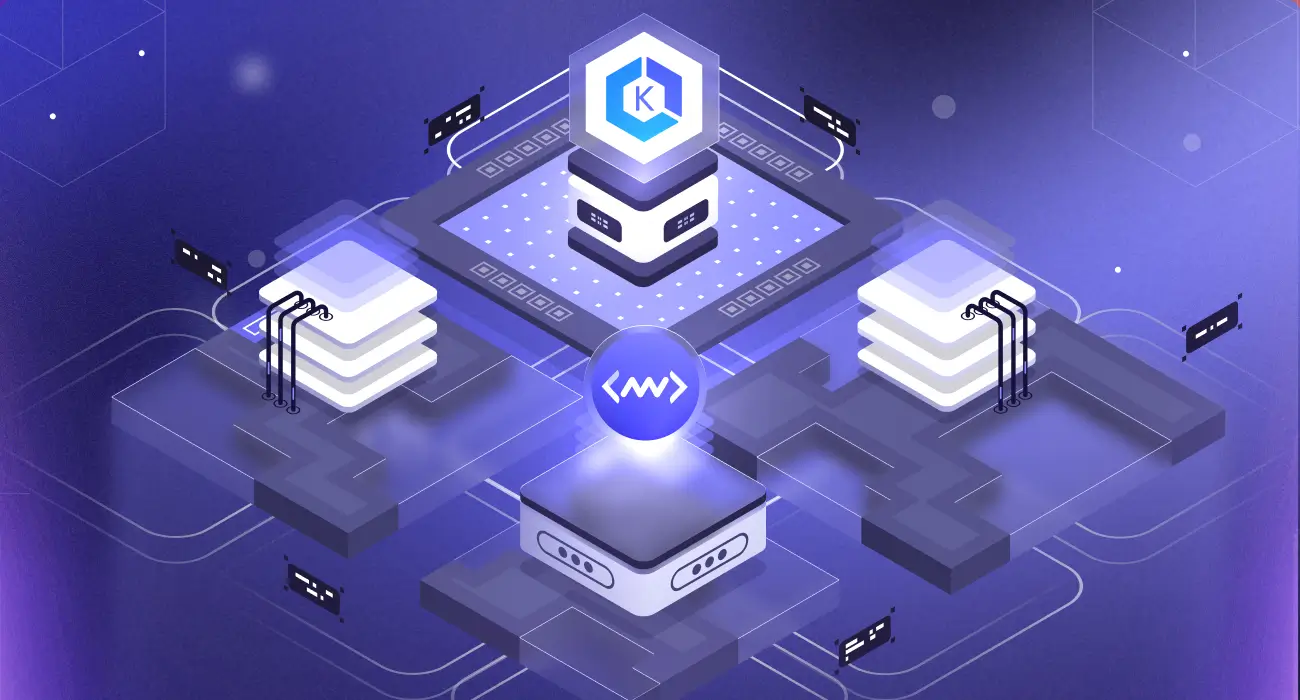
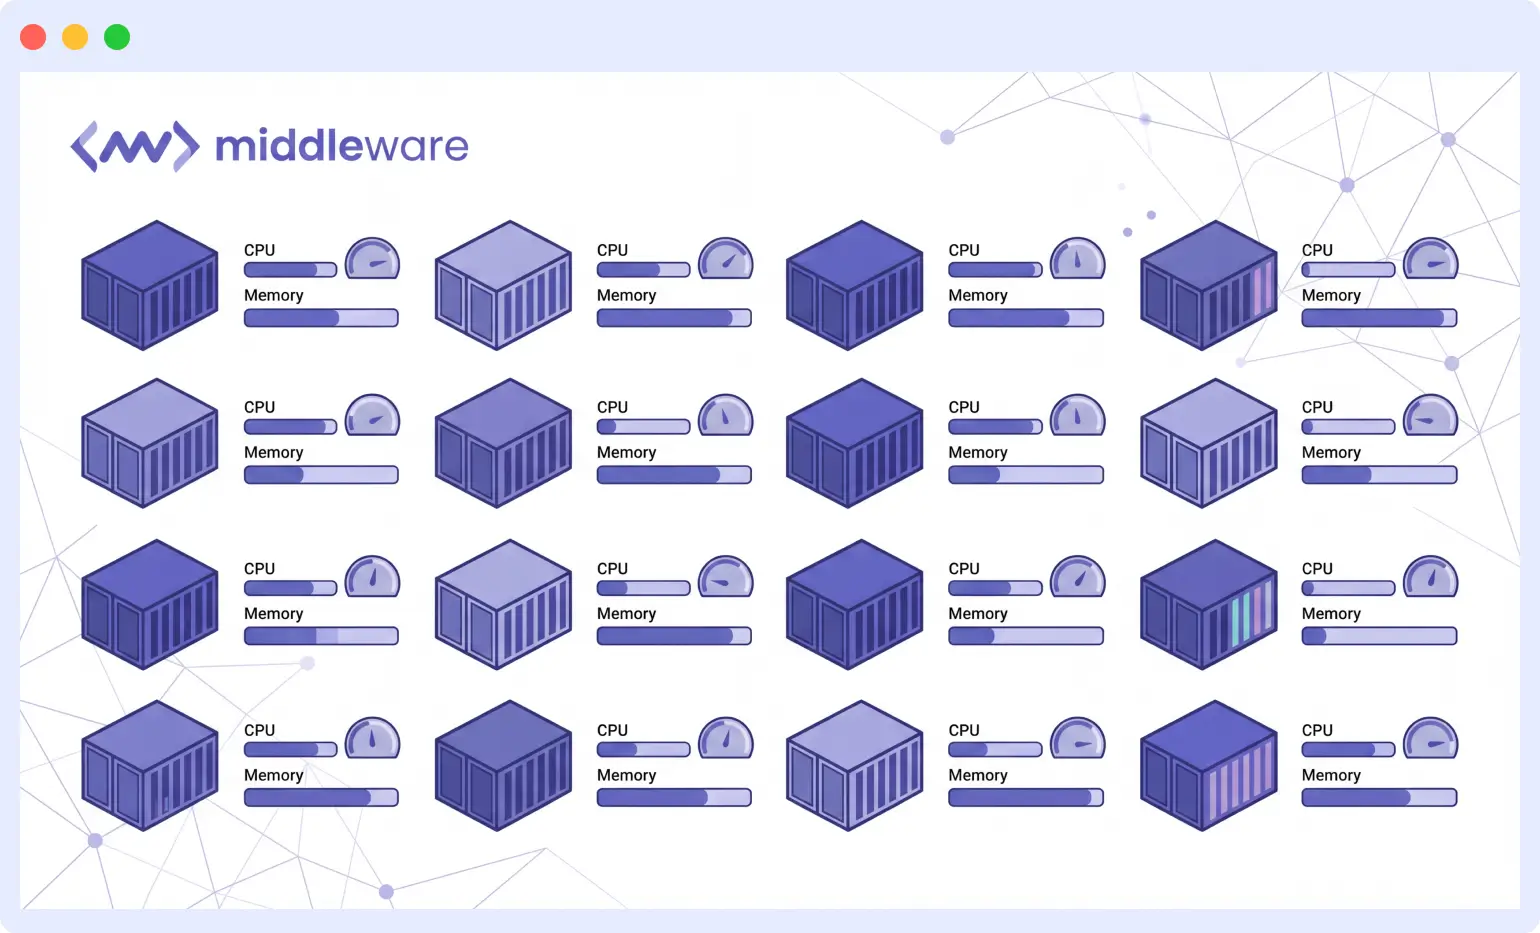
Practice 5: Optimize for container and cloud-native workloads
Kubernetes, Docker, and cloud-native architectures introduce observability challenges that traditional monitoring tools were never designed to handle. Containers are ephemeral, services scale dynamically, and infrastructure topology changes constantly. Teams running modern workloads need monitoring that natively understands these patterns.
Container-aware observability means:
- Automatic discovery of new pods and services as they spin up
- Labels and annotations that carry through to your metrics automatically
- Dashboards that adapt as your topology changes no manual reconfiguration
Resource monitoring is especially critical in containerized environments. CPU throttling, memory pressure, and network saturation cause subtle performance degradation that is hard to diagnose without the right visibility. Teams that monitor container resources alongside application metrics catch infrastructure-level issues before they cascade into application failures.
Cloud cost optimization is a secondary benefit that’s easy to overlook. When you have precise resource utilization data, you can right-size infrastructure, identify idle capacity, and make data-driven decisions about reserved versus on-demand pricing.
For a deeper look at running reliable Kubernetes workloads, see Middleware’s Kubernetes monitoring guide and our articles on OOMKilled errors and Kubernetes deployments.
“The real-time alerting and deep insights into containerized environments and cloud workloads have significantly boosted our operational efficiency and reliability.”
Engineer at E-Cell UCOE
Bringing it all together: the unified observability approach
These five practices share a common foundation: they all require connected, comprehensive observability data. You cannot consolidate dashboards without a platform that supports metrics, logs, and traces together. You cannot implement proactive alerting without anomaly detection that understands your system’s normal behavior. You cannot master root cause analysis without correlated telemetry that automatically links related signals.
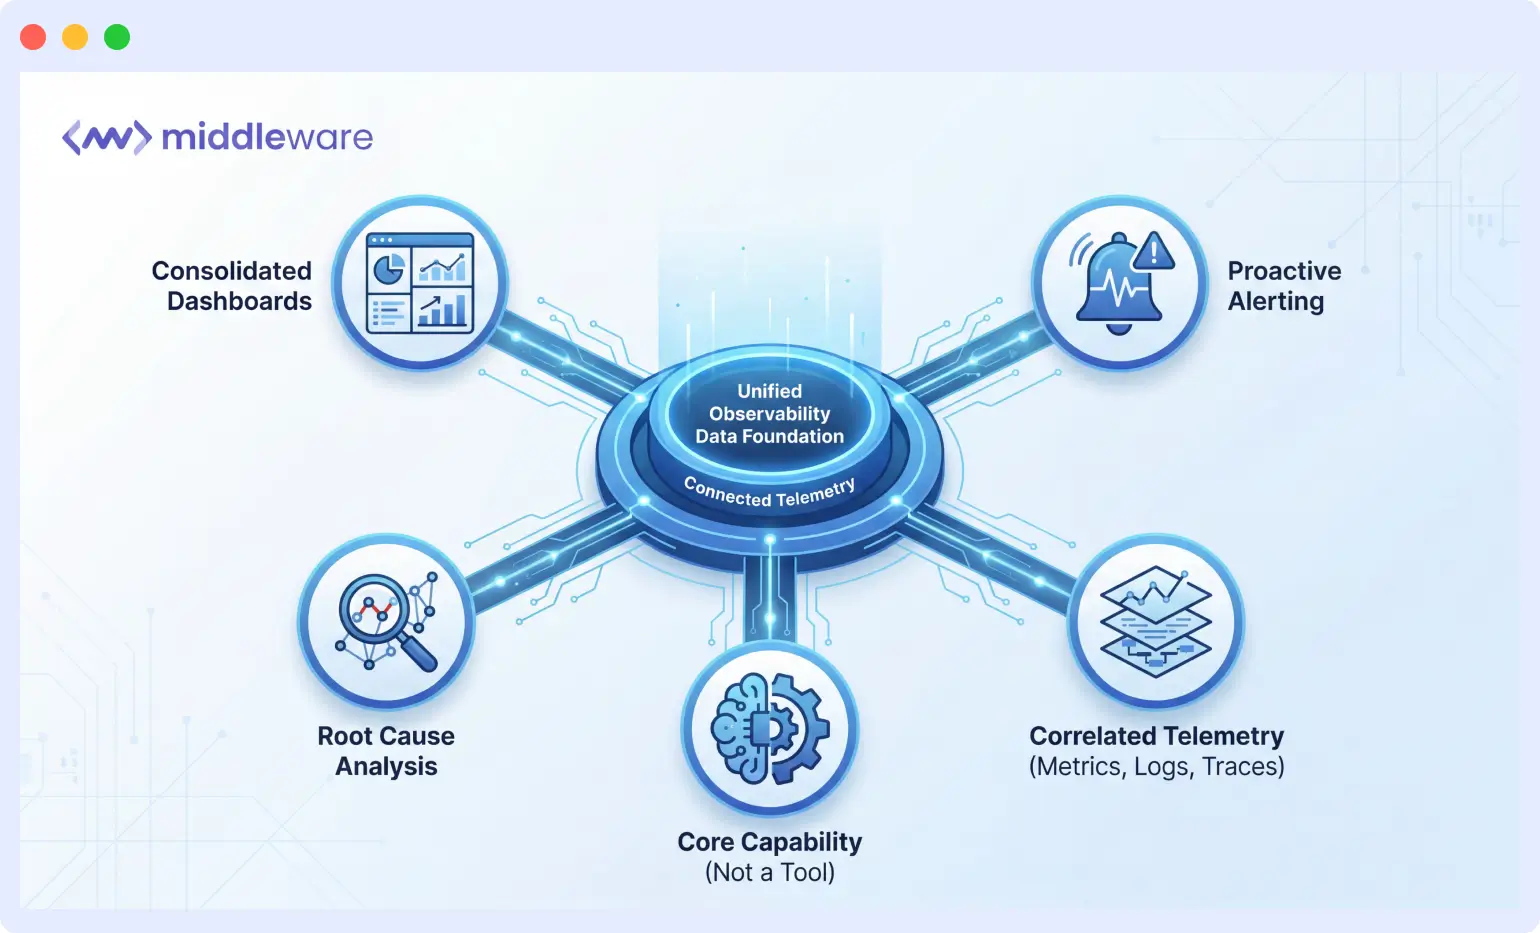
The most successful teams treat observability as a core capability rather than a collection of tools. They invest in platforms that grow with their infrastructure, support their deployment practices, and provide the depth of insight needed for fast incident response.
Start with the practice that addresses your most pressing pain point. If tool sprawl is your biggest challenge, focus on consolidation first. If deployment anxiety is slowing your release velocity, prioritize real-time deployment monitoring. Each practice builds on the others, creating a compounding effect as your observability maturity increases.
Teams that consistently achieve sub-10-minute MTTR have systematically implemented these practices, invested in the right tooling, and built organizational habits around proactive monitoring and Middleware gives you all of it in one place.
“Middleware makes monitoring and observability extremely seamless. I love how it combines metrics, logs, and traces in one unified dashboard — no need to juggle multiple tools.”
Engineer at ChatNCharge
Cut your MTTR with Middleware
Get full-stack observability metrics, logs, traces, and AI-powered anomaly detection in a single unified platform.
FAQs
What does MTTR stand for and why does it matter?
MTTR stands for mean time to resolve (or mean time to repair). It measures the average time from when an incident is detected to when the system is fully restored. Lower MTTR means shorter outages, reduced customer impact, and less on-call stress. It’s one of the core DORA metrics used to assess DevOps performance and reliability.
What is the difference between MTTR and MTTD?
MTTD (mean time to detect) measures how long it takes to discover that an incident is occurring. MTTR measures how long it takes to resolve it after detection. Both matter: fast detection is useless if resolution is slow, and fast resolution is impossible if detection takes too long. High-performing teams work to reduce both simultaneously through unified observability and proactive alerting.
How does consolidating observability tools reduce MTTR?
When metrics, logs, and traces live in separate tools, engineers spend 5 to 10 minutes per incident just switching between systems and correlating data manually. Unified platforms eliminate that overhead by automatically linking related signals. Over dozens of monthly incidents, this compounds into hours of recovered engineer time and significantly faster resolution.
What is correlated telemetry?
Correlated telemetry is observability data where signals from different sources (metrics, logs, traces) are automatically linked by shared identifiers like trace IDs, pod names, or request timestamps. When you click an alert, correlated telemetry shows you the relevant logs and the distributed trace for that exact request — without manual searching.
Why is static threshold alerting insufficient for modern systems?
Modern distributed systems have dynamic workloads, seasonal traffic patterns, and constantly changing baselines. Static thresholds trigger false positives during expected traffic spikes and miss anomalies that are subtle but significant. AI-powered anomaly detection adapts to your system’s actual behavior over time, dramatically reducing alert fatigue while catching real issues earlier.
How does Kubernetes observability differ from traditional infrastructure monitoring?
Kubernetes workloads are ephemeral and dynamic: pods spin up and down, services scale automatically, and topology changes constantly. Traditional monitoring requires manual configuration for each new host. Kubernetes-native observability automatically discovers new pods and services, propagates labels through to metrics, and adapts dashboards as the cluster changes — with no manual reconfiguration required.
What observability metrics should I monitor during deployments?
The most important deployment metrics are: error rate (HTTP 4xx/5xx responses), p95 and p99 latency for key endpoints, throughput (requests per second), and container resource utilization (CPU, memory). Compare each against pre-deployment baselines in real time. If you’re using canary deployments, compare canary vs. stable traffic on all four metrics before promoting the release.
How can observability help reduce cloud costs?
Precise resource utilization data from observability tooling lets you identify over-provisioned instances, idle capacity, and services consuming more CPU or memory than their workload requires. This visibility enables right-sizing decisions that reduce infrastructure spend without impacting performance — a benefit that often pays for the observability investment itself.