Frontend performance metrics measure how quickly and smoothly a web or mobile application behaves for users. This includes load time, interactivity, and visual stability across different devices, browsers, and app environments.
Frontend performance metrics often show that something is wrong, but they fail to explain who is affected, how it impacts users, and where the issue originates. This lack of context turns small regressions into long debugging cycles.
This guide explains how to connect frontend metrics with real user experience using Real User Monitoring (RUM), session replay, and distributed tracing so teams can move from signals to root cause faster.
Real User Monitoring (RUM) is a passive monitoring technology that records and analyzes the actual interactions of users with a website or application.
Why do frontend metrics often miss critical user context?
Frontend performance data can tell you that something has slowed down, but it rarely explains what that slowdown actually means for users. A rise in average interaction latency might suggest everyone is experiencing a minor delay, or it could mean a small group of users is facing severe lag while the majority notice nothing at all.
This is one of the most common blind spots in Frontend performance optimization: aggregated numbers hide the stories of individual users.
In our demo, certain “Add to Cart” buttons for certain products fail intermittently. Traditional analytics might surface an overall error rate and average response time, but those aggregates hide the critical questions:
- Which sessions experienced the failures?
- How many actions did affected users attempt before giving up?
- Did users retry successfully?
- How much frustration did the failures generate?
In real-world applications, performance issues don’t usually impact an entire page at once. More often, they surface during specific interactions. A button might freeze when clicked. A form could be submitted without visible feedback. A checkout step may time out silently.
From a monitoring dashboard, these problems look identical, just another spike in API latency, with no clear explanation of what went wrong or who was affected.
How do traditional dashboards differ from correlated rum insights?
This is the core problem with relying solely on browser performance monitoring. The table below illustrates the gap:
| Traditional Approach | With Correlated RUM |
| Error rate increased 3% | 12 users repeatedly clicked ‘Add to Cart’ with no response |
| Average latency: 450ms | Checkout flow took 8+ seconds for premium users |
| 500 errors logged | Errors clustered around a specific product category |
| Conversion rate dropped 22% | A high-value customer abandoned cart after 3 failed attempts |
| Overall traffic normal | Mobile users in one region experienced higher failure rates |
This disconnect between frontend performance monitoring tools and actual user experience makes prioritization much harder. Teams can see that something has slowed down, but don’t know whether it’s disrupting a high-value checkout flow or a rarely used feature. Without that context, work gets prioritized based on metric severity rather than actual business impact.
This is precisely where real user monitoring and user experience monitoring become necessary. They add the missing context by tying frontend interactions to backend requests and showing where time is actually spent during a user action.
Distributed Tracing tracks requests as they flow through multiple services and components in a distributed system, providing visibility into latency and errors across the entire stack.
Why is my website or app slow, but metrics look fine?
This is one of the most frustrating situations in frontend observability, and it’s more common than most teams expect.
The reason is almost always aggregation. When you average latency across thousands of requests, outliers disappear. A p50 of 200ms looks acceptable even when p95 is 4 seconds.
Standard dashboards don’t tell you that those slow p95 requests are happening exclusively during your checkout flow, or only for users on mobile in specific geographies.
Correlated real user monitoring (RUM) solves this by capturing performance at the session level, not just as a statistical summary, and linking every slow interaction to the user journey that produced it.
What is the recommended methodology for frontend performance investigations?
Regardless of which frontend observability platform you use, effective performance debugging follows a consistent four-step methodology. High-performing teams don’t start by scanning logs or optimizing code at random. They follow a structured sequence that keeps user impact at the center.
- Filter by signals → Identify sessions with errors, slowness, or frustration
- Prioritize by impact → Focus on high-value users or business-critical flows
- Reconstruct the journey → See what the user actually experienced
- Trace to root cause → Connect frontend actions to backend performance
This performance debugging workflow applies whether you’re using Middleware or assembling your own observability stack. The tools may differ, but the investigative sequence remains the same.
Detecting the problem: real user monitoring in action
How real user monitoring improves user experience
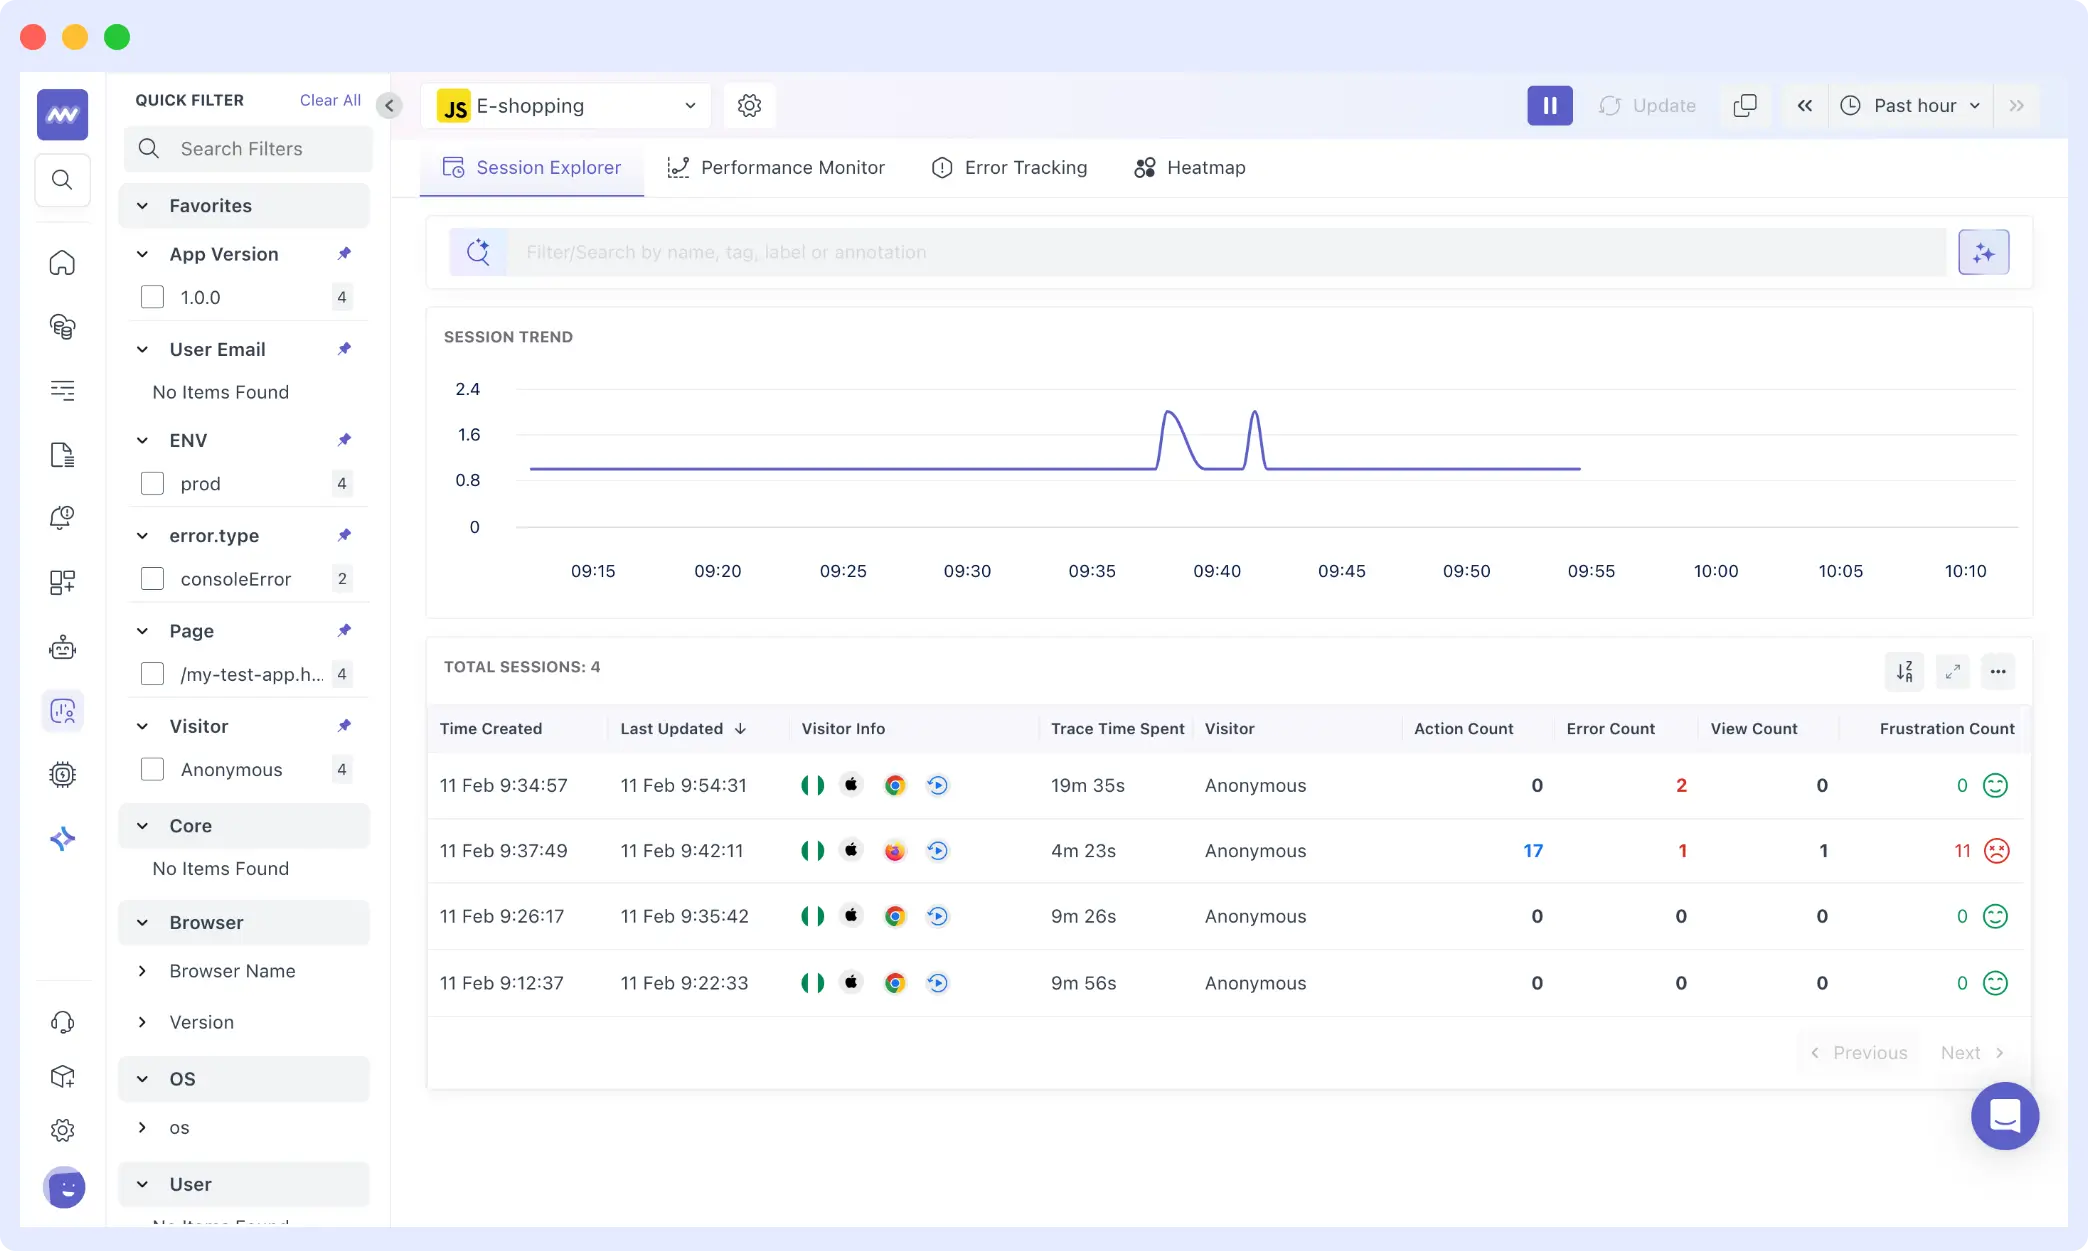
In the Middleware RUM dashboard, sessions stream in real-time. Instead of looking at aggregate metrics, you’re viewing individual user sessions, the foundational shift that makes real user monitoring so powerful for debugging.
The Session Explorer shows four sessions captured over the past hour. Looking at the session list, you can immediately see key signals:
- Frustration Events: Rage clicks, dead clicks, error clicks.
- Session Duration + Error Count: Long sessions with multiple errors = a struggling user
- Action/Error Ratio: 17 actions with 2 errors = 11% failure rate for that specific user
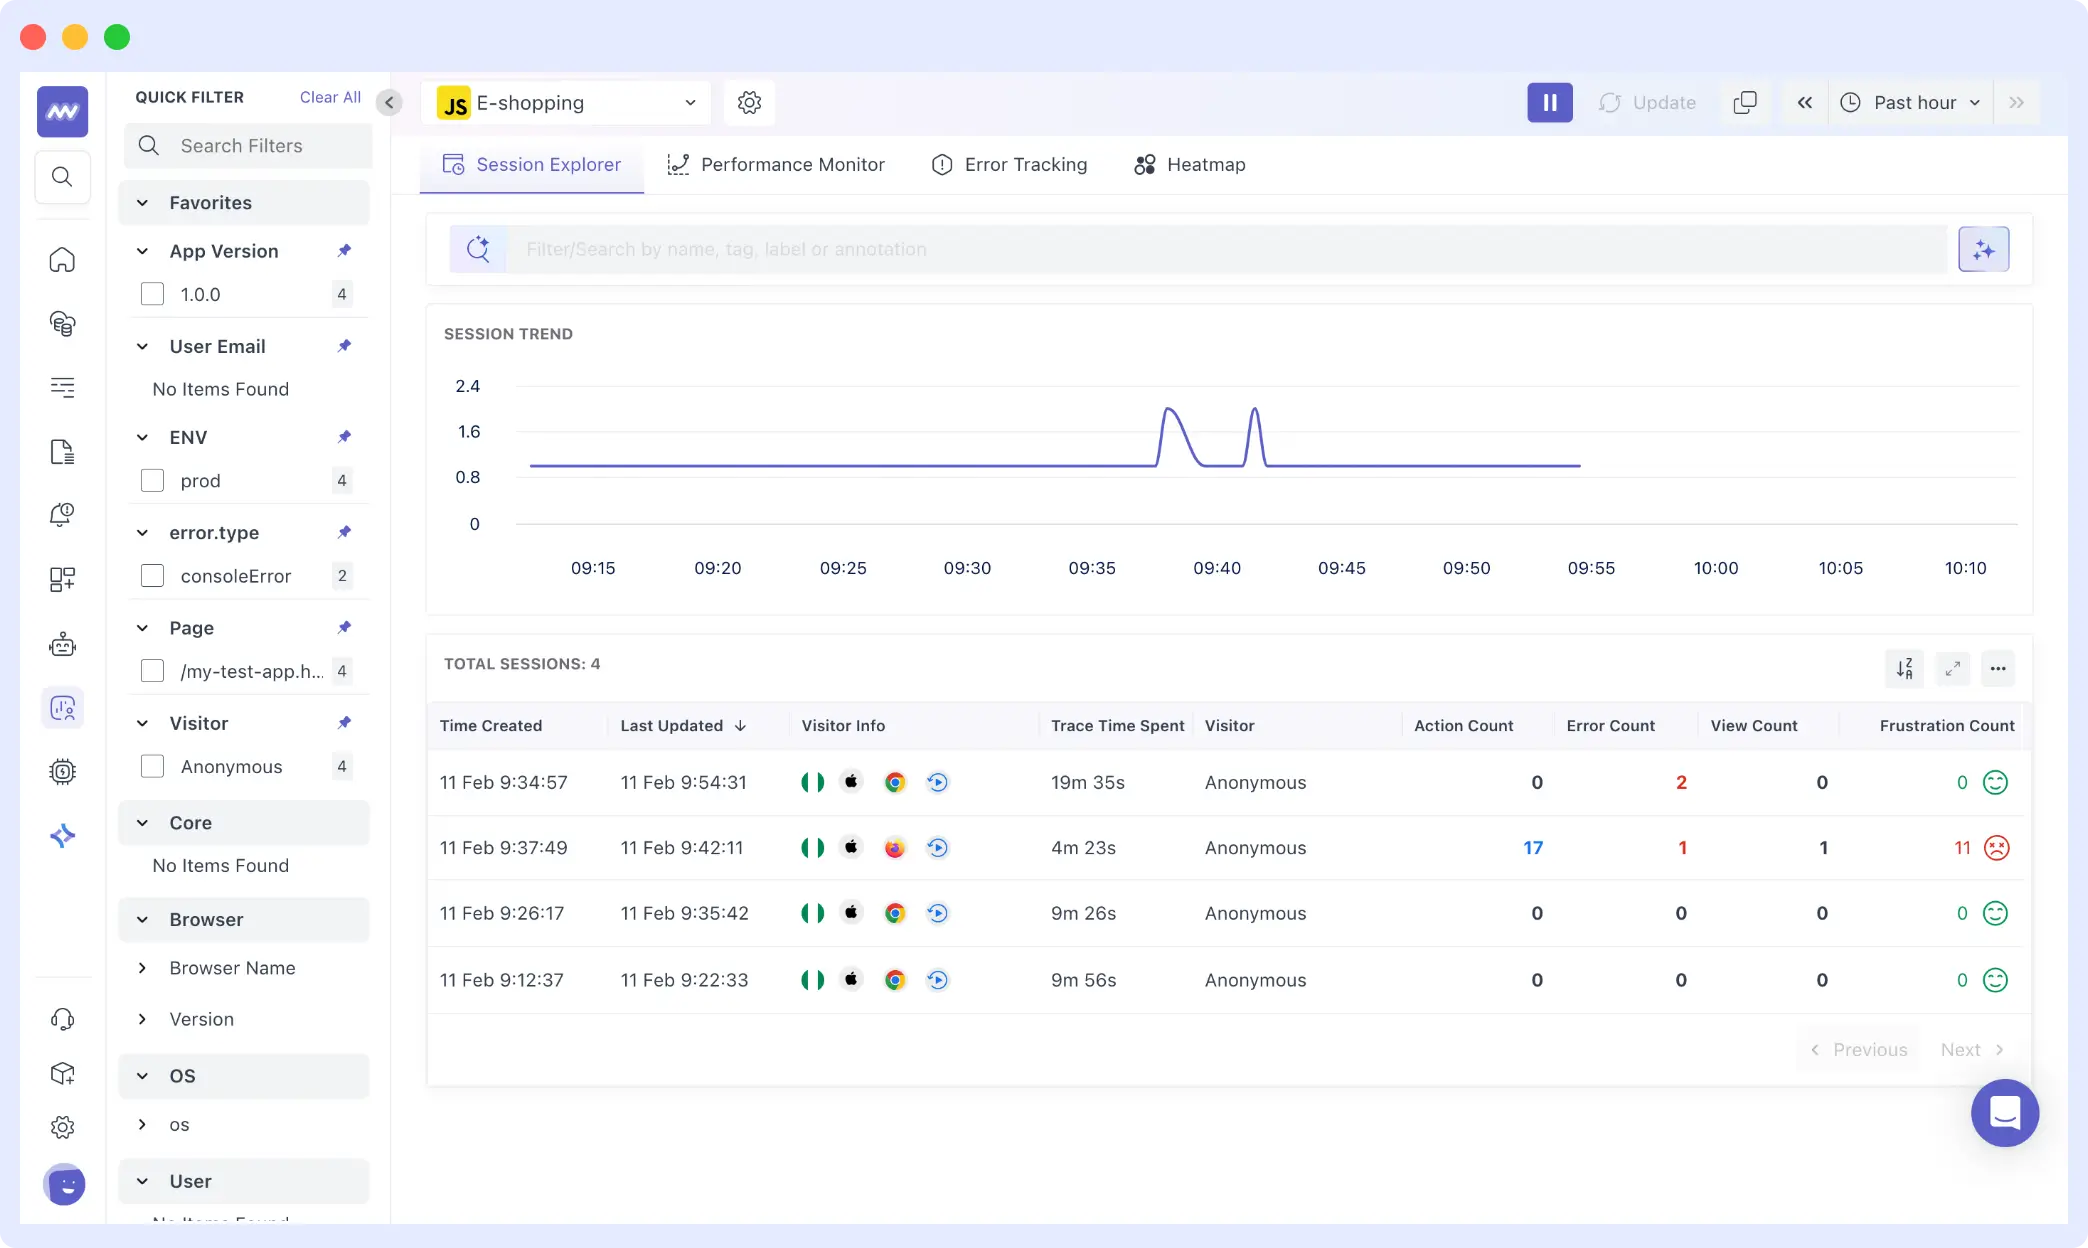
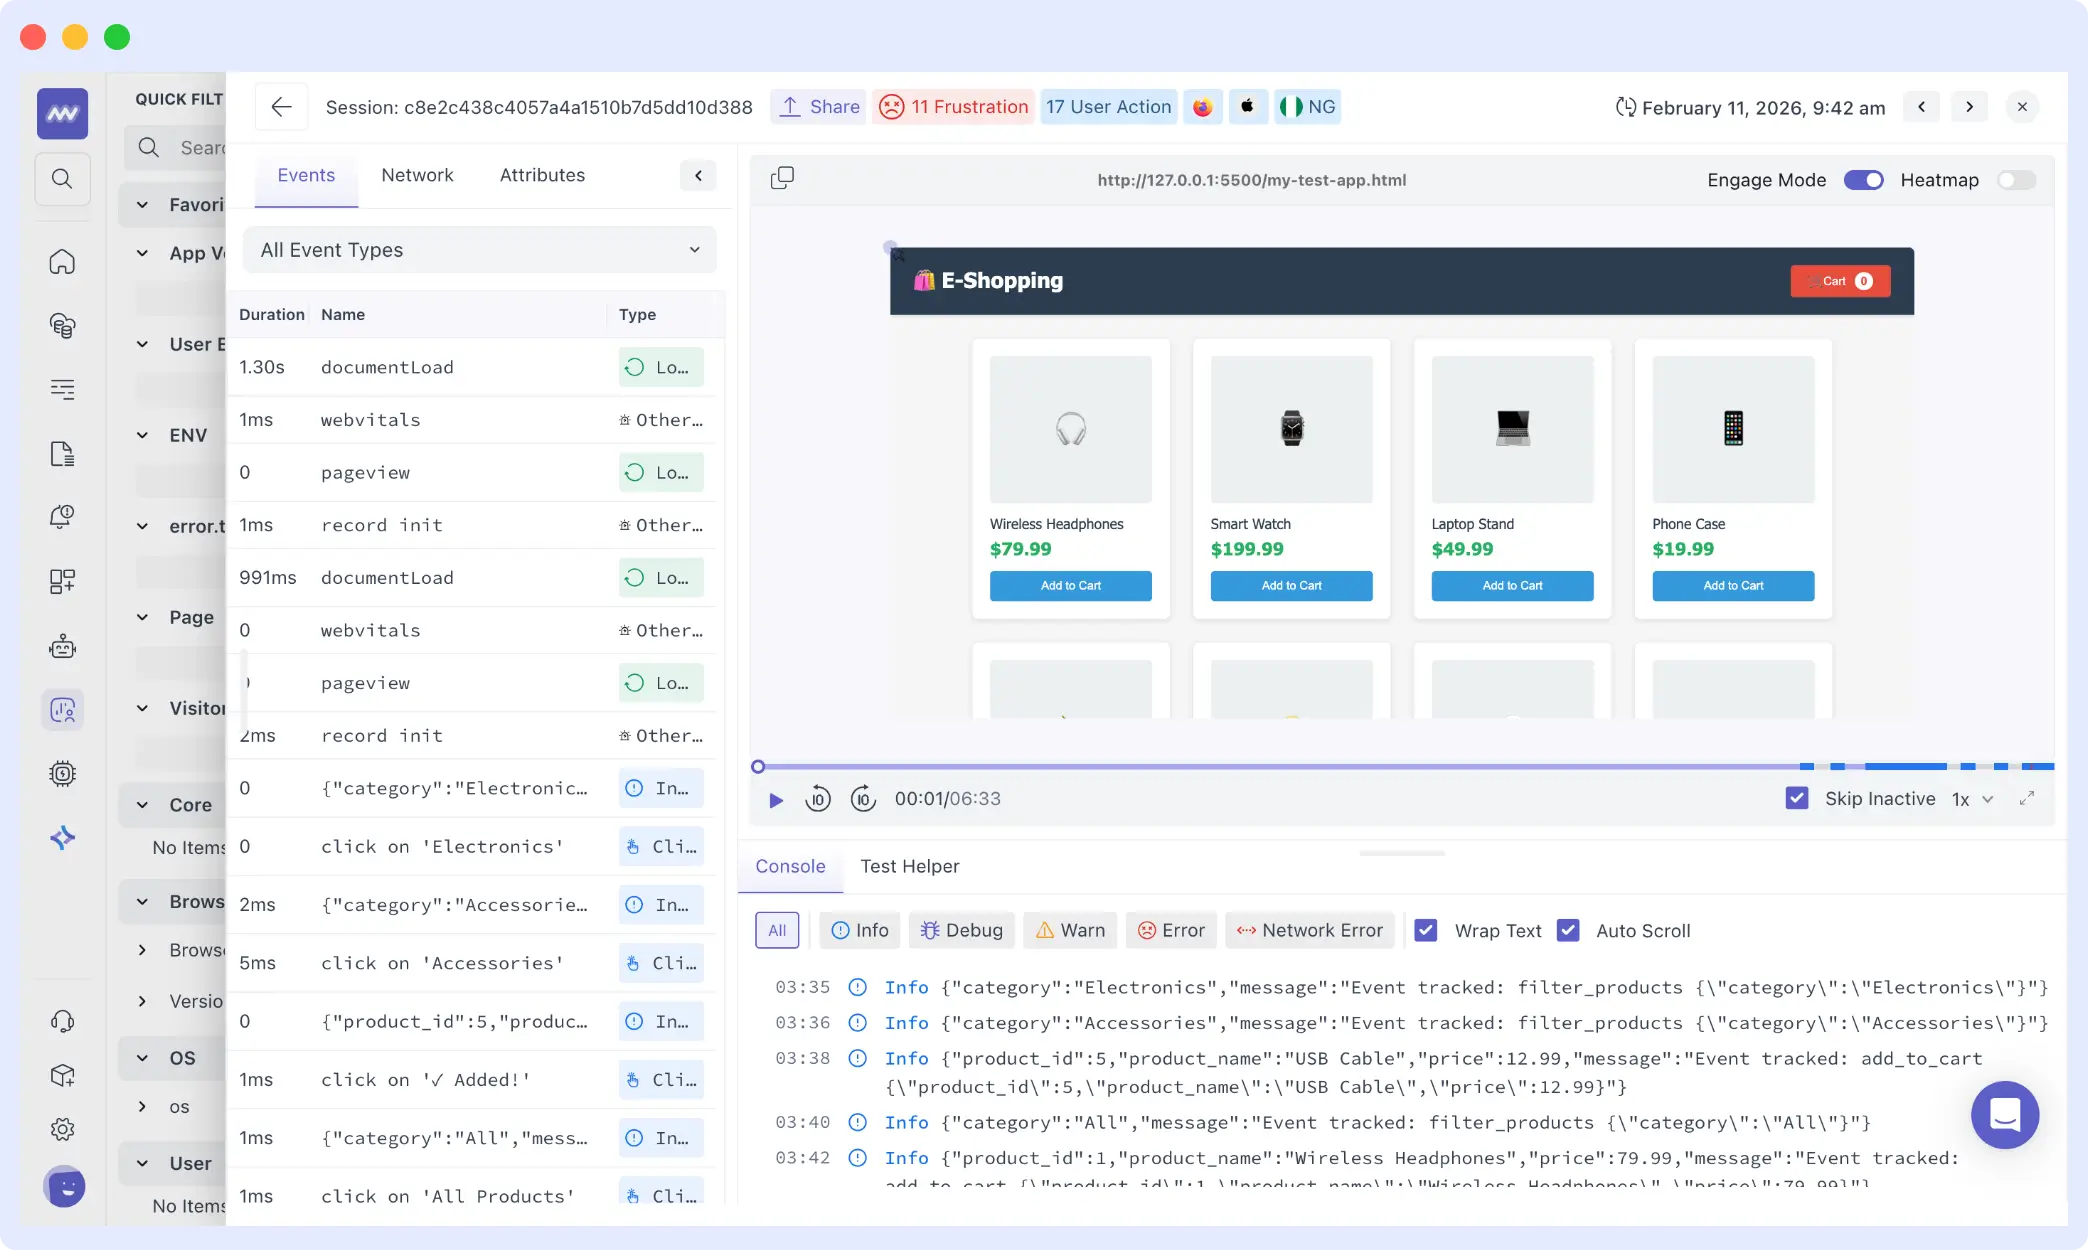
When sessions are filtered by error type, a clear pattern emerges. Clicking into the problematic session reveals add_to_cart_error events clustered around specific products.
Each session record exposes:
- Duration: 4m 23s
- Session ID: c8e2c438c4057a4a1510b7d5dd10d388
- Error Count: 2
- Frustration Count: 11
- Actions: 17
Traditional metrics would aggregate this into a percentage. RUM reveals the specific context: which user, how many actions they took, how long they spent, and critically, how frustrated they became.
From here, we shift to Error Tracking to understand what exactly failed across sessions.
How to detect rage clicks and user frustration in web or apps
Frustration signals are among the most underused data points in user experience monitoring. Rage clicks, when a user clicks the same element repeatedly in quick succession, are a direct behavioral indicator that something isn’t working as expected.
In our demo session, 11 frustration events were recorded alongside 2 errors. That ratio is telling: the user didn’t encounter a complete failure, but they experienced enough inconsistency to generate repeated clicking behavior. This is exactly the kind of nuance that aggregate error rates erase.
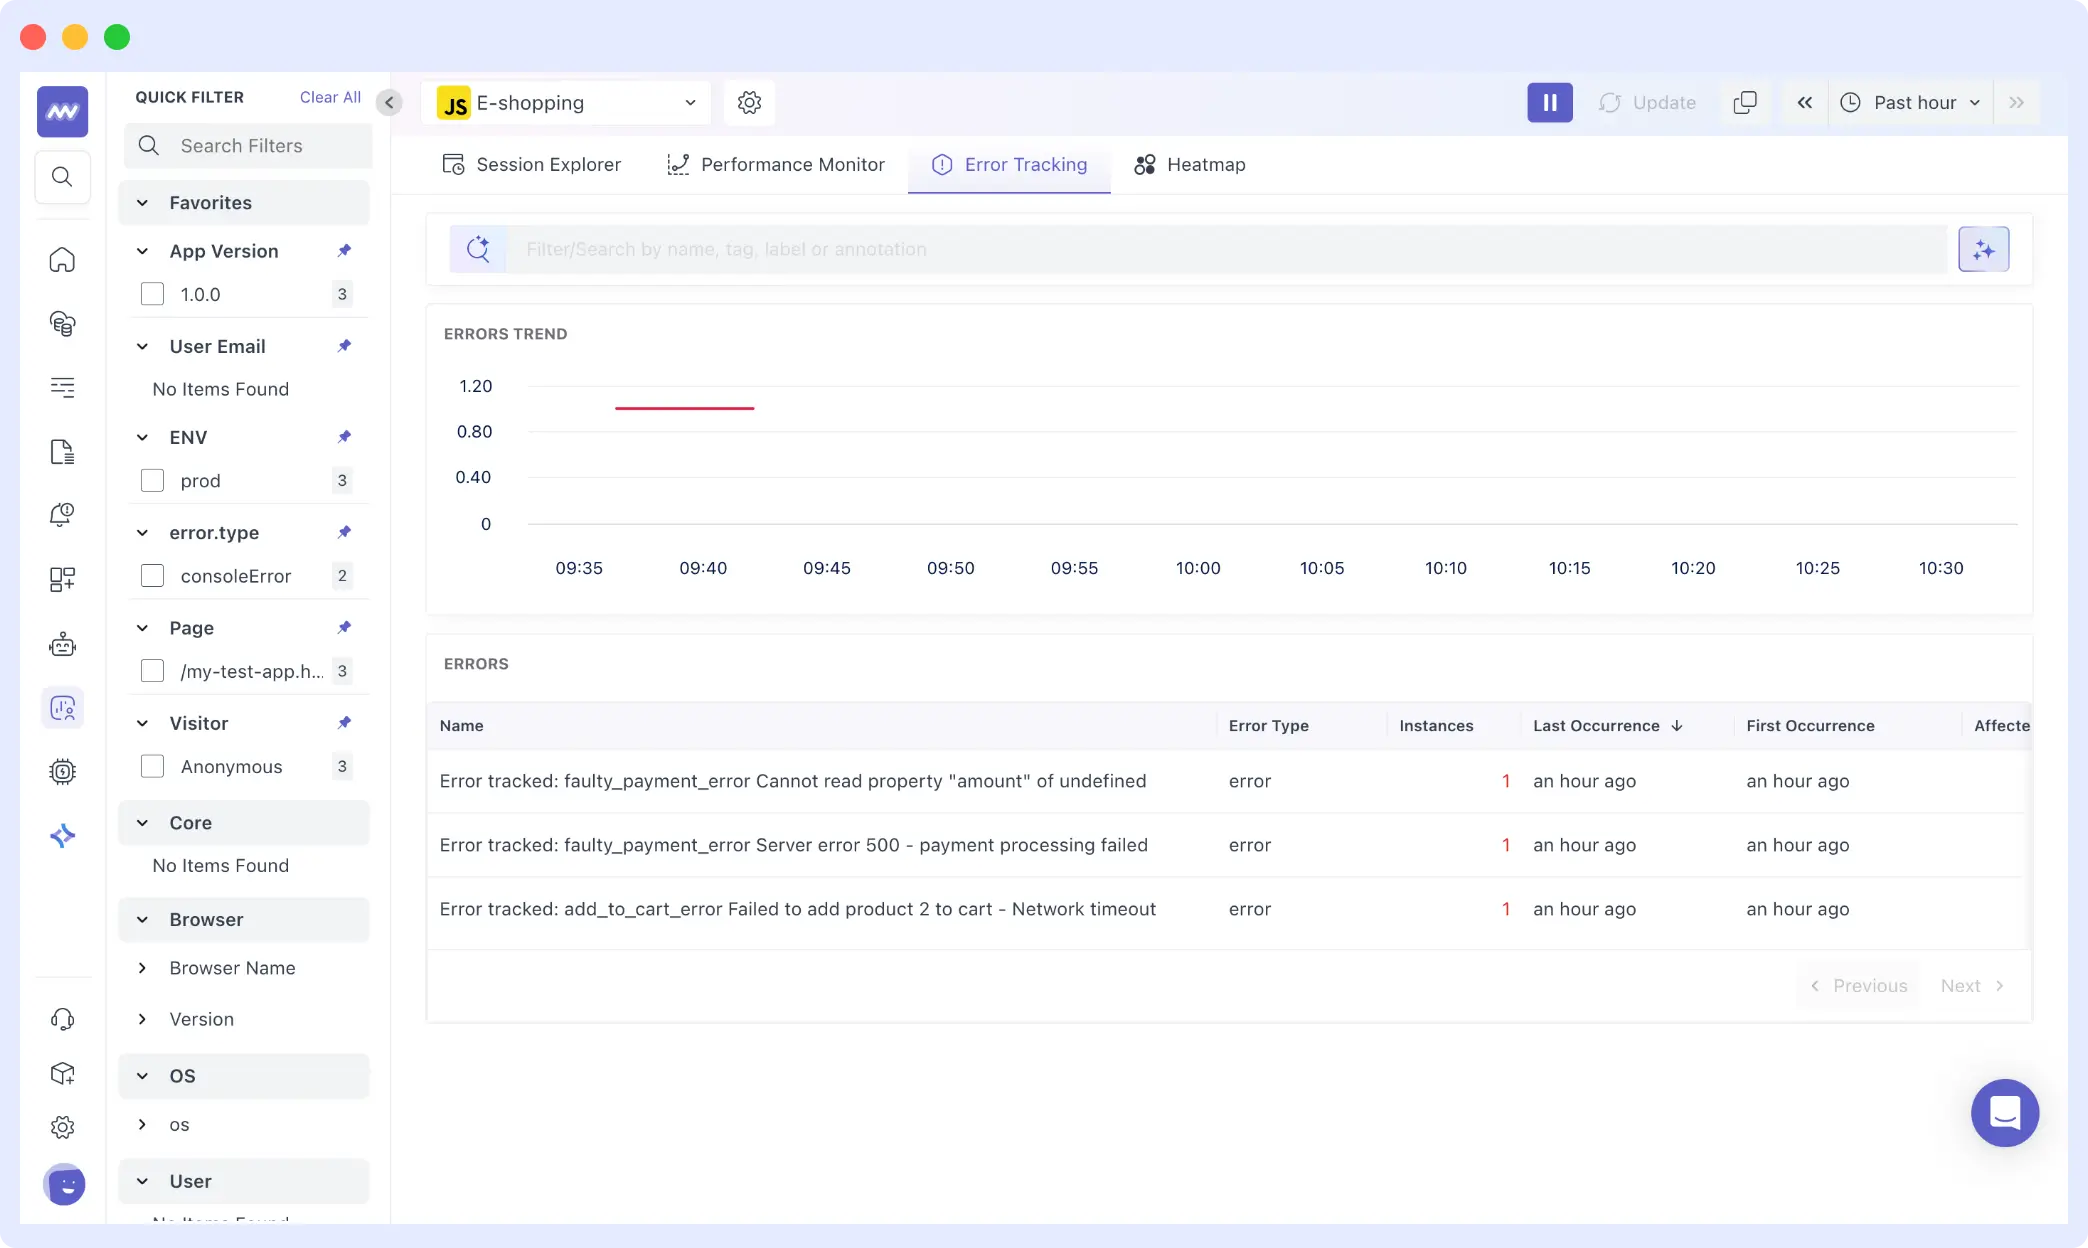
From the Error Tracking view, three distinct frontend errors surfaced across sessions:
faulty_payment_error: Cannot read property “amount” of undefinedfaulty_payment_error: Server error 500: payment processing failedadd_to_cart_error: Failed to add product 2 to cart: Network timeout
Each appears only once in isolation. In combination with session data, it becomes clear that even a small number of errors can produce disproportionate user frustration.
Error tracking helps you detect and debug frontend issues faster by grouping errors across real user sessions. 👉 Try Error Tracking now.
How session replay helps debugging
Numbers tell part of the story. Session replay debugging shows the rest.
To understand the impact of errors and frustration signals, we open the session with 11 frustration events. The replay displays the application exactly as the user saw it, with a chronological timeline of events alongside it.
From the timeline, we can trace the full journey: the user navigates between category filters “Electronics,” “Accessories,” and “All Products” browses multiple items, and attempts to add products to the cart several times. Some interactions succeed. Others fail silently.
The session lasts over four minutes and includes 17 separate actions. Rather than abandoning immediately after encountering an error, the user retries, switches categories, and continues browsing. The experience isn’t completely broken; it’s inconsistent.
This is the nuance that browser performance monitoring metrics miss entirely. A retry that eventually succeeds may appear as a normal conversion in high-level dashboards. Error counts may look negligible in percentage terms. But session replay shows the friction in context: repeated attempts, visible delay, and behavioral signals that indicate real disruption.
Session replay helps you see exactly what users experienced, including clicks, delays, and failed interactions. 👉 Try Session Replay now
To understand the full value of this approach, the Middleware guide to frontend monitoring covers how Replay integrates with error tracking and performance signals across the stack.
How to connect frontend metrics to backend performance
Session Replay shows that a user clicked a button and experienced a delay or failure. The next question is what caused it. This is where distributed tracing for the frontend becomes essential and where the real diagnostic power emerges.
From the session with 11 frustration events, we move into the Traces dashboard.
The trace view shows a list of spans generated by the application. Each row represents an instrumented interaction. Durations vary noticeably: some spans complete in under 100ms, others extend beyond 300ms.
At the top of the dashboard: out of 288 total spans, three carry an error status. That number appears small. But when those error spans are correlated back to the session we examined, they align precisely with the moments of visible friction in the replay.
The APM data confirms it’s not a uniform slowdown across all users. It’s a set of inconsistent interaction durations combined with a small number of errors that disproportionately affect specific sessions.
- Replay shows hesitation and retries
- Traces show the measurable execution time behind those moments
Instead of relying solely on average response time, you can point to individual spans that took longer than expected during the same session that recorded elevated frustration. That correlation turns a vague performance complaint into concrete, traceable evidence.
For teams exploring how to implement this type of frontend vs backend performance correlation, synthetic monitoring combined with RUM provides a complementary approach using controlled tests to establish baselines before real user data reveals deviations.
Connecting performance issues to user and business impact
When performance regressions occur, the difference between average and high-performing teams lies in their workflows. Teams that resolve issues quickly follow a structured approach that keeps user impact visible from the start. Teams that struggle often rely on disconnected signals and fragmented context.
How Do Top Engineering Teams Accelerate Frontend Performance Investigations?
The old way (hours to resolution)
- Frontend team sees an error spike in the observability tool
- Screenshots appear in Slack: “Users reporting slow checkout”
- Backend team checks APM: “Everything looks normal”
- Thirty minutes of back-and-forth trying to reproduce
- Logs are searched manually until the issue is finally located
By the time the root cause is found, the conversation thread is long, and the impact has already spread.
The correlated way (minutes to resolution)
- RUM identifies affected sessions automatically
- Session replay shows exactly what users experienced
- Distributed traces highlight the slow or failing service
- A single session link is shared across teams with full context
- Root cause is identified before the Slack thread escalates
Why is this approach critical for frontend, backend, and product teams?
Frontend teams:
- Stop getting blamed for backend issues you don’t control
- Prove user impact with concrete evidence, not assumptions
- Prioritize work based on real user frustration,
- Show exactly how many users were affected and which flows broke
For Backend teams:
- Receive issues with full reproduction context already attached
- See exactly which endpoints are user-facing vs. internal
- Understand performance requirements in terms of UX, not just SLOs
- Know which services to optimize based on actual user impact
Product/Business:
- Understand revenue impact of technical issues (lost transactions, cart value)
- Make data-driven prioritization decisions across teams
- Connect deployment changes to user behavior shifts
How does middleware facilitate this investigation model?
Middleware supports this full investigation model by pre-correlating real user monitoring, session replay, error tracking, and distributed tracing in a single platform.
Instead of stitching together context across separate tools, a RUM provider, a separate APM and a standalone error tracker, teams move from affected sessions to backend traces in a few clicks. That alignment across frontend, backend, and product teams shortens time to resolution and keeps user impact central to every decision.
When Is This Advanced Monitoring Approach Not Necessary?
You probably don’t need this if:
- Your app has <500 active users (manual investigation is faster)
- User flows are extremely simple (1-2 pages, no complex interactions)
- You’re a solo developer (context-switching cost is low)
- Budget constraints make multiple tools impractical
You definitely need this if:
- Complex user flows (multi-step checkouts, dashboards, SaaS onboarding)
- Distributed architecture (microservices, serverless)
- Multiple teams are debugging issues across the stack
- Revenue-impacting user journeys that need monitoring
Implementing frontend observability in your team
Every performance issue affects real users making real decisions. The gap between a metric spike and a root cause is where user trust erodes and where revenue leaks quietly.
The methodology in this guide filters by signals, prioritizes by impact, reconstructs via replay and traces to root cause, giving engineering and product teams a shared language for triaging performance issues based on what they actually cost users, not what they look like in dashboards.
Middleware helps you see exactly who encountered friction, how they responded, and what caused the disruption so you can fix what actually matters.
Start Free Trial | Read the Docs
FAQs
What are frontend performance metrics?
Frontend performance metrics measure how fast and smoothly a website behaves for users, including page load time, interaction latency, and visual stability. Core Web Vitals (LCP, FID/INP, CLS) are the most widely referenced set of frontend performance metrics in production monitoring today.
How much overhead does RUM add to my application?
Modern RUM SDKs add ~5-10KB gzipped and use sampling to minimize performance impact. For most apps, the overhead is <1% of total page load time.
What about user privacy with Session Replay?
Reputable RUM tools for web applications mask PII by default including credit card numbers, passwords, and email addresses. Always review privacy settings and ensure compliance with GDPR and CCPA before enabling session replay in production.
Can I use RUM with my existing APM tool?
Yes, if your APM supports OpenTelemetry or exposes a public API. The key is correlating session IDs across tools so that frontend interactions map to backend spans. This is what enables true frontend vs backend performance debugging.
How long should I retain session replay data?
Industry standard is 30 days for general compliance. High-value sessions, those containing errors, abandoned checkouts, or key conversions, can be flagged for longer retention and reviewed during incident postmortems.
What's the difference between RUM and traditional error tracking?
Traditional error tracking shows what broke. Correlated real user monitoring shows who was affected, how they experienced it, and why it happened by linking errors to session context and backend traces. This is what makes the shift from reactive alerting to proactive user experience monitoring possible.
Why do users abandon cart without errors?
This is one of the most common patterns in frontend performance monitoring: invisible friction. A request that times out silently, an interaction that freezes without error messaging, or cumulative latency across a multi-step flow, none of these produce an explicit error, but all of them degrade user experience and drive abandonment. Session replay is the most effective way to surface this class of problem.
Do I need to instrument every user interaction?
No. Start with critical user journeys (checkout, signup, key features). You can expand coverage over time based on priorities.