Summary: Jaeger tracing is an open-source distributed tracing system that helps track requests as they move across multiple services. It collects trace data through OpenTelemetry, stores it in a supported backend, and provides a UI for searching and visualizing traces. Jaeger tracing helps engineers identify latency issues, service failures, and performance bottlenecks in distributed systems. The current version, Jaeger v2, runs on the OpenTelemetry Collector framework, accepts OTLP data directly, and supports sampling strategies for managing trace volume.
TL;DR
- Jaeger tracing shows the path a request takes through your services, how long each step took, and where failure occurred.
- It collects trace data through OpenTelemetry, stores it in a backend like Cassandra, Elasticsearch, or ClickHouse, and visualizes it in the Jaeger UI.
- Jaeger v2 runs on the OpenTelemetry Collector framework and accepts OTLP data directly.
- You can run Jaeger v2 locally in a single Docker container for testing, then move to external storage and split components for production.
- Sampling controls trace volume through three approaches: head-based for simple setups, tail-based for capturing slow or failed requests, and adaptive for production workloads.
- Jaeger tracing only handles tracing. You still need separate tools for logs and metrics, and there is no built-in alerting.
- If you are running Jaeger v1, it reached end-of-life on December 31, 2025 and you need to plan a migration to v2.
- Teams that want traces, logs, metrics, and alerting in a single platform often use observability platforms like Middleware instead of managing multiple tools separately.
What is Jaeger tracing?
Jaeger tracing is an open-source distributed tracing system that follows a single request as it moves through your services and shows you a timeline of where it spent time and where it failed. Your services generate trace data through OpenTelemetry, Jaeger collects and stores it, and the Jaeger UI lets you search and visualize the data.
Unlike full observability platforms, Jaeger focuses only on distributed tracing. This focus keeps it lightweight and predictable, but it also means you need separate tools for logs and metrics.
It is not the only distributed tracing tool available. Other open-source options include Zipkin and Grafana Tempo, while full observability platforms like Middleware, Datadog, and New Relic combine tracing with logs, metrics, and alerting.
The current version, Jaeger v2 (also called Jaeger 2.0), runs on the OpenTelemetry Collector framework and accepts OTLP data directly. You instrument your services once with OpenTelemetry and can swap backends later without changing your code.
What are the key features of Jaeger tracing?
Jaeger tracing includes features for collecting, storing, searching, and visualizing distributed traces. It also supports multiple sampling strategies, flexible storage backends, service dependency mapping, and performance monitoring, and is open source under Apache 2.0.
- OpenTelemetry-native ingestion: Jaeger accepts trace data sent over OTLP, with no translation layer in between. This is the default in v2 and simplifies integration with OpenTelemetry-based environments.
- Multiple sampling strategies: Head-based sampling (constant, probabilistic, and rate-limiting) covers simple setups. Adaptive and tail-based sampling give you control over what gets stored in production.
- Flexible storage: It supports Cassandra, Elasticsearch, OpenSearch, Badger, and ClickHouse. You can also place Kafka in between to handle traffic spikes before traces are written to storage.
- Trace search and visualization: The UI lets you filter traces by service, operation, tags, duration, and time range. From there, you can open a waterfall view that shows timing, errors, and metadata for every span.
- Service dependency graph: Jaeger draws a live map of how your services call each other, using your actual trace data. You see the real shape of your system instead of an outdated architecture diagram.
- Service Performance Monitoring (SPM): Jaeger turns span data into RED metrics (request rate, error rate, and duration). You can view them in the Monitor tab. To make this work, you need the SpanMetrics Connector to build the metrics and a Prometheus-compatible store like Prometheus or Mimir to hold them.
- Open source under Apache 2.0: Free to use, with trace data in open formats. You are not tied to one vendor.
How do you run Jaeger locally?
The fastest way to try Jaeger is to run it in a Docker container. The command below starts Jaeger v2 with the collector, query service (which serves the UI), and in-memory storage all bundled into one container. This setup is meant for local testing, not production, because data is lost when the container stops.
docker run --rm --name jaeger \
  -p 16686:16686 \
  -p 4317:4317 \
  -p 4318:4318 \
  -p 5778:5778 \
  -p 9411:9411 \
  jaegertracing/jaeger:2.18.0
Once it is running, open http://localhost:16686 in your browser to load the Jaeger UI. Your services can send traces to the container over OTLP on port 4317 (gRPC) or port 4318 (HTTP).
For production deployments, you will want external storage (Cassandra, Elasticsearch, OpenSearch, ClickHouse, or Badger) and a split between the collector and query service. The official Jaeger documentation covers the configuration in detail.
How does Jaeger tracing work?
Jaeger works in four steps: a service starts a trace; every service along the way records a span; the spans are sent to Jaeger over OTLP; and you open the UI to see the full trace.
- A request creates a trace ID and root span: When a request first comes in, the service that receives it creates a trace ID and a root span. A span is a single unit of work in one service, like a database query or an API call. It has a name, a start time, a duration, and tags that describe what happened. The root span is the first span in the chain, representing the work the entry-point service is about to do.
- Each service records its own span and passes the trace context: As the request moves through your stack, every service it touches creates its own span and passes the trace context to the next service it calls. The trace context carries the trace ID and the current span ID, so each downstream service knows which trace it belongs to and which span called it.
- Spans are sent to Jaeger over OTLP: When each service finishes its work, it sends its completed spans to Jaeger via OTLP (OpenTelemetry Protocol). Jaeger groups every span that shares the same trace ID into a single trace. A trace is the complete record of one request as it moves through your system. If a checkout request touches eight services, the trace contains eight linked spans.
- You open the Jaeger UI to view the trace: Jaeger shows you a waterfall timeline of where the request spent its time, which service did what, and where anything failed.
How does Jaeger handle sampling?
Jaeger handles sampling through three approaches: head-based, tail-based, and adaptive. Each one decides differently which traces to keep and which to drop.
Sampling matters because recording every request at scale quickly becomes expensive. A busy system can generate millions of spans per minute, and storing them all requires additional storage and compute resources.
| Approach | When it decides | Best for | Trade-off |
| Head-based | At the start of a request | Simple setups, low overhead | Blind to what happens later in the request |
| Tail-based | After a request finishes | Capturing slow or failed requests | Higher memory and compute cost |
| Adaptive | Based on traffic patterns | Production workloads at scale | More complex to configure |
Note: Head-based sampling decides whether to record a trace before the request finishes. If a slow or failed request is dropped, Jaeger cannot recover that trace later.
When head-based sampling drops a trace, your request still runs normally. The only thing lost is the trace data. This is why most teams start with head-based sampling at a low rate and move to adaptive or tail-based sampling as their system grows.
Jaeger tracing architecture
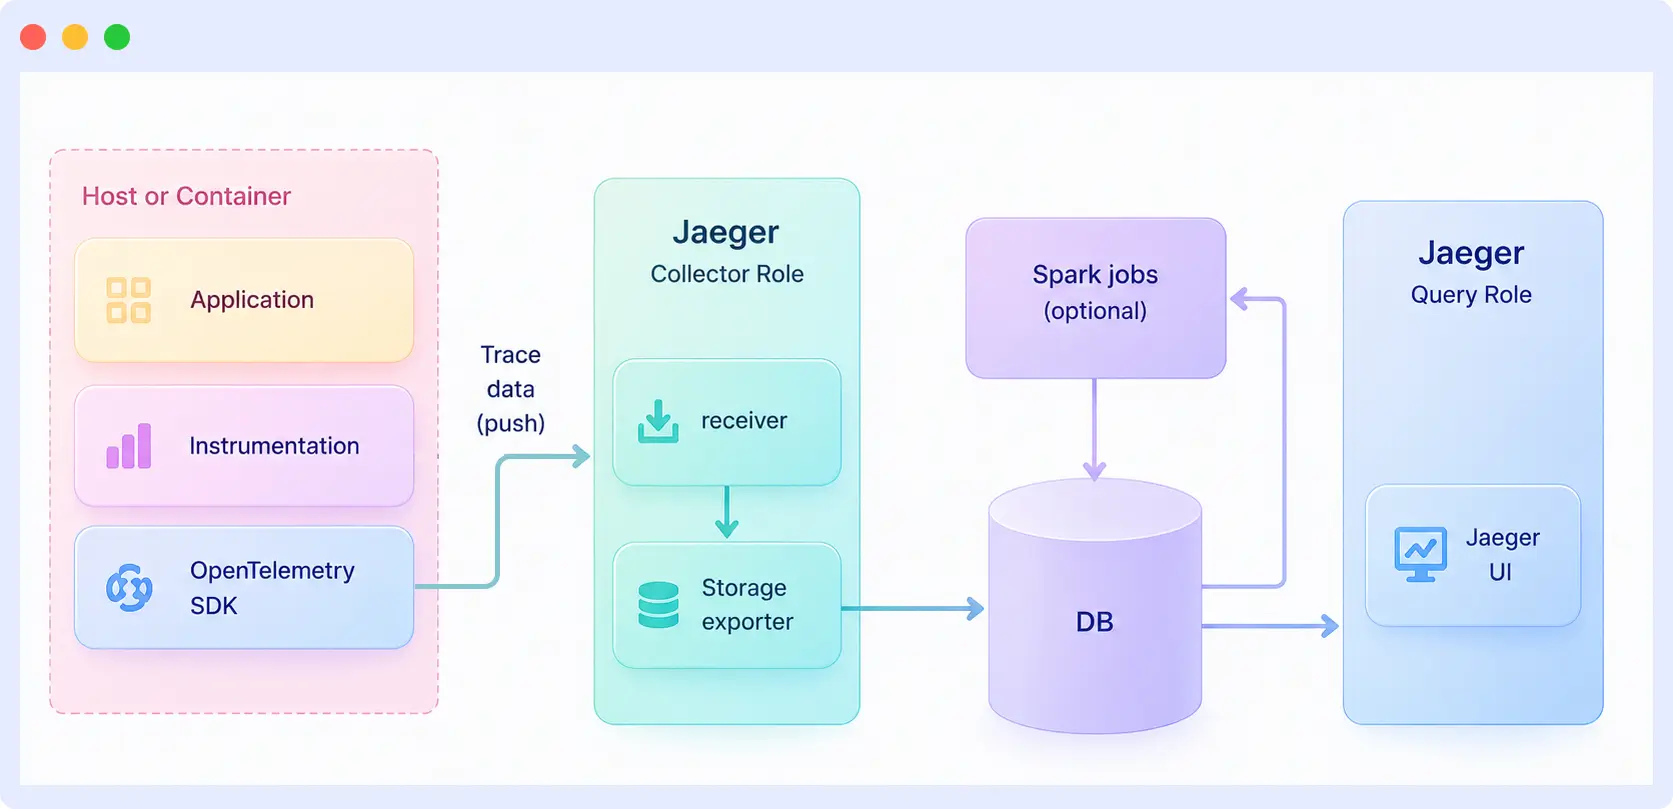
The Jaeger tracing architecture consists of five main components: instrumentation, the collector, storage, the query service, and the UI. Each component has a specific job, and together they handle the full path of trace data from your application to the interface where you investigate traces.
| Component | Role |
| Instrumentation (OpenTelemetry SDKs) | Lives inside your application and generates spans as the code runs. Not part of Jaeger itself, but the source of every trace. |
| Collector | Receives spans from your services, validates them, applies sampling rules, and writes them to storage. In Jaeger v2, the collector runs inside the main Jaeger binary on the OpenTelemetry Collector framework. |
| Storage | Holds the spans on disk. Jaeger supports Cassandra, Elasticsearch, OpenSearch, ClickHouse, and Badger, with in-memory storage for local testing. |
| Query service | Reads spans from storage when someone searches for a trace and returns them to the UI. |
| UI | The web interface where you search for traces, open them, and view the waterfall timeline. |
What is the difference between the OTel Collector and the Jaeger Collector?
The Jaeger Collector and the OpenTelemetry Collector are two different components, even though their names look similar.
- Jaeger Collector: Receives spans, processes them, and writes them to storage. Built into the Jaeger binary.
- OpenTelemetry Collector: A separate component from the OpenTelemetry project that receives traces, metrics, and logs and sends them to one or more backends.
You do not need the OpenTelemetry Collector to run Jaeger. Your services can send spans directly to the Jaeger Collector over OTLP. Add an OpenTelemetry Collector only if you need to filter or modify trace data before it reaches Jaeger, or if you are collecting metrics and logs alongside traces.
How does data flow through Jaeger?
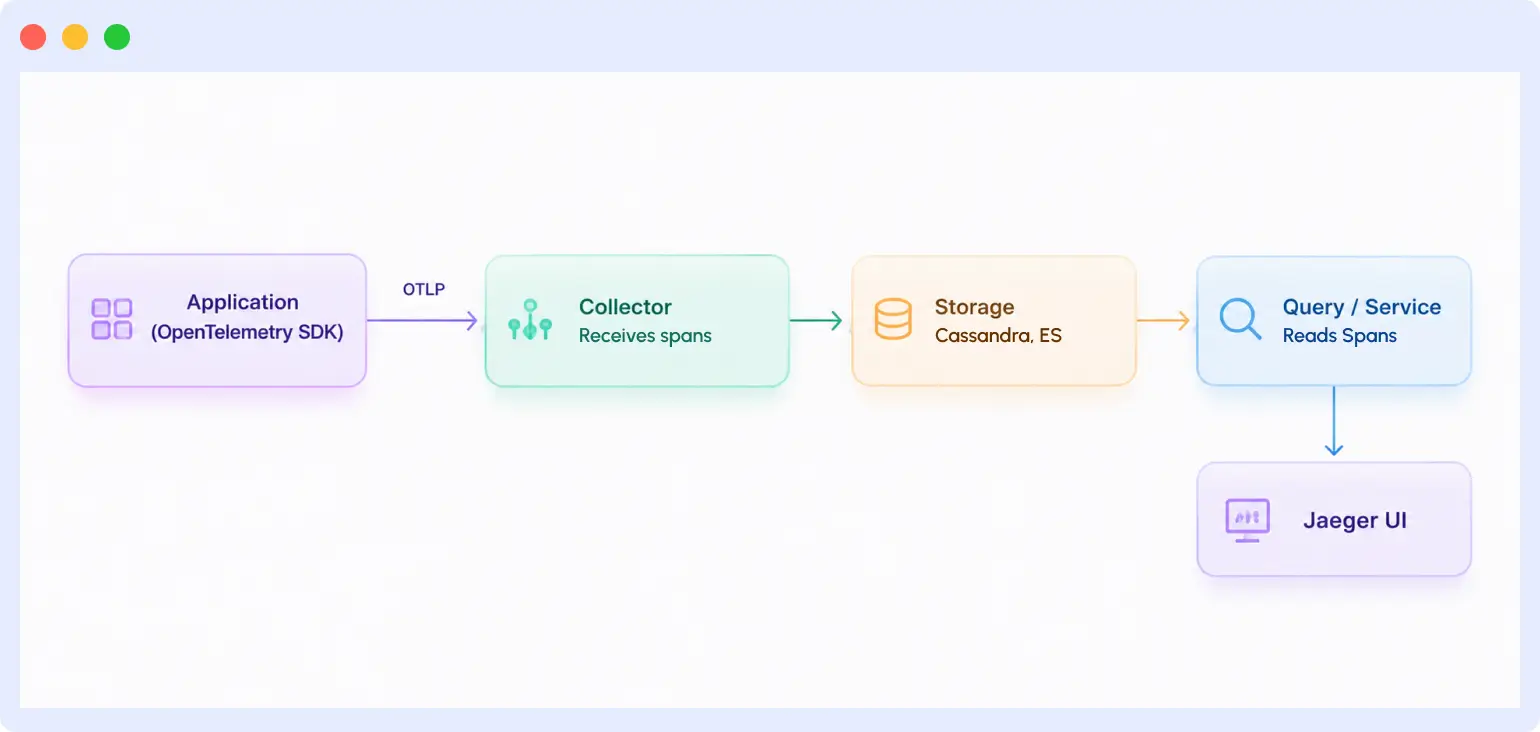
Your application emits spans through the OpenTelemetry SDK and sends them to the collector over OTLP. The collector writes the spans to your storage backend. When you open the Jaeger UI and search for a trace, the query service pulls the matching spans from storage, and the UI assembles them into a waterfall view.
Deployment modes
Jaeger has three deployment modes: all-in-one for local testing, production for standard deployments, and with a Kafka buffer for very large-scale workloads. Each mode handles components and storage differently.
- All-in-one: Every component runs in a single process with in-memory storage. Use this for local development, demos, and testing. Data is lost when the process restarts.
- Production: The collector, query service, and UI run as separate workloads, backed by a real storage system like Cassandra, Elasticsearch, OpenSearch, or ClickHouse. This is the standard setup for production workloads.
- With Kafka buffer: A Kafka queue sits between the collector and storage. The collector writes spans to Kafka, and a separate ingester reads from Kafka and writes to storage. It is used at a very large scale to absorb traffic spikes and decouple ingestion from storage.
Managed via Middleware: Send OTLP spans to Middleware’s ingestion endpoint. No collector, storage, or query service to operate. Traces appear alongside logs and metrics in the Middleware UI.
What ports does Jaeger use?
When you run Jaeger v2, these are the default ports it uses. You will need to expose or open them, depending on your setup.
| Port | Protocol | Purpose |
| 4317 | gRPC | OTLP trace ingestion (most common) |
| 4318 | HTTP | OTLP trace ingestion |
| 5778 | HTTP | Remote sampling configuration |
| 9411 | HTTP | Zipkin-format trace ingestion |
| 16685 | gRPC | Query service for reading traces |
| 16686 | HTTP | Jaeger UI and HTTP query API |
For the full list, including legacy and internal ports, see the Jaeger APIs documentation.
What is inside the Jaeger UI?
The Jaeger UI is a web interface where you search for traces, open them, and inspect what happened inside your services. It runs on port 16686 by default and gives you three main views: a search screen, a trace timeline, and a monitoring tab.
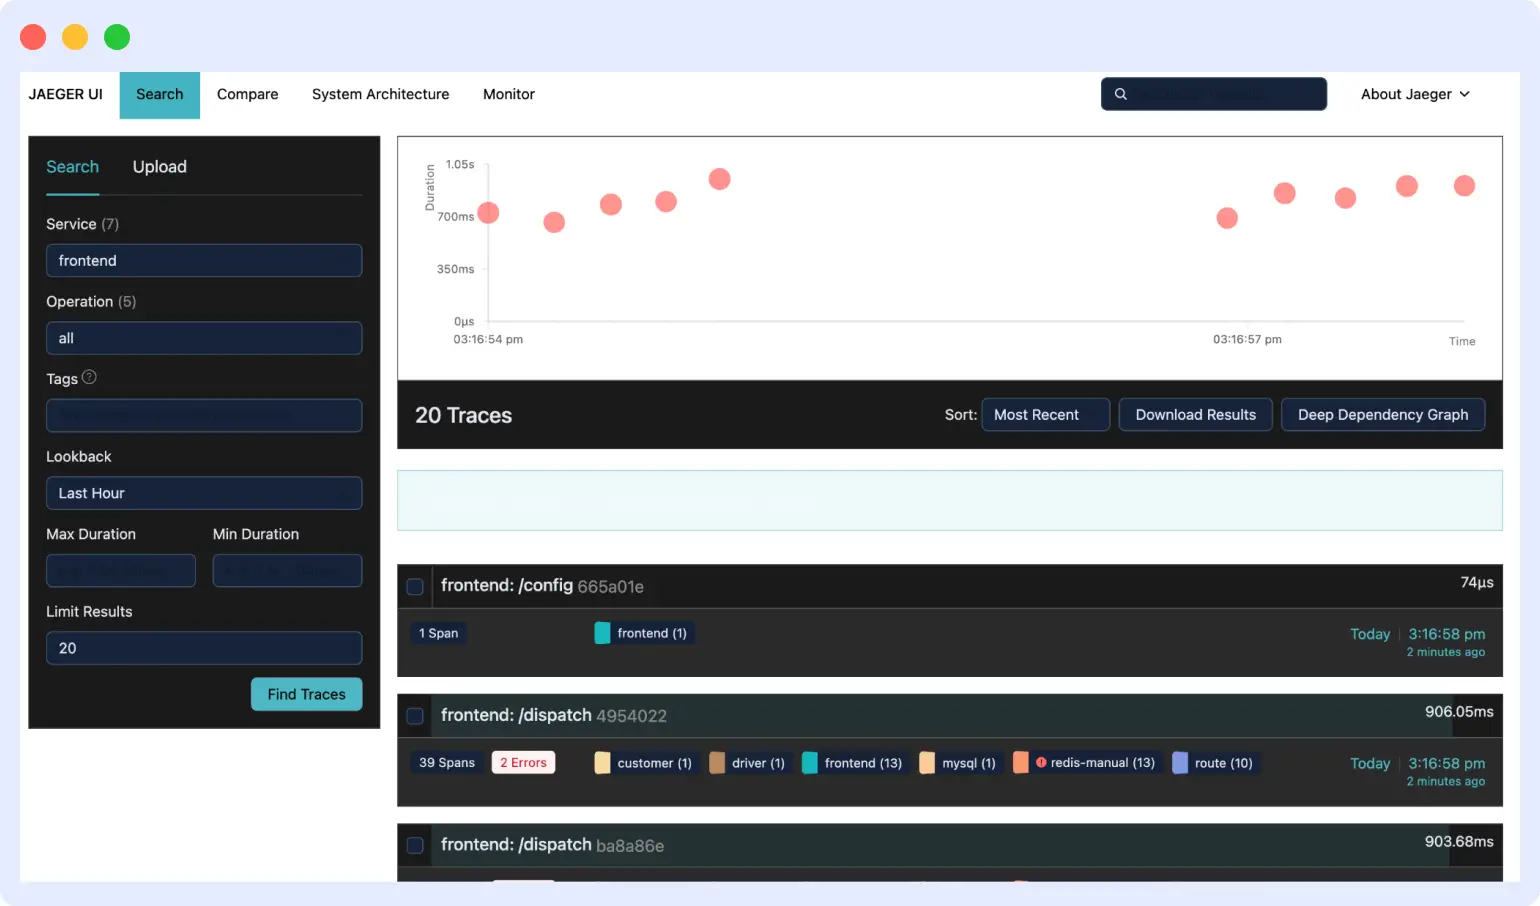
Jaeger traces the list
The traces list is the search screen you land on when you open Jaeger. It lets you find specific traces out of the millions your system produces. You filter by service, operation, tags, duration, time range, and number of traces to return. The results panel shows each matching trace with its total duration, the number of services it touched, and the number of spans it contains.
Jaeger trace view
The trace view is where debugging happens. When you click a trace from the search results, Jaeger opens it as a waterfall timeline. Each span is a horizontal bar, time runs left to right, and nested calls appear indented under their parent. You can quickly see which service took the most time and where errors happened.
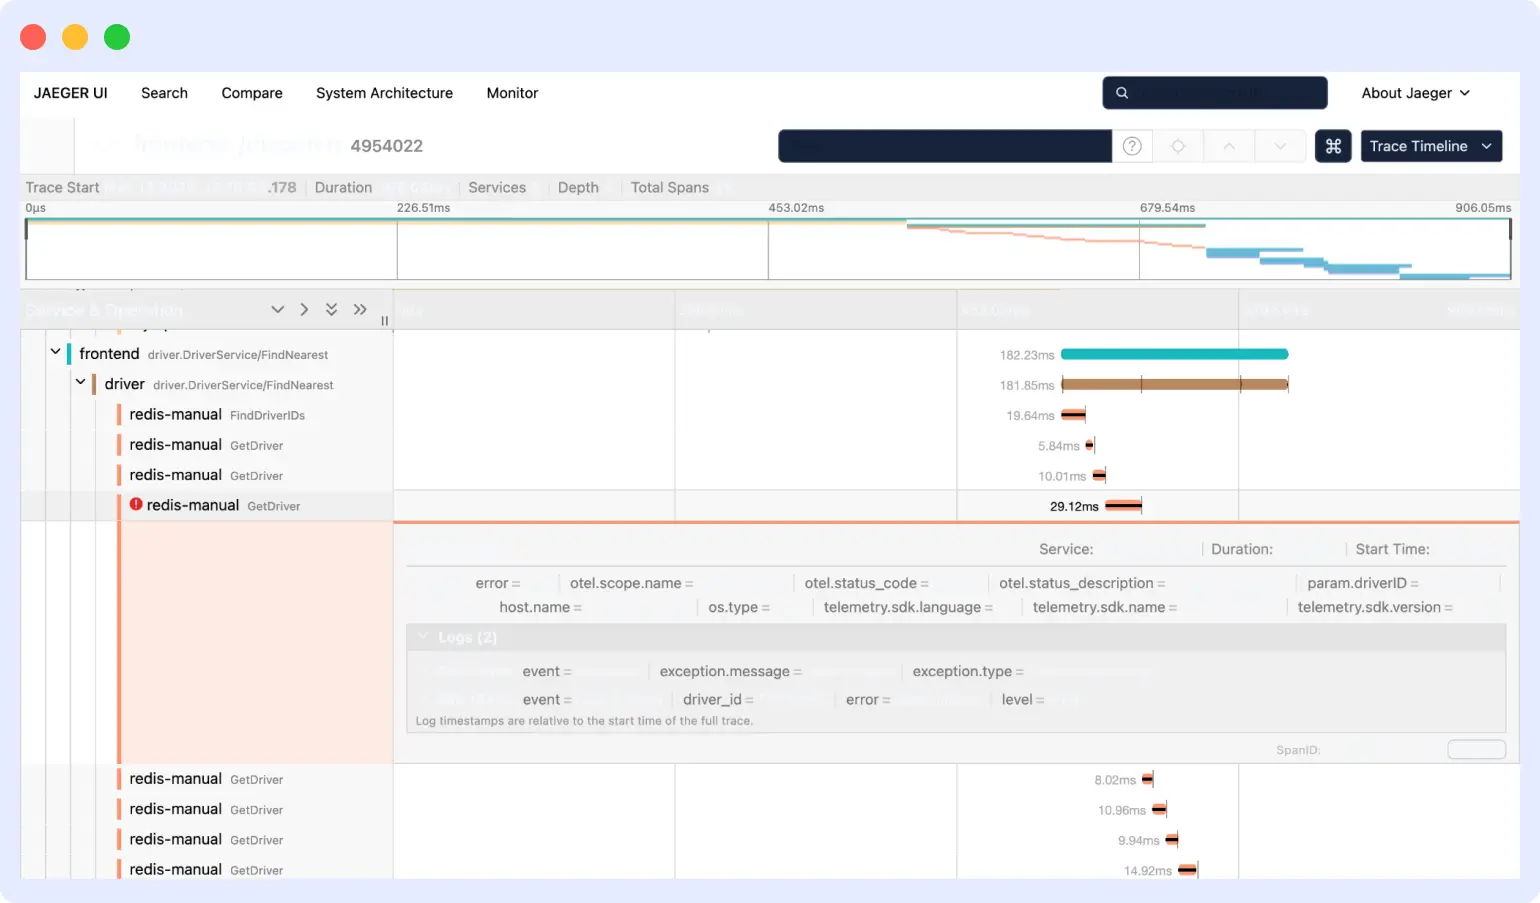
Click any span to expand it. The detail panel shows the span’s tags, logs, process information, and timing breakdown. This is where you find the specific reason a request was slow or failed.
The attributes you see on each span come from how your services were instrumented. If different teams use different names for the same thing, traces become harder to read once they cross team boundaries. One service might label a database call as db.name, another as database, another as db_name.
The OpenTelemetry project solves this with semantic conventions, a shared set of attribute names for common operations like HTTP requests, database calls, and messaging. Following them is optional, but in larger organizations they save hours when you are debugging a trace that touches services owned by other teams.
Jaeger service monitoring
The Monitor tab shows RED metrics (request rate, error rate, and duration) for each service, derived from your span data. You see service-level graphs at the top and operation-level breakdowns underneath. This helps you spot slow endpoints and error spikes without opening individual traces.
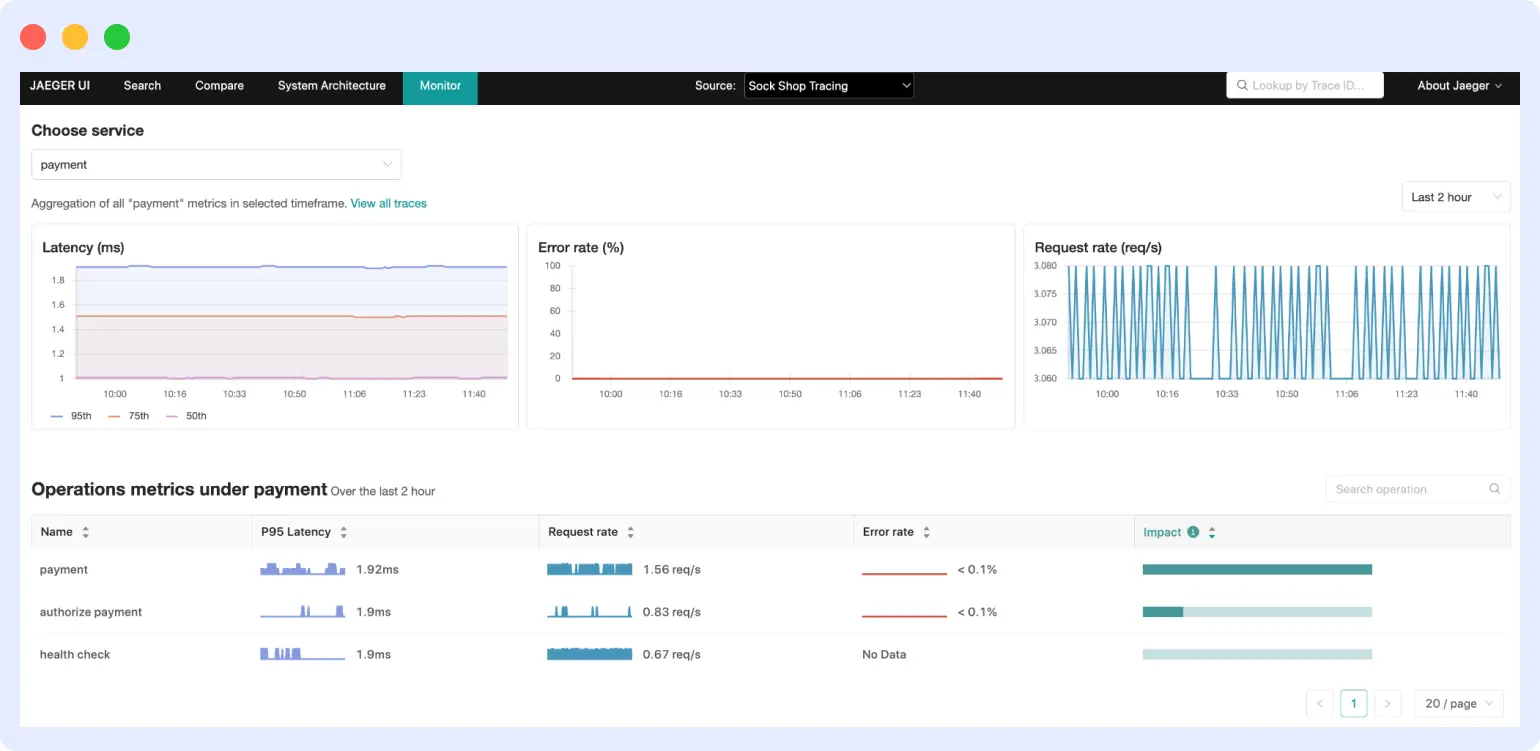
This view requires the SpanMetrics Connector to generate metrics and a Prometheus-compatible store, such as Prometheus or Mimir, to hold them.
What Jaeger UI doesn’t show you
The Jaeger UI gives you trace data and RED metrics derived from spans. It does not show you the log lines from a failing request, infrastructure metrics from the host that served it, or alerts when latency crosses a threshold. During an incident, this means pivoting between Jaeger, your logging tool, and your metrics platform to build a complete picture.
Middleware shows traces, correlated logs, and infrastructure metrics in a single view. When a span shows high latency, you can see the log output from that exact request and the CPU and memory state of the pod that handled it all without leaving the trace view.
When should you use Jaeger?
Use Jaeger when you run multiple services and need to see how a single request moves across them. It is the right tool when logs and dashboards alone cannot tell you where a request slowed down or which service caused a failure. Avoid it when you need logs, metrics, or alerting, because Jaeger does not handle any of those on its own.
Use Jaeger when:
- You need to debug slow requests across services: Open Jaeger, search for the trace, and see which span took the longest. The waterfall view shows whether the delay was in a database query, a downstream service, or the network between them.
- You need to find bottlenecks: Traces over time show which services or operations are consistently the slowest. This supports capacity planning and helps you decide what to optimize or refactor.
- You need to map service dependencies: Jaeger builds a dependency graph from real traffic, which is useful when documentation is out of date, when you join a new team, or when you are planning a migration.
- You need to run root cause analysis in microservices: Traces show the chain of calls that led to a failure. You can see which service started failing, what it was called with, and what called it.
- You need to validate performance after a deployment: Use traces to confirm a release did not introduce latency regressions. The Monitor tab shows changes in request rate, error rate, and duration for each service.
Do not use Jaeger when:
- You run a monolith: A single application does not benefit much from distributed tracing. A standard application monitoring tool is often enough.
- You want unified observability: If you need traces, logs, metrics, and alerting in one place, a full platform like Middleware, Datadog, or New Relic is a better starting point.
- You cannot self-host: Running Jaeger in production means managing the collector, query service, UI, and storage backend. Without platform engineering capacity, a managed observability platform is usually simpler.
Who uses Jaeger?
Jaeger is commonly used by engineers in three main roles:
- Backend developers use Jaeger to debug the services they own and understand how their code behaves under real traffic.
- Site Reliability Engineers (SREs) use it during incidents to identify failure causes and track service health over time.
- Platform engineers run Jaeger as part of the broader observability stack their organization depends on.
What tools does Jaeger work with?
Jaeger tracing works with OpenTelemetry SDKs for instrumentation, Docker and Kubernetes for deployments, and service meshes like Istio, Envoy, and Linkerd. It also integrates with API gateways such as Kong and NGINX and with message queues that support trace context propagation.
| Category | Supported tools |
| Instrumentation | OpenTelemetry SDKs (Java, Python, Go, Node.js, .NET, and other major languages), auto-instrumentation agents |
| Deployment | Docker images, Helm charts, Kubernetes via the OpenTelemetry Operator |
| Service mesh | Istio, Envoy, Linkerd |
| API gateways | Kong, NGINX |
| Message queues | Any queue that supports trace context propagation |
| Full observability platforms | Middleware (accepts OTLP traces natively, adds logs, metrics, alerting, and OpsAI) |
How do you migrate from Jaeger v1 to v2?
Migrating from Jaeger v1 to v2 involves three steps: updating your configuration, switching your deployment operator, and pointing your services at the new collector. The official Jaeger migration guide walks through each step in detail.
- Update your configuration to the new v2 format. The configuration model changed when Jaeger moved to the OpenTelemetry Collector framework.
- Switch your deployment from the Jaeger Operator to the OpenTelemetry Operator. The OTel Operator handles v2 deployments on Kubernetes.
- Point your services to send spans directly to the v2 collector over OTLP. Jaeger v2 no longer uses the standalone agent from v1.
Important: Jaeger v1 reached end-of-life on December 31, 2025 and no longer receives updates, including security patches. New deployments should use Jaeger v2, and existing installations should plan a migration.
What are the limitations of Jaeger?
Jaeger does one job well, but that focus comes with limits. Knowing them up front helps you decide whether Jaeger alone is enough or whether you will need to use it with other tools.
1. It only handles traces
Jaeger collects and visualizes trace data. It does not handle logs or metrics. SPM gives you RED metrics derived from spans, but that is a view on top of trace data, not a full metrics system. For complete observability, you still need a metrics tool like Prometheus and a logs tool like Loki or Elasticsearch, and then connect them yourself.
Middleware unifies all three signals natively. Traces are correlated with logs and metrics at ingest, so the connection is automatic rather than something you wire together through dashboards and query languages.
2. Self-hosting takes real work
Running Jaeger in production means running the collector, the query service, the UI, and a storage system. All of those need monitoring, upgrades, scaling, and security patches. For a small team without a dedicated platform engineer, this is steady operational overhead that adds up over time.
Middleware removes this entirely. There is no storage backend to provision, no collector to version-manage, and no query service to scale. You point your OTLP exporters at Middleware’s endpoint, and the infrastructure is handled.
3. The UI covers the basics
The Jaeger UI is functional, and the waterfall view is useful for debugging. What it does not offer is the depth that commercial platforms like Middleware provide, such as built-in alerts, anomaly detection, saved searches, customizable dashboards, and AI-assisted root cause analysis. If your team needs those features, you will either build them yourself or move to a tool that includes them.
4. Storage backends need their own expertise
Cassandra and Elasticsearch are the most common production storage backends for Jaeger, and both are complex systems to operate. They need tuning, capacity planning, backups, and someone who understands how they fail. Trace volumes also grow fast, so storage costs and operational load scale with your traffic.
5. No built-in alerting
Jaeger shows you what happened, but it will not tell you when something is wrong. There is no way to set a latency threshold and get paged when it is breached. You would need to set up alerting through Prometheus using SPM metrics or through another monitoring system that watches your traces from the outside.
These limitations are why some teams pair Jaeger with other tools, and others move to a full observability platform. Middleware handles traces, logs, and metrics in one place. It has built-in alerting and no self-hosting overhead, which removes most of the gaps covered above.
Running distributed tracing without the Jaeger overhead
Jaeger solves the right problem: visibility into how requests move through your services. The operational cost of running it in production is real: storage backends to manage, a collector to scale, and no built-in path to logs, metrics, or alerting.
Middleware gives engineering teams the same distributed tracing visibility, along with correlated logs and infrastructure metrics, in a single interface. OpsAI automatically surfaces root cause analysis during incidents, reducing the manual trace-digging that Jaeger requires.
Middleware accepts OTLP trace data natively, so any service instrumented for Jaeger sends traces to Middleware without any instrumentation changes.
FAQs
What is Jaeger tracing?
Jaeger tracing is an open-source distributed tracing system that follows a single request as it moves through your services and shows you a timeline of where it spent time and where it failed.
Is Jaeger free?
Yes. Jaeger is open source under the Apache 2.0 license. You can run it without paying for the software, though you will still pay for the infrastructure it runs on (servers, storage, and engineer time to maintain it).
Is Jaeger still maintained?
Yes. Jaeger is an actively maintained CNCF project, with regular releases and a public roadmap. Jaeger v2 launched on November 12, 2024 and rebuilt the system on the OpenTelemetry Collector framework.
Is Jaeger an APM tool?
No. APM tools handle metrics, logs, traces, alerting, and dashboards in one platform. Jaeger only handles traces. You can use it as part of an APM stack, but it is not one on its own.
Can Jaeger handle logs and metrics?
No. Jaeger is a tracing tool. Its SPM feature derives RED metrics from span data, but that is an aggregation view, not full metrics support. For logs and metrics, you need separate tools like Prometheus, Loki, or Elasticsearch.
How does Jaeger work with OpenTelemetry?
OpenTelemetry provides the SDKs that instrument your code and generate spans. Jaeger receives those spans, stores them, and lets you visualize them. Jaeger’s own client libraries were deprecated, so a modern Jaeger setup uses OpenTelemetry SDKs in your services and Jaeger as the backend.
What is a good alternative to Jaeger?
Common alternatives include Zipkin (another open source tracer), Grafana Tempo (open source, optimized for cheap storage), and full observability platforms like Middleware, Datadog, and New Relic that handle traces alongside logs and metrics.
Does Jaeger support Kubernetes?
Yes. Jaeger v2 deploys on Kubernetes via Helm charts or the OpenTelemetry Operator. For v2, the OTel Operator is the recommended approach and manages collector configuration through a CRD. The Jaeger Operator from v1 is no longer the primary deployment method.
What storage backend should I use with Jaeger in production?
Elasticsearch and OpenSearch are the most common production choices because they support full-text search on span tags and attributes and scale horizontally. Cassandra handles write-heavy workloads better but offers less flexible querying. ClickHouse is increasingly used for its compression and query performance at lower storage cost. Badger is suitable only for development and single-node testing.
Is Jaeger v1 still supported?
No. Jaeger v1 reached end-of-life on December 31, 2025 and no longer receives security patches or updates. All new deployments should use Jaeger v2, which is rebuilt on the OpenTelemetry Collector framework and accepts OTLP data natively.


