In part1, we covered how Middleware helps engineering teams new to OpenTelemetry achieve full infrastructure and application coverage in hours rather than weeks through auto-discovery, zero-code instrumentation, and UI-based collector configuration.
In this blog post, I will be going to discuss about platform teams who are already using OpenTelemetry setup in their infrastructure and applications. What value do we add for this set of engineering teams ?
TL;DR
- Raw OpenTelemetry data metrics, traces, logs only becomes useful when it is stored, correlated, and surfaced in context.
- Middleware acts as an OpenTelemetry-native backend that correlates signals across infrastructure, APM, and database layers automatically.
- A CPU spike that looks like a scaling problem is often a database bloat issue. Middleware’s drill-down path surfaces this without requiring manual investigation.
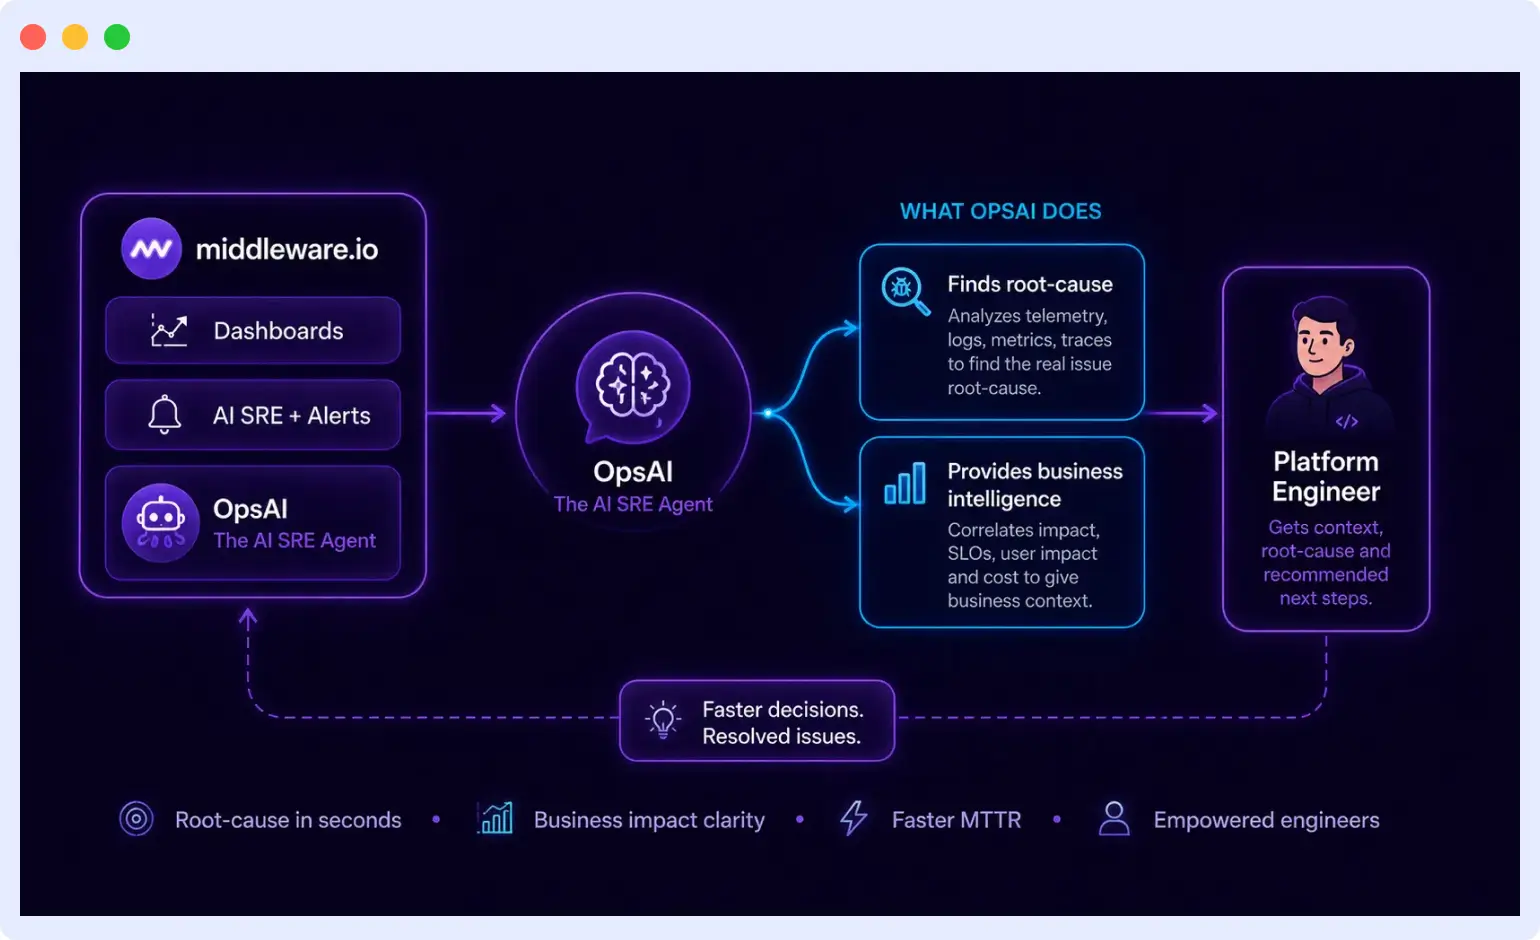
- OpsAI, Middleware’s AI SRE agent, reads your full telemetry context and connects the dots across signals so you can ask “why is my CPU spiking?” and get a root cause, not a list of metrics.
What you should expect from an observability backend
Instrumenting your setup and generating data for Observability is a good start. Next important step is to make business intelligence out of it.
If you are using any Observability backend tool, you should expect the tool to help you with these kinds of questions.
- Am I under-utilizing OR over-utilizing my resources e.g. CPU / Memory / Network / Disk ?
- Under Utilization can lead to unnecessary cost
- Over Utilization can lead to a downtime any moment !
- If my API which usually takes 4–5s, suddenly starts taking 15s, which service is the culprit ? Is it related to a recent deployment that I made ?
- Is there any bloating in my database ? Do I need to create new indexes ? How my existing DB indexes are performing ?
- I have recently started using Claude Fable APIs in my product, Is my token usage under control ?
- Can I get a notification when my docker container goes down on my Slack ?
- I want to get a list of Top 10 customers who are visiting my product the most.
The Observability data originally is bunch of metrics, traces and logs. However,
If we look at the right set of information …
Correlate them well with other signals & …
Observe the patterns over time …
It can help you answer the questions mentioned above.
From raw metric to actionable insight: a resource utilization example
Let us understand by diving into 1st example.
Am I under-utilizing OR over-utilizing my resources e.g. CPU / Memory / Network / Disk ?
The OpenTelemetry Collector will give you system.cpu.utilization with CPU percentage and timestamp per host.
e.g.
12:00:05 -> 34%
12:00:10 -> 48%
12:00:15 -> 39%
and so on ……
If your otel-config.yaml configuration is configured correctly, this is already broken down by host.name.
But a single data point is not useful on its own. To draw a meaningful conclusion about under-utilization or over-utilization, you need:
- Enough historical data to account for business cycle variation, a ticketing platform will have different weekend patterns than a B2B SaaS.
- Aggregated views (daily, weekly, or hourly averages) that smooth out spikes and reveal true baselines.
With that context in place, the thresholds become clear. CPU consistently sitting at 15–20% across multiple days signals that you are paying for capacity you are not using a candidate for downscaling. CPU holding at 85–90% is a bottleneck in the making a signal to scale horizontally or vertically before it becomes an incident.
Middleware’s infrastructure monitoring view shows every host with its current utilization alongside historical averages, so the decision about whether to scale is based on pattern data rather than a single moment’s reading.
The harder problem: when the obvious fix is the wrong fix
Threshold-based alerting handles simple cases. The real test of an observability backend is what happens when the root cause is not where you expect it.
Here is a scenario that plays out regularly:
You get a Slack alert at 1:00 PM CPU on one of your instances is at 80%. You spin up a new instance to absorb the load.
At 4:00 PM the same alert fires again. The instance you added three hours ago should have helped. It didn’t.
The instinct is to scale again. But scaling is not the fix here it is just delaying the real problem.
A good observability backend should help you find the answer of “Why?”
A well designed tool will have Infrastructure list showing your machine with 80% CPU usage ( along with other regular ones )
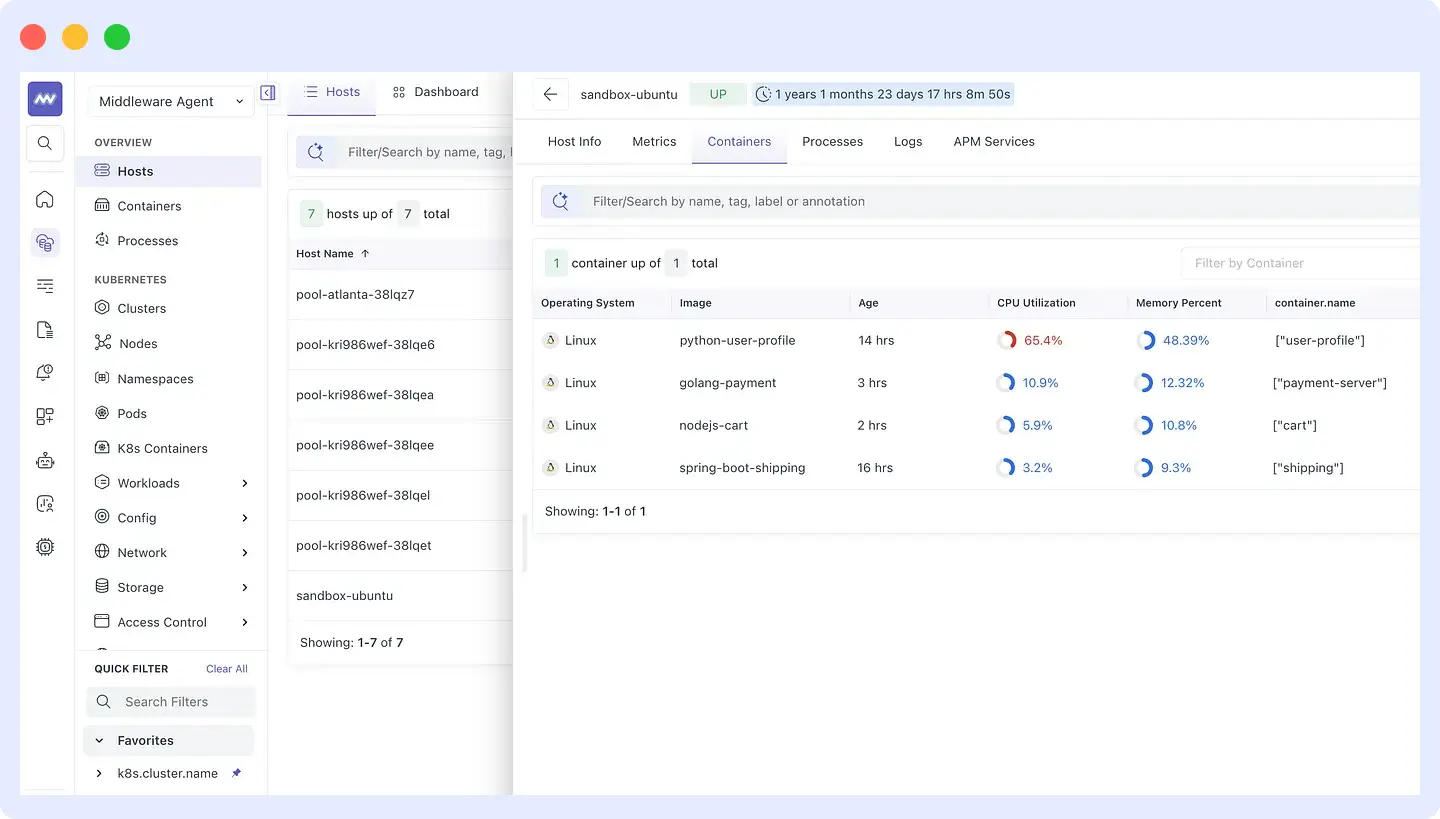
Step 1: Find the culprit process
Middleware’s infrastructure view shows all hosts with their current resource utilization. Drilling into the affected host surfaces all running processes and containers sorted by CPU consumption. The python-user-profile container is consuming 65.4% of CPU well above every other container on that host.
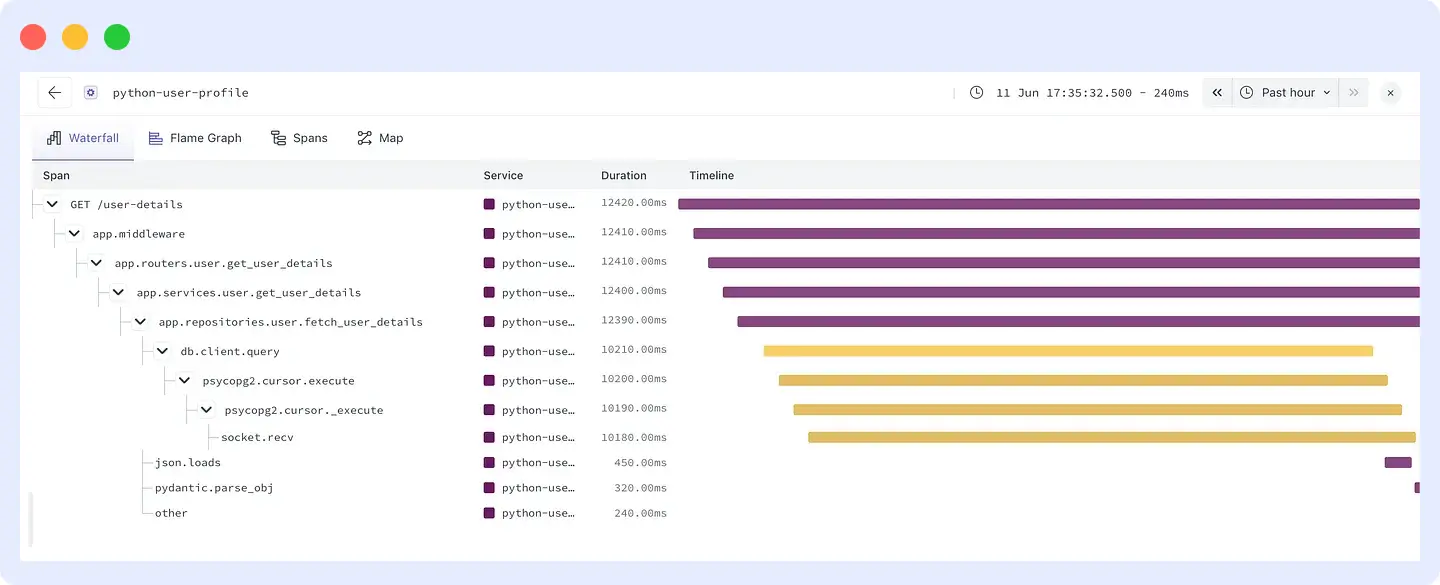
Step 2: Follow the trace
Drilling into the Python service shows that response time for GET /user-details has climbed from around 2 seconds to over 12 seconds. Opening the waterfall view in Middleware’s APM makes the bottleneck visible immediately: db.client.query is taking 10,210ms. Every call down the stack psycopg2.cursor.execute, psycopg2.cursor._execute, socket.recv is waiting on the database.
Step 3: Check the database
Middleware’s database monitoring dashboard shows the table bloat data alongside CPU and memory utilization per host. The user_data table has a bloat score of 25 the highest in the environment. That explains the slow query. The database is doing more work than it should on every read because the table has accumulated dead rows.
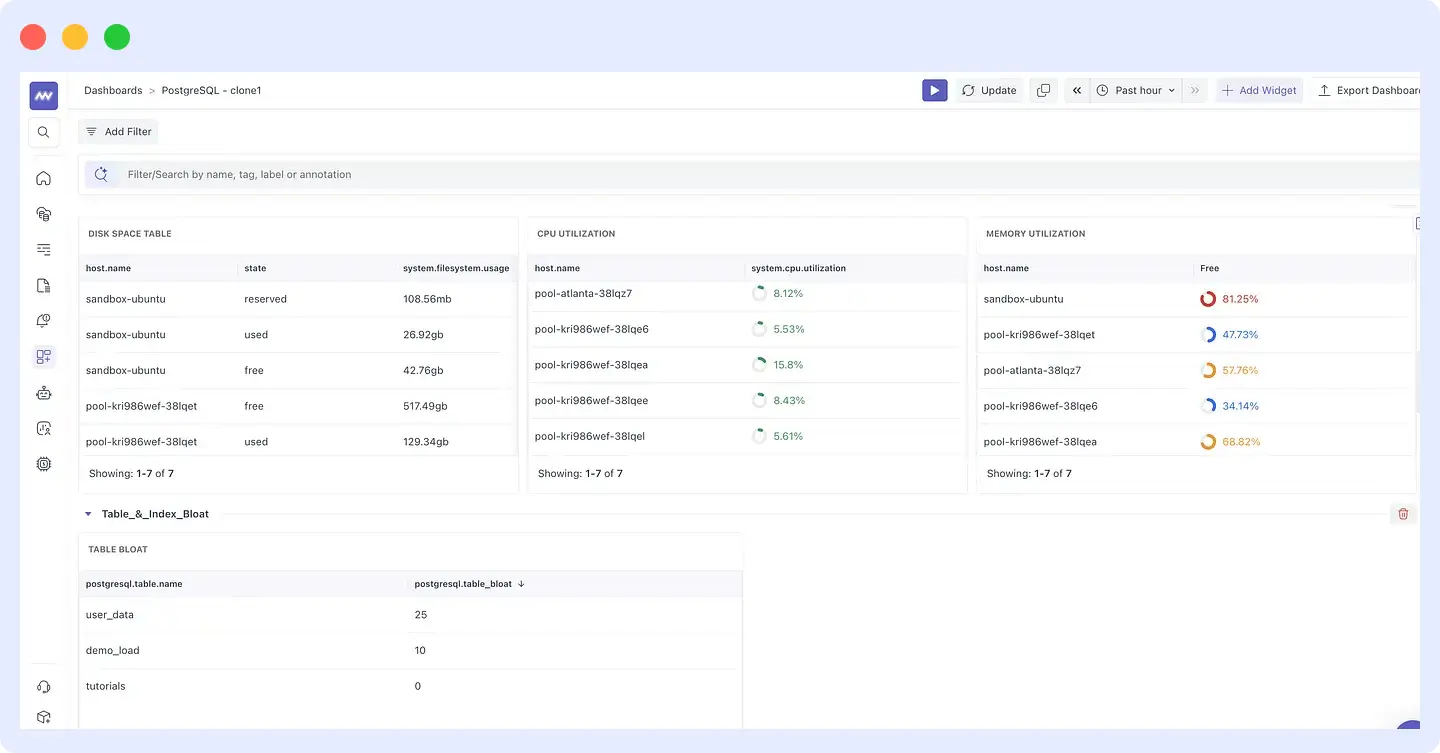
The fix is AUTOVACUUM on PostgreSQL not a new EC2 instance.
This chain of reasoning from CPU alert to container to slow trace to database bloat is only possible when metrics, APM traces, and database telemetry are correlated in a single view. Middleware uses exemplars, trace-log correlation, and OpenTelemetry context propagation to make this path navigable without switching between tools or writing manual queries.
OpsAI: When you want the correlation done for you
The drill-down path above works well when you have time to investigate. For incidents during on-call hours or high-pressure situations, Middleware goes further.
OpsAI is Middleware’s AI SRE agent. It reads your full telemetry metrics, traces, logs, and database signals through an MCP server connection. Instead of navigating the drill-down manually, you can ask OpsAI directly:
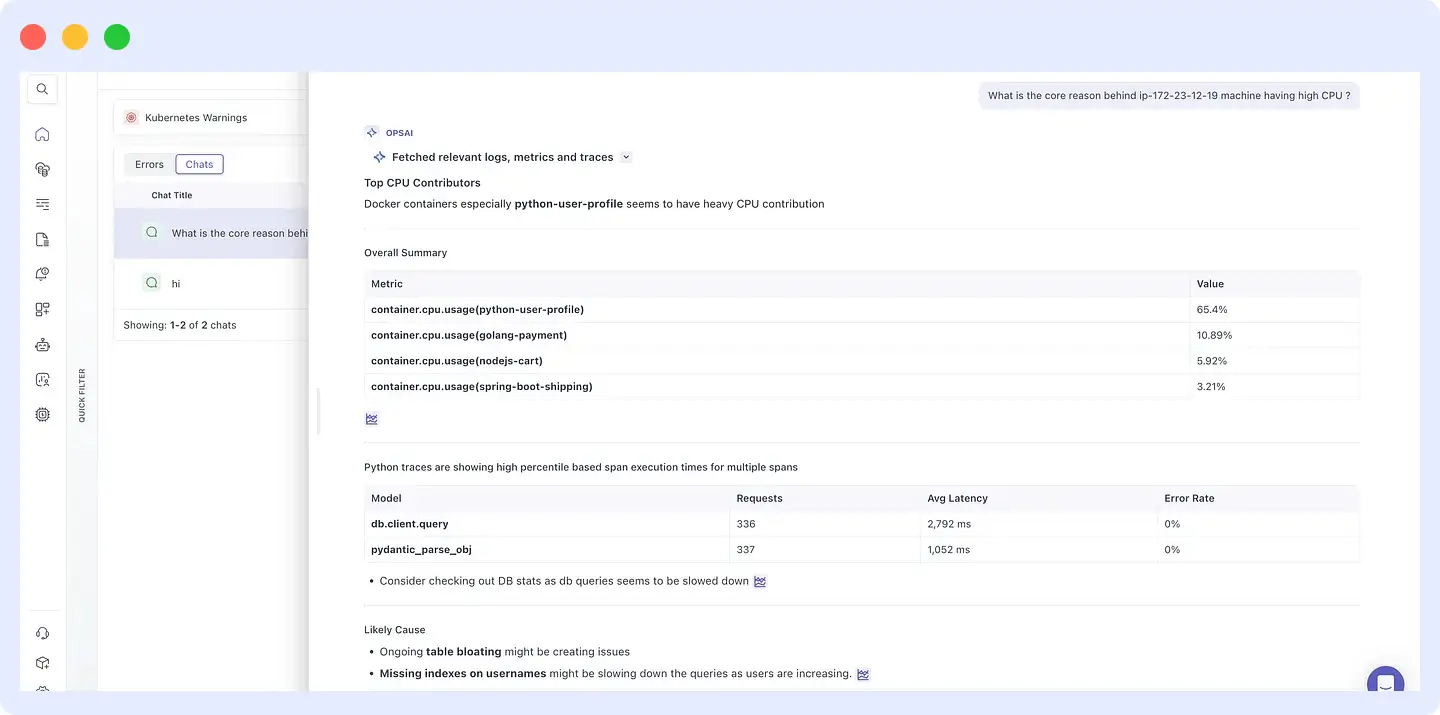
“What is the core reason behind my ip-172-23-12-19 machine having high CPU?”
OpsAI fetches relevant logs, metrics, and traces, identifies the top CPU contributors across containers, surfaces the high-percentile span execution times in the Python service, and returns a structured analysis: the python-user-profile container is responsible for 65.4% of CPU usage, db.client.query is running at 2,792ms average latency across 336 requests, and the likely causes are ongoing table bloat on user_data and missing indexes on usernames.
Root cause in seconds, without a manual investigation chain. To understand how OpsAI was built and what it can do, see How we built an AI SRE agent that troubleshoots production issues like a team of engineers.
What this means for platform teams already running OpenTelemetry
If you are already collecting OpenTelemetry data, plugging into Middleware as a backend gives you:
- Signal correlation infrastructure metrics, APM traces, logs, and database telemetry linked by OpenTelemetry context, not bolted together after the fact.
- Drill-down navigation from a high-level host list to a specific slow span to a database table in a few clicks, with data sorted to surface what matters.
- OpsAI is an AI SRE agent that reads your telemetry and returns a root cause analysis, so you do not have to start every investigation from scratch.
- Prompt-based dashboards describe what you want to see, and Middleware builds the dashboard, rather than requiring manual widget configuration.
- Proactive alerting anomaly detection across your OpenTelemetry signals, not just threshold rules.
- Data retention and RBAC long-term storage for pattern analysis, with access controls scoped to your team structure.
Your telemetry data stays OpenTelemetry-native throughout. Middleware reads it in the standard format you are not locked into a proprietary schema.
What comes next
This post covered one use case: correlating infrastructure, APM, and database signals to diagnose a CPU incident that turned out to be due to database bloat. There are many other patterns, such as LLM API cost monitoring, user-level traffic analysis, and deployment-correlated latency regressions, that follow the same underlying approach.
If you want to explore how Middleware handles your specific OpenTelemetry setup, start a free trial or browse the documentation.
For teams earlier in the OpenTelemetry journey, part 1 covers auto-discovery and zero-code instrumentation.