



Your on-call engineer spends nearly 60% of their week hunting root causes that already happened, while the failed deploy that started it all never triggered a single alert.
OpsAI is Middleware’s AI SRE agent: it watches your Kubernetes, APM, RUM, and log telemetry continuously, catches the failures that don’t page anyone, and turns the cause into a reviewable pull request. It already lives inside your observability data, so there’s no separate agent to feed and no context to rebuild on every run.
TL;DR
- Most production toil isn’t the loud kind. It’s the deploy nobody watched, the p99 that slid 8% over three weeks, the failed rollout that got swept under a retry. No alert, no owner, no accounting.
- An AI SRE agent that runs continuously in the background solves for the work that has no owner. Not a scheduled script. Not a dashboard. An agent that monitors your telemetry in real time and acts on what it sees.
- The bottleneck isn’t the LLM. It’s context: your topology, your baselines, what changed yesterday. General agents must reconstruct that context via third-party APIs. Middleware OpsAI, our AI SRE agent, already lives inside the telemetry, APM, RUM, logs, infrastructure, and Kubernetes, so the context is native.
- Four things you can hand off first: failed deploys, SLO-triggered investigations, cause-with-context in Slack, and the fix itself as a PR.
The work with no alert is the work that keeps you reactive
If you sit with an on-call rotation for a week, you’ll find a pattern. The noisy incidents get owned. The quiet work that would prevent the next one doesn’t. The rollout that partially failed but nobody chased. The queue depth that’s been climbing for a month but hasn’t crossed a threshold. The p99 that “feels a bit slower” but hasn’t paged. The RUM error rate on the checkout page that ticked up after Tuesday’s deploy.
None of it fires loudly. All of it matters. And the thing that keeps most teams reactive isn’t a shortage of monitoring. It’s that no human rotation has the bandwidth to keep looking between incidents. Industry data lines up with that experience: on-call engineers spend nearly 60% of their time hunting for root causes instead of building features, and Gartner projects that more than 50% of enterprises will adopt AIOps and agentic automation by 2027.
That’s the gap an AI SRE agent is for. It’s also what alert fatigue looks like from the inside, once no one has bandwidth left to chase the quiet stuff.
What an AI SRE agent does inside a full-stack observability platform
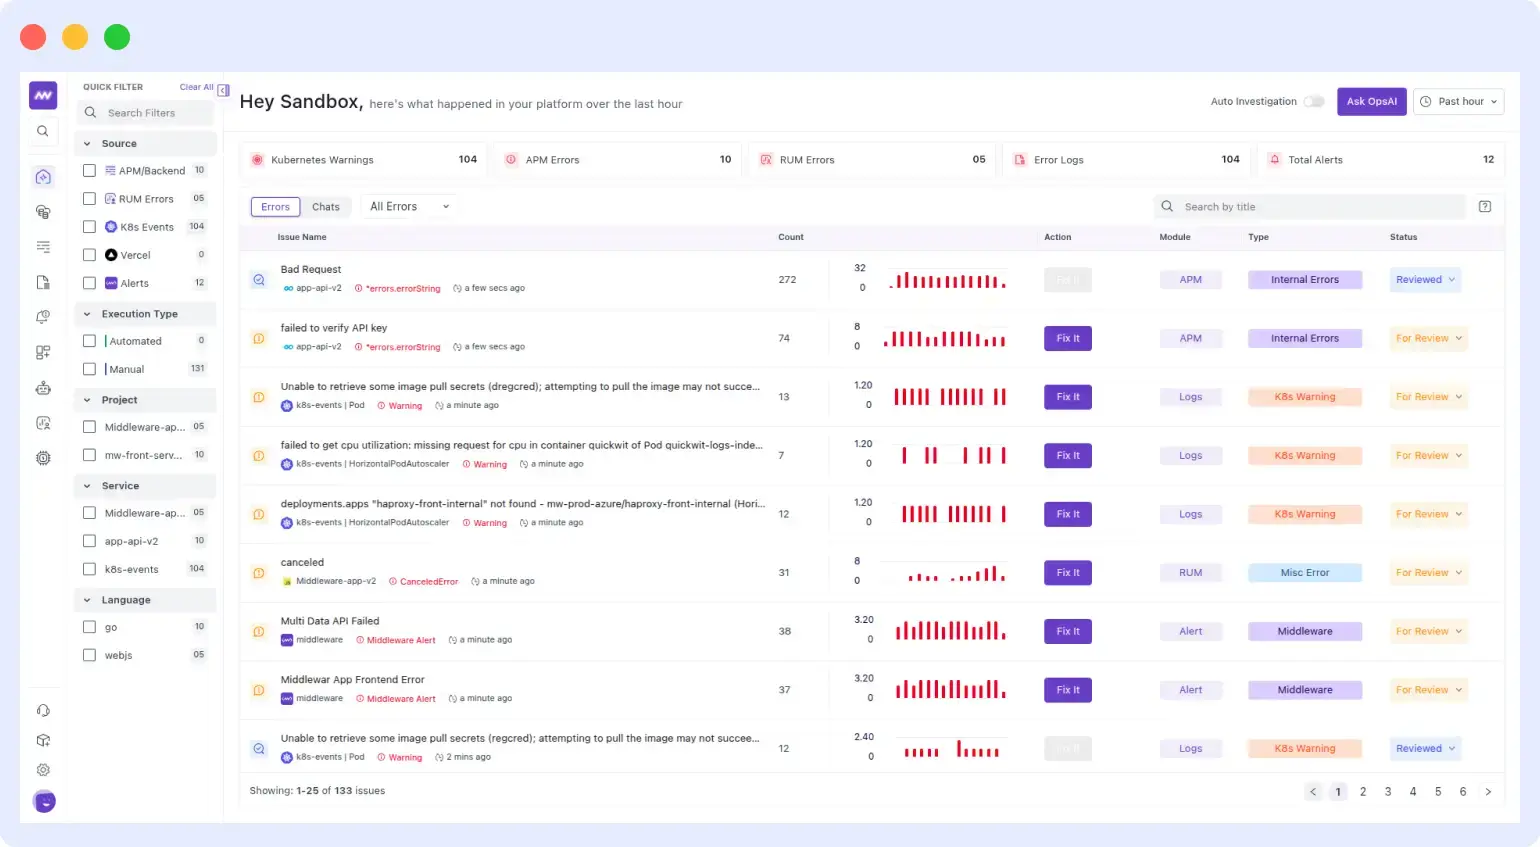
OpsAI is an AI SRE agent that runs continuously in the background of your observability stack. It doesn’t wait for you to open a tab, and it doesn’t fire on a cron. It stays live against your telemetry and reacts the moment something in production actually breaks.
What it watches continuously:
- Kubernetes events, live. Pod crashes, OOMKills, CrashLoopBackOff, HPA misconfigurations, node pressure. OpsAI is on the Kubernetes event API, so it reacts as things happen, not on a schedule.
- Application errors across APM and RUM. Stack traces, error spikes on a backend service, failed frontend sessions after a release. The agent correlates the backend trace from APM with the frontend event from RUM and the log line without you telling it where to look.
- Alerts from Middleware and third-party tools. SLO alerts, threshold alerts, and monitors from Datadog and Grafana all trigger investigations.
- Slack, both ways. OpsAI posts findings into the channels where your team already lives and takes questions there too.
The difference between an AI SRE agent that sits on top of an observability tool and one that lives inside it is what it wakes up to. A general-purpose agent has to call your observability vendor’s API, pull a slice of telemetry, correlate it with a slice of infra data from somewhere else, and reconstruct a picture of the system every time it runs. That reconstruction cost is the reason most agent workflows feel expensive and brittle. The model is fine. The plumbing isn’t.
OpsAI runs against the same unified telemetry pipeline your APM, RUM, log, and Kubernetes data already flow through. Traces, logs, metrics, frontend sessions, deploys, and pod events are correlated by the platform, not stitched together by the agent at query time. The context isn’t something the agent builds. It’s what the agent runs on.
Why frontier models alone don’t close this
Every operational task is really two things multiplied together.
The operation. Reading a query plan, diffing a deploy, summarizing what happened overnight. Small. Roughly fixed. A modern model handles it.
The context. Your services, your dependencies, which team owns what, what “normal” looks like for each datastore, what changed in the last 24 hours. Large. Growing every quarter. Different in every environment.
Context is half a frontier model cannot help with. GPT-5 doesn’t know your topology. Claude doesn’t know your SLOs. The toil in operational work isn’t the operation. It’s setting up the context every single time.
An agent that sits inside your observability platform inherits that context for free. Once you’re not paying the setup cost each run, the recurring work stops being expensive to delegate.
Four things OpsAI can take off your plate
1. Catch the deploys and rollouts that fail quietly
Not every failed rollout pages. A service that comes up but starts throwing 500s on 3% of requests, a deployment that’s stuck in a partial-rollout state, a canary that never fully promoted. Each one is small enough to miss and big enough to matter by the end of the day.
OpsAI monitors your services and rollouts in real time. When a rollout fails, or a service degrades post-deploy, it catches it and drives it toward resolution, correlating the failure with the change that caused it and, where it can, opening a fix. For the most common ways a rollout goes wrong in the first place, see our guide to Kubernetes deployment misconfigurations.
Tip: Start with your two or three highest-traffic services. Small blast radius, immediate signal, easy to trust. Widen the scope once the review loop feels tight.
2. Let the alert be the trigger, and let OpsAI do the investigation
Most SLO and threshold alerts arrive as a ping and a link. Someone has to open a dashboard, decide whether it’s real, chase the correlated logs, and figure out what changed. Manually stitching that picture together, alert by alert, is exactly the kind of work that drives up MTTR industry-wide.
Wire an alert on the signal you care about, a p99 threshold, an error-rate budget burn, an infra-level saturation limit, and OpsAI picks it up the moment it fires. It pulls the correlated telemetry across APM, RUM, logs, and Kubernetes, traces the issue to the change or component that caused it, and does the investigation you would have done by hand.
Tip: Encode the check with a custom instruction so runs stay consistent and accurate. Tell the agent what “healthy” looks like for that service, and what past incidents on it usually turned out to be. The context makes the next investigation faster.
3. Get the cause in Slack, with the evidence attached
The value of an investigation isn’t the investigation. It’s the moment someone else on the team can read the cause and act.
Once OpsAI finishes an automated investigation, it posts the result into Slack: what broke, why, which services and users were affected, and the evidence trail across traces, logs, and pod events. The team sees the cause without anyone having to write it up.
And because the same agent produced the summary and holds the context behind it, follow-up questions in the thread (“What changed on Tuesday to cause this?”) are answered from the same graph, not from a re-query. The thread becomes the incident record you would have written after the fact.
Tip: Put OpsAI in the channels where your team already talks about production. Alerts, incidents, deploys. The Slack thread is where the digest and the follow-ups live together.
4. From “here’s the cause” to “here’s the PR”
This is where OpsAI diverges from most agents. On other platforms, the agent ends at the answer. On Middleware, once OpsAI has traced a production issue to the exact line of code, it can go one step further and generate a pull request through Middleware’s internal GitHub toolkit: file-scoped reads, zero source-code retention, and a 95% confidence threshold before it acts.
Two modes cover the loop:
- Auto RCA mode. OpsAI proposes the fix as a PR. A human reviews and merges.
- Auto Fix mode. OpsAI applies well-scoped remediations directly across APM, RUM, and Kubernetes, things like crashloops, memory misconfigurations, resource limit corrections, and other clear-cut fixes that are safe to automate.
Alongside the fix, OpsAI can create an automated response pipeline based on the APM, RUM, and Kubernetes signals it saw, so the next occurrence of the same failure pattern is handled the same way, without a person building a runbook by hand.
The upshot: the alert that used to interrupt an engineer becomes a resolved PR they review with morning coffee.
Tip: Start with Auto RCA everywhere, and enable Auto Fix on a small, low-risk set of remediations first. Widen as your confidence in the review loop grows.
Why this is a Middleware-shaped problem
Two things make remediation agents work in production, and both are structural, not model choices.
The context has to be native. Every task depends on your topology, your baselines, and what changed. If the agent has to rebuild that from third-party APIs on every run, the economics never work. On Middleware, OpsAI runs on the same unified telemetry the platform ingests, so context isn’t a query. It’s the substrate.
The output has to close the loop. Detection is table stakes. Diagnosis is table stakes. The step that saves an engineer’s day is the fix. OpsAI’s internal GitHub toolkit and Kubernetes Auto Fix are what let the agent finish the job instead of handing back a ticket.
Together, that’s the difference between an agent that runs beside your observability stack and an agent that runs from inside it.
Where to start
If you’re onboarding OpsAI for the first time, here are three low-friction starting points:
- Turn OpsAI on for your two or three highest-traffic services. Watch how it handles the first few failed deploys and post-release regressions.
- Wire a p99 or error-budget alert on an SLO-critical service. Let OpsAI do the investigation and post the cause in Slack. Measure how much time your on-call saved on the first one.
- Enable Auto RCA across the board, keep Auto Fix scoped to a small set of Kubernetes remediations. Widen the surface after you’ve calibrated the review loop.
FAQs
What’s the difference between an alert and an AI SRE agent?
An alert fires when a signal crosses a line you set in advance. OpsAI runs continuously against your telemetry, investigates when an alert fires, correlates evidence across the stack, and can take action, not just notify. Alerts point at a symptom. OpsAI works on the underlying cause.
Does OpsAI replace on-call?
No. It shrinks what on-call has to react to. Failed deploys get caught, SLO alerts get investigated, causes get posted to Slack, and clear fixes ship as PRs. Your rotation is free for the incidents that actually need human judgment.
Does OpsAI need access to my source code?
OpsAI uses Middleware’s internal GitHub toolkit with file-scoped reads and zero source-code retention. It reads only what it needs to propose a fix, and nothing is stored.
When does OpsAI act automatically vs. propose a fix?
OpsAI only acts when confidence exceeds 95%. Below that, it drafts a proposed fix, and a human reviews. Auto RCA mode always requires human merge. Auto Fix mode covers a defined set of clear-cut remediations across APM, RUM, and Kubernetes.
How is this different from Resolve AI or a general agent framework?
Resolve and similar tools sit on top of your observability stack and reason via third-party APIs. OpsAI is built inside Middleware’s full-stack observability platform, so APM, RUM, logs, infrastructure, and Kubernetes telemetry are first-party. That collapses the context-reconstruction cost that limits general-purpose agents. For a workload-by-workload breakdown, see the OpsAI vs Resolve AI comparison.
How do I get started?
Start a free 14-day trial of Middleware at middleware.io, no credit card required. OpsAI is available under usage-based pricing.

