
Users leave slow apps in seconds. Every additional second of load time increases bounce rate, drops conversions, and hurts search rankings. RUM (Real User Monitoring) gives you real-time visibility into how users actually experience your site across devices, browsers, and regions and helps you fix problems before they affect revenue. Effective User Experience Monitoring ensures that performance issues are identified early across all user segments.
UX can boost or damage your product. Long load times and slow response times will drive users away from even the most appealing platform. Real User Monitoring (RUM) lets you assess how users interact with your platform.
👉 Want to understand RUM in more depth? Explore our complete Real User Monitoring guide here.
RUM provides teams with visibility for UX optimization. It monitors users’ app interactions across devices, browsers, and locations in real time, rather than making assumptions. This makes Real User Monitoring a critical part of modern User Experience Monitoring strategies.
Middleware’s RUM solution lets you correlate user behavior with performance metrics, replay sessions, and get real-time alerts to understand issues and act before they escalate.
“Backend monitoring can only show symptoms like increased 5xx or traffic spikes, but not why users are struggling. RUM helped us find broken frontend releases and issues caused by external sources that backend tools completely missed.”
Georgii Kashintsev, Head of SRE, Rambler&Co
In this blog, we’ll explore seven ways to use Real User Monitoring to enhance UX.
1. Spot and Fix Errors Through User Experience Monitoring
Every mistake your users encounter can cost you money, trust, and your reputation, especially during checkout or form submission. For instance, during a flash sale, a single broken script that prevents people from buying could lead to a significant drop in revenue.
Imagine you’re a fintech startup and notice users dropping off during account verification without knowing why. With Middleware RUM, you can trace the actual cause: maybe it’s a JavaScript error triggered only in a particular browser, leading to a 22% conversion drop. With this, the dev team can fix the issue in minutes, preventing further loss.
“RUM helped us uncover a client-side script that blocked the main thread for 4.5 seconds. Users thought the ‘Add to Cart’ button was broken and clicked multiple times, creating duplicate orders. After optimizing the script, the operation dropped to just 400 ms, and user frustration disappeared.”
Jesse Singh, Founder, Maadho
How Middleware Helps
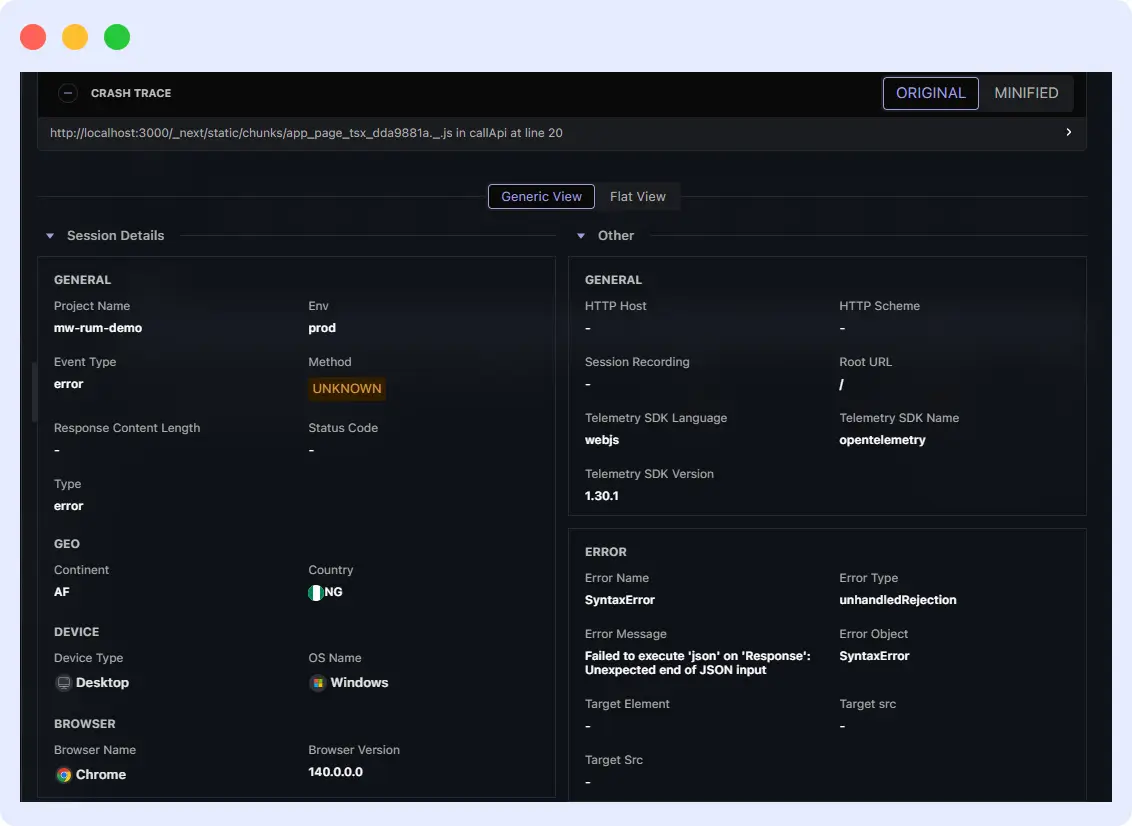
Middleware’s RUM can help you avoid those issues by highlighting such high-impact failures as they happen, so your team can act before users start dropping off. Each error gives the session and device context to help you identify it and correct it.
The best part is the quick setup:
- Launch Real User Monitoring from your Middleware dashboard.
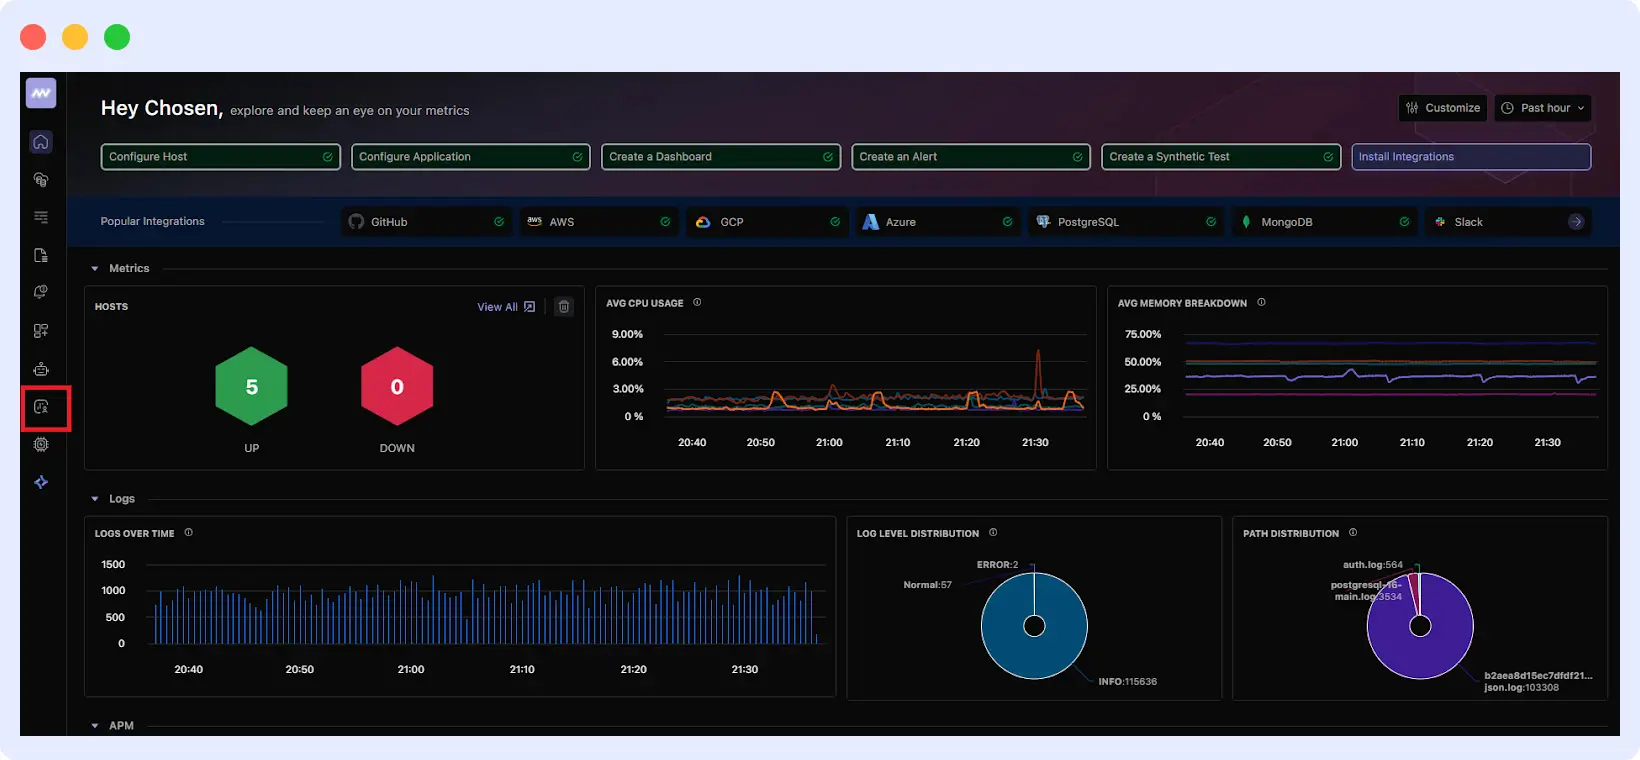
- Click Add New Application, then enter the app’s name and URL.
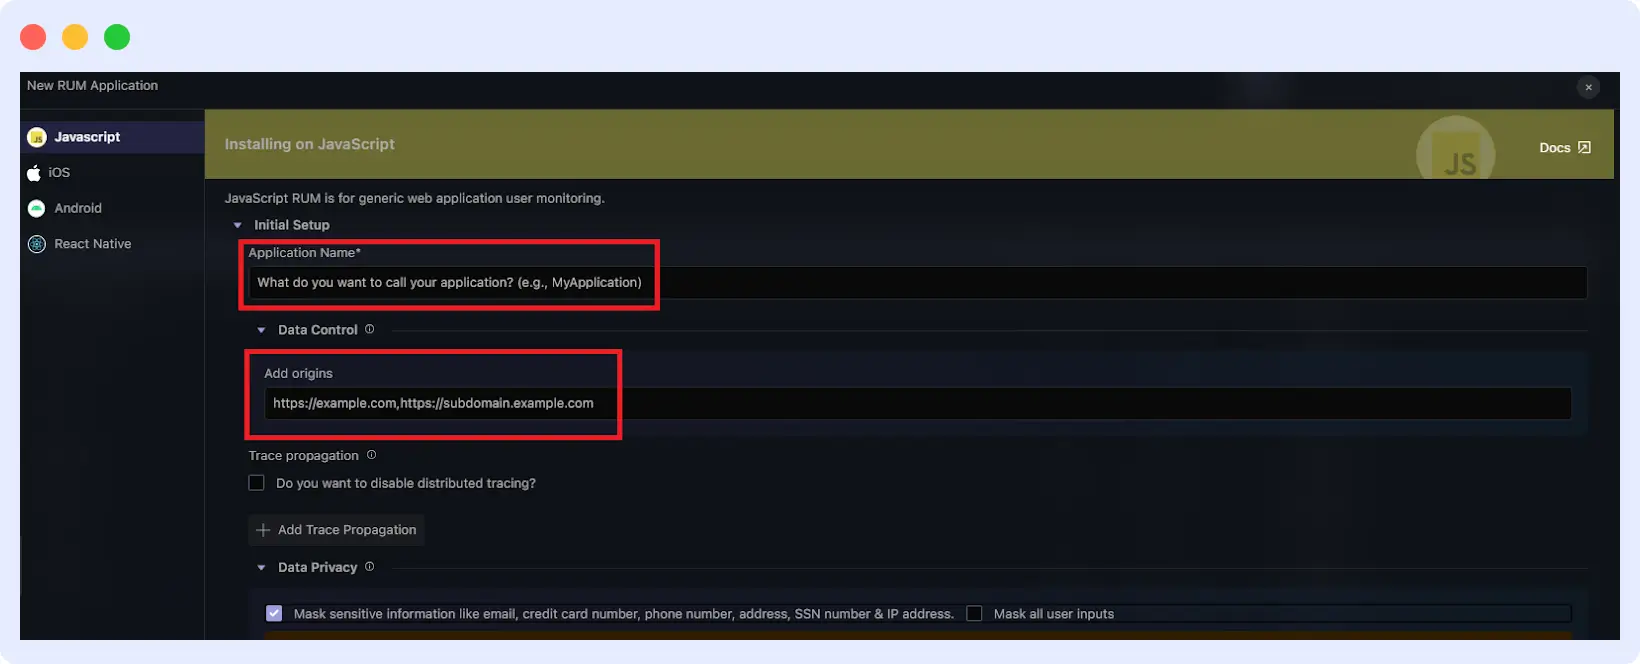
- Copy and paste the configuration script into the <head> section of your app.
<script src="https://cdnjs.middleware.io/browser/libs/0.0.2/middleware-rum.min.js" type="text/javascript" crossorigin="anonymous"></script>
<script>
  if (window.Middleware){
    Middleware.track({
      serviceName:"mw-rum-demo",
      projectName:"mw-rum-demo",
      accountKey:"<API_KEY>",
      target: "https://rum.middleware.io",
      tracePropagationTargets: [/.*/],
      defaultAttributes: {
        "app.version": "1.0.0",
      },
    })
  }
</script>
Middleware automatically logs and delivers user errors to your dashboard.
And Middleware goes further than basic error detection:
- It links errors to user actions and backend analytics to find the cause.
- Real-time alerts notify the right team of critical issues for speedy resolution.
Middleware manages user experience, preventing costly disruptions and satisfying customers.
2. Understand User Experience Monitoring Across Devices and Locations
Not everyone uses your app the same way. Some users use desktops, others mobile devices. The internet might be fast or slow. If you don’t watch these changes, you may lose clients in certain countries or device groups without knowing why.
“We saw LCP spikes only on specific Android players during hot afternoons and FID issues when venues switched to a 4G backup link. RUM helped us pinpoint these conditions instantly—insights traditional monitoring missed.”
Daniel Reynolds, Marketing Director at Dynamo LED Displays
For example, in areas with weak network coverage, images and APIs may load slowly. With Middleware RUM, you can see precisely how these users behave under those conditions and take action.
How Middleware Improves UX Monitoring
Middleware’s RUM dashboard lets teams filter performance by location, device, browser, OS, and more. Showing which persons are most affected helps you choose bugs to fix.

With this, you can:
- Compare performance across devices, browsers, and regions.
- Identify the most affected set of users and focus the fixing efforts there.
- Prioritized fixes to ensure resources go where they deliver the highest ROI.
This lets you give customers great experiences regardless of how or where they connect.
3. Correlate RUM Data with Backend Metrics for Better User Experience Monitoring
Frontend issues don’t necessarily cause poor UX. Web pages that load slowly or fail often have backend issues, such as faulty API queries or slow server responses.
If you only monitor the frontend, you’ll keep focusing on surface-level signs while the real problem lies in the backend. When combined with User Experience Monitoring, backend data reveals the complete cause of poor UX.
RUM works better when combined with backend and infrastructure metrics. You’ll be able to trace problems and identify when the error originates from the backend.
“We linked RUM session IDs directly to backend database queries. A page showing high ‘Time to First Byte’ wasn’t a frontend issue at all—it was a complex SQL query locking the warehouse database. RUM-to-backend correlation helped us identify and fix the root cause fast, improving our procurement portal’s performance significantly.”
Jesse Singh, Founder of Maadho
How Middleware Bridges Frontend & Backend for Complete UX Monitoring
Middleware unifies RUM data with backend traces, APIs, and infrastructure metrics in one view. It provides end-to-end visibility into every user journey by automatically linking frontend sessions with trace IDs and logs.
With this, your team can:
- Replay User Sessions for Better User Experience Monitoring, along with backend logs and traces, to understand the full context.

- See exactly how backend issues like slow API calls or server spikes affect real users.
- Speed up debugging and recovery by showing the exact root cause, reducing mean time to resolution (MTTR).
- Make debugging faster by identifying and fixing the root cause
⚡Try out Middleware RUM to deliver a reliable digital experience.
4. Study User Interaction Patterns to Improve Features
Every click, tap, and scroll is a signal. User Experience Monitoring helps capture these interactions to clearly understand engagement patterns. You lose vital data on how users explore your app and which features require enhancement without tracking these interactions.
For instance, you notice users repeatedly abandoning the “Upgrade Plan” model. Through interaction heatmaps with Middleware’s RUM, you can see that a misplaced CTA confuses users. This will allow you to reposition it, thereby increasing clicks.
Data-Driven UX with Middleware
Middleware RUM tracks user interactions and provides dashboards for session replay, click heatmaps, and session replay.

When you replay the user sessions, you’ll be able to:
- Visualize user paths, drop-off points, and heatmaps for smarter UX monitoring.
- Identify underperforming elements that can affect frontend performance
- Ensure every adjustment delivers tangible gains by using real-time monitoring to confirm UX changes.
5. How RUM Helps Track Long-Term UX Monitoring Trends
User experience is never static. Devices, networks, and user behaviors change frequently, even business goals. Snapshots may miss slow-building defects or new performance concerns until consumers complain.
For instance, after a UI redesign, there might be a gradual increase in page load time. If you don’t continuously track your application, that degradation will go unnoticed until conversions drop.
RUM provides the long-term view you need. It tracks real use performance and behavior over days, weeks, and months, revealing whether your recent changes improved or damaged the overall experience.
“RUM metrics are essential during releases. They reveal regressions that may require rollback and help developers assess release quality. We found that many UX degradations were caused by frontend updates—continuous RUM monitoring caught them before users complained.”
Georgii Kashintsev, Rambler&Co
Continuous User Experience Monitoring ensures performance does not degrade over time.
How Middleware Enables Continuous UX Monitoring
Middleware RUM continuously collects and visualizes user experience data, helping you track how performance metrics evolve across platforms and locations.
From the Middleware dashboard, you can:
- Track Long-Term Performance Trends with User Experience Monitoring.
- Detect regression immediately after product updates through automatic change tracking.
- Early detection of user behavior changes, such as lower engagement or longer interaction delays.
- Notify you when UX metrics, such as site load time or Core Web Vitals, drop below acceptable levels.
6. Optimize Core Web Vitals Based on Real User Segments
Core Web Vitals, such as Largest Contentful Paint (LCP), First Input Delay (FID), and Cumulative Layout Shift (CLS), indicate website speed, interactivity, and visual stability. But not everyone behaves similarly.
A page might take 1.2 seconds to load on a high-end workstation with fiber internet, but it could take up to 5 seconds on a mid-range Android phone with 3G.
That is why optimization must be based on real user segments. Middleware’s RUM lets you see how each user group actually experiences your product, which helps in fixing performance issues.
Optimizing Core Web Vitals Through User Experience Monitoring
Middleware continuously measures core web vitals under real conditions. You can see right away on the RUM dashboard which groups are doing well and which are not.
“A flagship interactive LED wall showed LCP around 3.1s in one region. RUM + backend traces revealed CDN cache misses and heavy 4K downscaling on devices. After optimizing assets and adding edge rules, LCP dropped to 1.4s and FID improved from 180ms to 45ms.”
Daniel Reynolds, Dynamo LED Displays

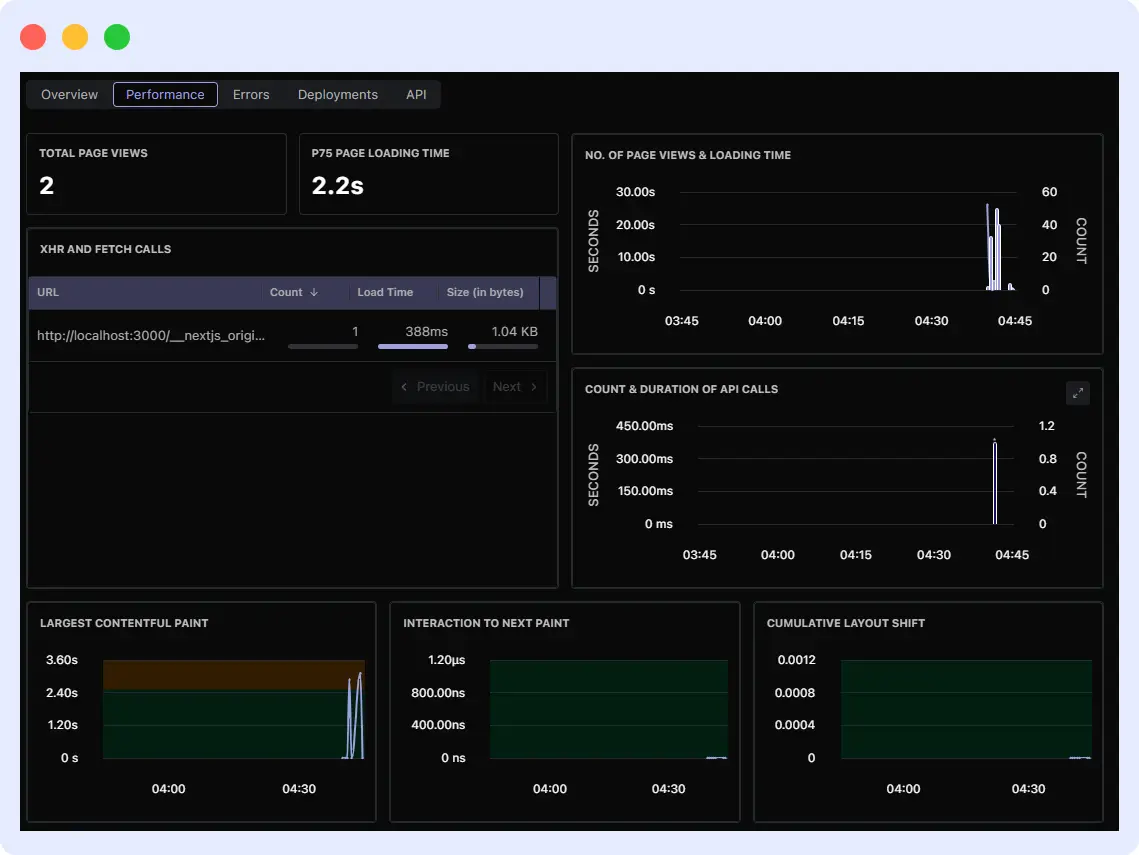
For example, the above picture shows that LCP is 2.68s, indicating it needs improvement.
This lets you segment performance to identify user groups with low LCP, FID, or CLS scores. Core web vitals can be linked to engagement and conversion metrics to measure how slow or unsteady experiences affect business results.
7. Identify and Prioritize User Problems in Real Time
Quickly identifying and fixing user experience issues is crucial. You should know which concerns demand immediate response. Identify problems and prioritize them so your team can work on the most important ones.
Middleware RUM might notice that 300 people are taking too long to complete checkout due to a validation issue. The alert system notifies your frontend team instantly. This issue is of top priority and requires immediate attention. This is where User Experience Monitoring helps by surfacing user-impacting issues instantly.
How Middleware Simplifies Real-Time Problem Prioritization
Prioritizing errors is easier with Middleware. It will show you the exact flow being disrupted, including full details, enabling you to prioritize these problems.
With all this detailed information, prioritizing errors becomes easier. Grouping errors prevents you from chasing duplicates; you just go straight and fix one root cause.
“Want to see exactly where users struggle? Try Middleware RUM for free and start fixing UX issues before they impact your business.”
How Hotplate Uses RUM for User Experience Monitoring
Hotplate, a growing platform that connects pop-up chefs with diners, uses Middleware’s Real User Monitoring (RUM) and Session Replay to gain visibility into real customer behavior and improve application performance at scale.
Key Outcomes
- 10× reduction in observability costs
- 90% decrease in latency across critical workflows
- 75% faster incident investigation and resolution
- More reliable and consistent user experience for end customers
How RUM Helped Hotplate
- Identified frontend issues directly from real user sessions
- Used session replays to uncover a UI flaw that caused incorrect cart-event associations
- Enabled the support team to diagnose user-reported problems without depending entirely on engineering
- Combined RUM with APM data to spot backend bottlenecks and optimize overall performance
Why Choose Middleware for User Experience Monitoring with RUM
Choosing the right RUM solution is something you need to consider carefully. Middleware offers a comprehensive platform that delivers clarity, speed, and control over the user experience.
Here’s why teams choose Middleware for Real User Monitoring:
Unified Platform
With Middleware, you don’t need to toggle between multiple tools for frontend monitoring, backend performance, and infrastructure monitoring. You’ll get everything in a single dashboard. That means you can see:
- How users experienced an error
- The exact backend trace or API call behind the problem
- The infrastructure metrics that explain why it happened.
This end-to-end access saves your team time and prevents the frontend and backend from blaming each other.
Easy Setup for User Experience Monitoring with RUM
Getting started with Middleware’s RUM is straightforward. You don’t need a complex setup or days of integration. As illustrated earlier, it can be done in minutes by adding a lightweight script to your app. From there, Middleware will start capturing data automatically; no heavy configuration is required.
→ Ready to implement RUM in minutes?
Follow our step-by-step guide here: Get Started with Middleware RUM
Advanced Segmentation
Middleware helps you filter and segment data by device, browser, and location to identify user differences. This granularity allows you to find performance and usability issues in high-impact user groups, so optimizations focus where they matter most.
Real-time Alerts
No need to log in to your dashboard or wait for complaints to identify a problem. Middleware instantly notifies you when an issue affects critical flows, based on user impact. Sending alerts to email, Slack, Teams, and other platforms is possible based on your own customization. Prioritizing alerts by scope and severity removes background noise.
By providing your team with real-time information across the frontend and backend, Middleware lets them improve the user experience and performance.
FAQs
How does RUM improve UX?
RUM shows teams where users experience delays, mistakes, or drop-offs, helping them fix problems faster and improve performance.
What distinguishes Synthetic Monitoring from RUM?
While Synthetic Monitoring uses simulated testing to determine how well things will perform, RUM examines how actual users interact with them in real time.
Can RUM help improve Core Web Vitals?
Yes. To improve Core Web Vitals (LCP, FID, and CLS) across devices, browsers, and locations, RUM shows how different user groups use them.
Is RUM useful for both small and large businesses?
Absolutely. RUM helps small teams find issues fast and large companies track performance across thousands of users and global regions.
Why choose Middleware for Real User Monitoring?
Middleware combines RUM with backend performance monitoring, session replay, and real-time alerts, making it easier to find, prioritize, and fix UX problems fast.


