A memory leak was growing quietly in production, invisible to threshold-based monitoring. Within hours of deploying the middleware, the team behind it received an AI-driven alert that flagged the anomaly before it could cascade into a full outage.
TL;DR
- A memory leak grew silently in production until an AI-driven alert flagged the anomaly hours before pods would have started crashing
- Reactive monitoring shows you symptoms after damage is done; proactive monitoring correlates logs, metrics, and traces to catch issues while they are still forming
- Unified observability removes the manual correlation work that slows down incident response in Kubernetes and Docker environments
- AI-based anomaly detection only works if it reduces alert fatigue, fewer, higher-confidence alerts beat more alerts that get ignored
- Predictable, usage-based pricing lets teams instrument fully instead of sampling data to control costs
This is the core problem with most monitoring setups: they are built to explain what already broke, not to catch what is about to break. In containerized microservices environments, a single leaking pod does not stay contained. A small memory leak becomes a wave of failing pods. A network bottleneck triggers timeout errors across every dependent service. By the time a threshold alert fires, the damage is already spreading.
This article breaks down what proactive, AI-driven alerting looks like in practice, how it differs from reactive monitoring, and what unified observability across Kubernetes and Docker environments actually changes for teams running production infrastructure.
What is reactive monitoring, and why does it fail modern teams?
Reactive monitoring is a setup built for postmortems, not prevention. An alert fires because a threshold was crossed, response time spiked, error rate jumped, and the team starts working backward: open the APM tool, then the log aggregator, then the infrastructure dashboard, correlating timestamps by hand while the incident channel fills with questions.
That fragmentation has a real cost. Teams routinely lose time jumping between disconnected tools during an incident, with context scattered across separate interfaces. The cognitive overhead slows response precisely when speed matters most.
For teams running Kubernetes and Docker workloads, this complexity compounds. Pods spin up and down. Network routes shift. A problem surfacing in one service might actually originate three hops away. Without unified visibility, debugging becomes an exercise in guesswork.
Reactive vs proactive monitoring
| Dimension | Reactive monitoring | Proactive monitoring |
|---|---|---|
| Trigger | Threshold crossed, symptom already visible | Anomaly detected against a learned baseline |
| Data view | Fragmented across separate tools | Correlated logs, metrics, and traces in one view |
| Response window | After user impact begins | Before user impact begins |
| Root cause identification | Manual timestamp correlation | Automated correlation across signals |
| Alert volume | High, often duplicative | Lower, filtered for confidence |
Moving from reactive to proactive monitoring requires two things working together: a single pane of glass that correlates logs, metrics, and traces, and intelligent alerting that surfaces anomalies before they cascade into incidents.
How does unified observability eliminate tool sprawl?
The foundation of proactive monitoring is removing tool sprawl. When logs, metrics, and traces live in separate systems, correlation becomes manual detective work, and every context switch costs minutes you do not have during an incident.
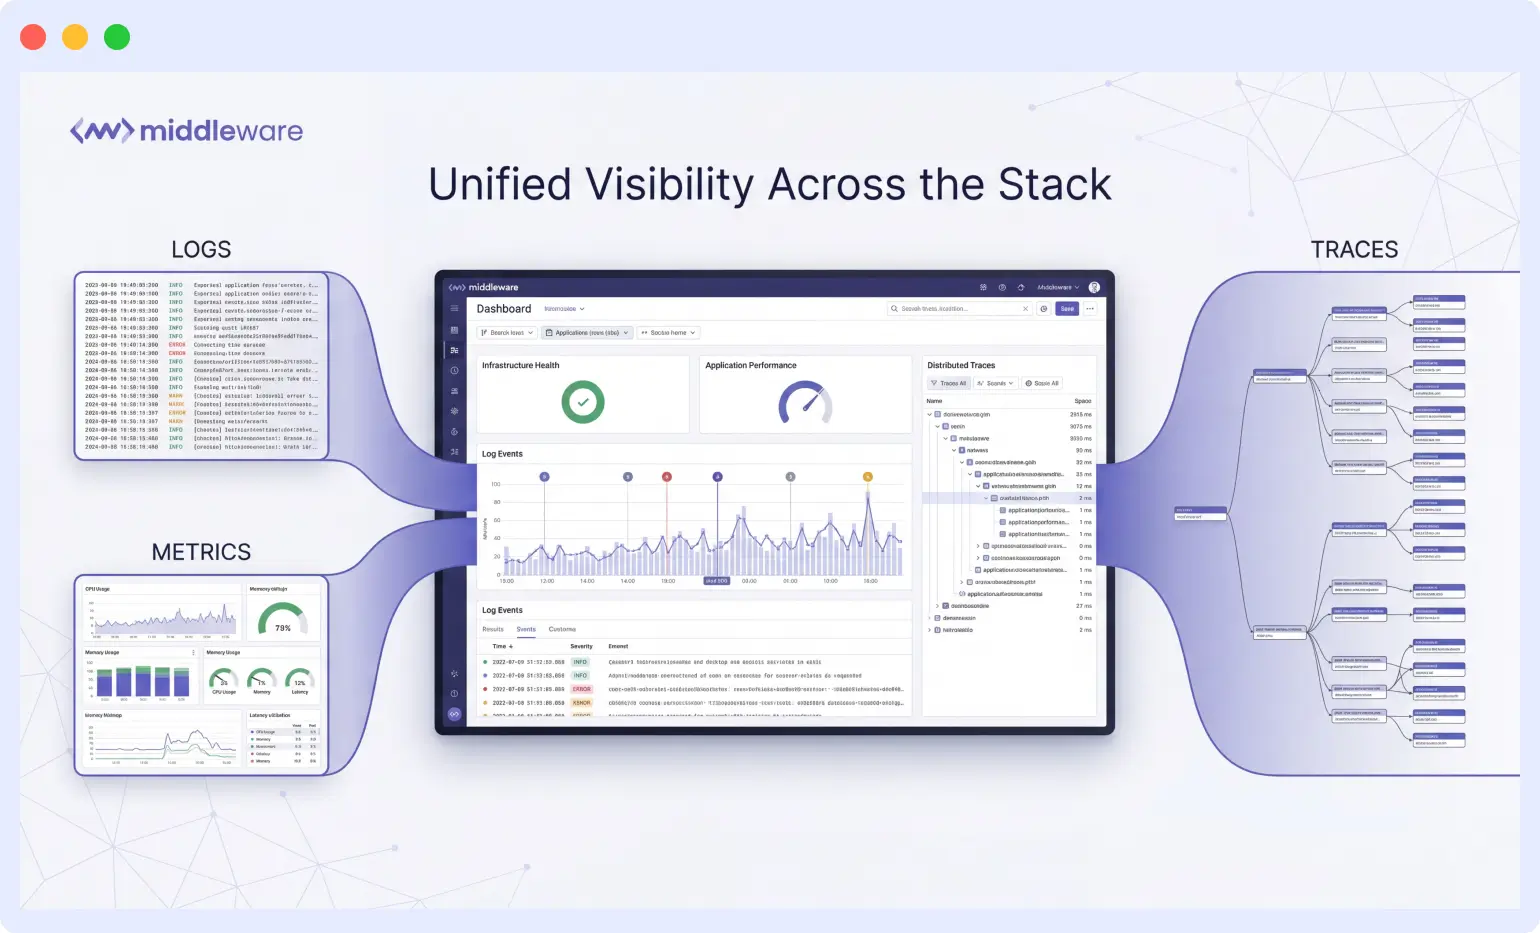
Middleware consolidates these data streams into a single dashboard. Infrastructure health, application performance, and distributed traces appear in one view, which removes the friction that typically slows incident response.
In practice, this shows up in day-to-day workflows. An engineer can trace a slow database query from the application layer down through infrastructure without opening new tabs or remembering which tool holds which data type.
The unified dashboard makes it simple to track logs, metrics, and traces without jumping across different tools. Real-time monitoring and alert notifications help me detect issues quickly, and the root-cause analysis feature saves a lot of debugging time.
Engineer at LDRP ITR
What makes AI-driven alerts different from threshold alerts?
Anomaly detection is the practice of learning a system’s normal behavior and flagging deviations from it, rather than waiting for a fixed threshold to be crossed. Unlike a static rule (alert when memory exceeds 90 percent), anomaly detection can catch a slow, gradual climb that never crosses a hard threshold until it is too late.
Alert fatigue is the real risk with any alerting system. Teams that receive hundreds of notifications a day start ignoring them, and critical signals get lost in the noise. Effective AI-driven alerting has to do more than watch thresholds: it needs to understand baseline behavior, detect anomalies in context, and prioritize by potential impact. The goal is fewer alerts that require action, not more alerts that get dismissed.
This is exactly what happened with the memory leak. Traditional threshold monitoring would have caught the issue eventually, likely once pods started crashing. Middleware’s OpsAI anomaly detection identified the gradual memory growth pattern early, before resource exhaustion triggered failures.
The AI-based alerts are super helpful too. We actually caught a memory leak before it turned into a major outage.
Engineer at Zenbyte Technology
How OpsAI catches issues like this
- Continuously monitors logs, metrics, and alert events for deviations from baseline behavior
- Reduces false positives through context-aware log anomaly detection instead of static thresholds
- Correlates signals across services, so a leak in one pod is not treated as an isolated event
- Surfaces actionable alerts through existing communication channels instead of adding another dashboard to check
How does this affect mean time to resolution?
The business case for observability investment centers on mean time to resolution (MTTR), the average time between an issue starting and it being fully resolved. Every minute of downtime carries direct costs (lost transactions, SLA penalties) and indirect costs (engineers pulled into fire drills instead of shipping features).
Teams using correlated Kubernetes observability report meaningful compression in troubleshooting cycles. The gain comes from eliminating context switching and skipping the manual correlation phase entirely, since logs, metrics, and traces are already tied together.
The bigger shift happens upstream of the incident itself. With proactive alerting catching issues early, many potential incidents never become incidents. Problems get intercepted during quiet hours instead of during peak traffic.
We’ve seen major improvements in uptime and a significant drop in the time it takes us to identify and fix issues. It’s also helped optimize our app performance and reduced the number of fire drills our team faces.
Engineer at Zenbyte Technology
What does setup look like for Kubernetes and Docker environments?
Observability tools only deliver value if teams actually deploy them. A complex setup process creates friction that delays time to value, or prevents full adoption altogether. For teams running Docker containers alongside Kubernetes, the deployment path needs to be straightforward since the environment is already complex enough on its own.
Legacy systems add nuance. Most enterprises run hybrid environments where modern microservices sit alongside older applications, and connecting those disparate systems takes additional effort, though the observability payoff justifies it.
Within minutes, we had it integrated with our Kubernetes and Docker setup, and we were already getting real-time metrics, logs, and traces in one clean dashboard. No complicated setup, no bouncing between tabs, everything is right there.
Engineer at Zenbyte Technology
Quick setup checklist
- Deploy the Middleware Kubernetes agent to your cluster or Docker environment
- Confirm nodes and pods are actively sending metrics in the infrastructure view
- Enable auto-instrumentation for supported languages to get APM without extra configuration
- Turn on OpsAI anomaly detection for Kubernetes to start baselining normal behavior
- Review the default dashboard, then customize views around the metrics your team checks most
How do you avoid dashboard overload?
Comprehensive observability creates its own UX challenge. More visibility means more information competing for attention, and a dashboard that shows everything can end up being a dashboard where nothing stands out.
Teams new to unified observability platforms report an adjustment period while they learn which views matter for their workflow. Built-in templates for common monitoring scenarios help flatten that learning curve.
The fix is not less data, it is better organization. Customization lets teams build views optimized for their own architecture and priorities, whether that means infrastructure metrics front and center or application traces leading the view.
Sometimes the dashboard feels packed with data, and it takes a bit of time to get comfortable navigating all the features. A few more built-in templates for common monitoring use cases would make onboarding even easier.
Engineer at LDRP ITR
What should monitoring actually cost?
Observability spend can spiral unexpectedly. Many platforms charge by data volume in ways that pit comprehensive monitoring against budget constraints, pushing teams toward sampling data or excluding systems just to control cost, which undermines the visibility they were trying to buy in the first place.
Middleware’s pricing is usage-based: a 14-day free trial with unlimited ingestion, then $0.30/GB pay-as-you-go. Knowing the cost in advance lets teams instrument fully instead of sampling data out of financial anxiety, and shifts the conversation from cost containment to value.
For teams consolidating multiple point solutions, the economics usually favor a unified platform. Cutting redundant tools reduces licensing costs while improving capability, and the total cost of ownership should account for operational efficiency gains, not just license fees.
Before Middleware, we were using multiple tools to track logs, metrics, and performance, which made troubleshooting slow and confusing. Middleware brings all of that into one platform, so we can easily detect and fix issues without jumping between tools. It has improved our team’s efficiency, reduced downtime, and given us more confidence in our systems. Plus, their pricing model is transparent, which helped us reduce monitoring costs.
Engineer at SLRTCE
Key takeaways
- AI-driven anomaly detection catches issues like memory leaks before they cascade into outages, shifting teams from reactive firefighting to proactive prevention
- Unified observability eliminates tool sprawl by correlating logs, metrics, and traces in a single view, compressing mean time to resolution
- Fast deployment for Kubernetes and Docker environments means teams see value in minutes rather than weeks
- Predictable, usage-based pricing removes the tension between full instrumentation and budget constraints
- Dashboard density is a real learning curve, but manageable with templates and customization
Proactive infrastructure monitoring depends on two capabilities working together: unified visibility that removes context switching during an incident, and intelligent alerting that surfaces problems before they reach users. The memory leak caught before it became an outage is a working example of that shift, from postmortem analysis to early intervention, from multi-hour troubleshooting to fast root cause identification. For DevOps and SRE teams running containerized microservices at scale, that translates directly into better uptime, less operational burden, and fewer fire drills interrupting planned work.
Want to go deeper on how leaks form and how to catch them in your own code before they ever reach production? See the full guide to memory leaks for common causes, detection methods, and prevention techniques across frontend, backend, and Kubernetes environments.
FAQs
What is the difference between reactive and proactive monitoring?
Reactive monitoring alerts you after a threshold is crossed and a symptom is already visible, such as a response time spike. Proactive monitoring uses anomaly detection to learn normal system behavior and flag deviations early, often before any hard threshold is breached, giving teams time to intervene before users are affected.
How does AI-based anomaly detection catch a memory leak before it causes an outage?
Anomaly detection continuously baselines normal resource usage patterns. A memory leak typically shows up as a slow, steady climb rather than a sudden spike, which a fixed threshold alert would miss until the pod is close to exhaustion. AI-based detection flags that gradual deviation from baseline early, before it triggers pod crashes or cascading failures.
What causes alert fatigue, and how do you avoid it?
Alert fatigue happens when teams receive high volumes of low-value or duplicate alerts and start ignoring notifications altogether, including the ones that matter. Avoiding it requires alerting that understands context and baseline behavior, so it surfaces fewer, higher-confidence alerts instead of flagging every threshold crossing.
How long does it take to set up Kubernetes and Docker monitoring with Middleware?
Most teams get real-time metrics, logs, and traces flowing within minutes of deploying the agent, with auto-instrumentation covering application performance without additional setup work.
Why does unified observability reduce mean time to resolution?
MTTR drops mainly because engineers skip the manual correlation phase. When logs, metrics, and traces already live in one view, there is no need to switch tools and manually line up timestamps to find a root cause, which is usually where the most time is lost during an incident.
How is Middleware’s pricing structured?
Middleware offers a 14-day free trial with unlimited data ingestion, then usage-based pricing at $0.30/GB pay-as-you-go, so costs scale with actual data volume rather than per-host or per-user fees.
Can Middleware monitor hybrid environments with legacy applications alongside microservices?
Yes. Most enterprise environments are hybrid, and connecting legacy systems alongside modern microservices takes some additional setup, but the resulting unified visibility across both is generally worth the effort.
Is a memory leak the same thing as an OOMKilled pod in Kubernetes?
No. A memory leak is the underlying cause, memory usage climbing steadily because something is not being released. OOMKilled is the effect: Kubernetes exit code 137, triggered when the kernel’s Out-of-Memory manager kills a container after it hits its memory limit. A leak that goes undetected long enough eventually results in an OOMKilled pod. For a deeper look at OOMKilled causes and auto-remediation, see how OpsAI handles pod crash auto-remediation.
How does anomaly detection avoid flooding teams with false positives?
Middleware’s log anomaly detection combines time series analysis, spotting unusual frequency patterns, with semantic analysis of the actual log content, and only flags an anomaly once the ratio of anomalous to total logs crosses a defined threshold in a given window. That combination is what keeps the false-positive rate low compared to a single static rule.