API monitoring tracks key metrics like response time, latency, error rates, and uptime to prevent downtime in API-dependent systems. The following tools are ranked based on features, usability, and user reviews to help teams choose the right solution.
APIs power 83% of traffic; choose API monitoring tools wisely to avoid $100K/hour outages.
Want to learn more about API monitoring? Check out our API Monitoring Guide
Best API Monitoring Tools at Glance
Here are some of the best API monitoring tools used by DevOps and engineering teams.
| Tool | Free Tier | Starter Price | Key Strength | Best For |
| Middleware | Yes 14 days Free Trial | $0.3/GB | AI Alerts & Ops AI SRE Agent | Real-time RCA |
| Treblle | Yes | $77/mo | Auto-Docs | API Dev Teams |
| Sematext | Pay-Go | $29/mo | Anomaly Alerts | Hybrid Clouds |
| Better Stack | Yes | $25/mo | Incident Mgmt | Teams w/ Integrations |
| Datadog | No | $5/test | 400+ Integrations | Enterprise Scale |
| SigNoz | Open-Source | $199/mo | Unified Logs/Traces | Microservices |
| New Relic | Pay-Go | $30/month | Full-Stack View | Cross-Team Debug |
| Prometheus | Yes (OSS) | Free | Time-Series Data | Cloud-Native |
| AlertSite | No | $1,828/yr | Global Monitoring | Custom Scripts |
| Moesif | Yes | $60/mo | Usage Analytics | Billing Insights |
| AppDynamics | No | $60/CPU | Workflow Testing | Microservices |
| Dotcom-Monitor | No | $29.99/mo | Transaction Checks | E-commerce APIs |
Top 12 API Monitoring Tools
Here are the best API Monitoring tools this year, as per user reviews:
1. Middleware
Middleware is a premier API monitoring and observability platform that empowers developers to troubleshoot API issues in real time. With endpoint monitoring, zero-code auto-instrumentation, and AI-powered workflows, it helps teams quickly identify problems and perform root cause analysis across cloud, on-prem, and hybrid environments.
Some of the key features of Middleware that make it an ideal API monitoring tool are:
Uptime and Performance Tracking
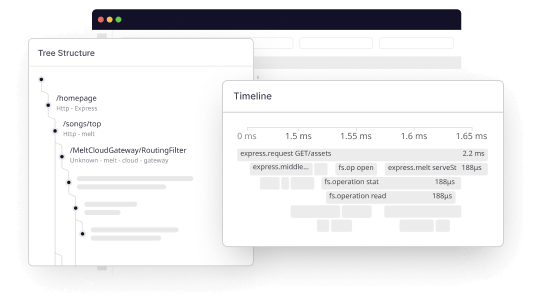
Middleware is a full-stack observability platform that allows you to track the performance of your APIs at various network levels (HTTP, SSL, DNS, TCP, Websocket, UDP, ICMP, and gRPC).
Middleware now offers Endpoint Monitoring, automatically detecting API routes and linking them to your OpenAPI/Swagger documentation. This provides per-endpoint metrics such as error rate, volume, and latency, making root-cause analysis faster and more precise.
Having a detailed breakdown of network timing data and response times by location helps with faster root-cause analysis.
Service Monitoring
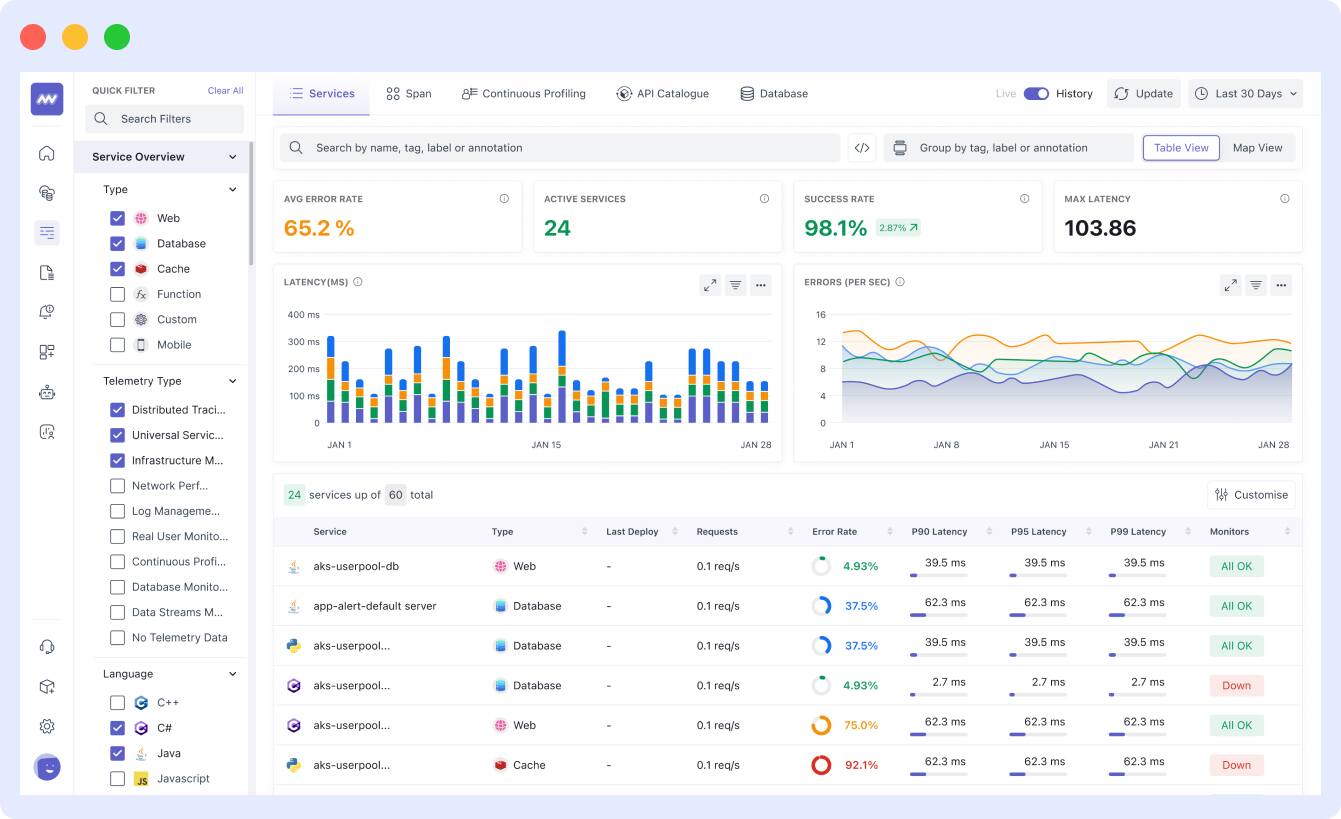
Each API’s performance impacts overall service and application health. Middleware monitors metrics like request volume, error and success rates, and latency. Zero-code auto-instrumentation for Python, Node.js, Java, .NET, and Go (via OpenTelemetry) makes setup simple, while integrations with AWS, Datadog, Kubernetes, and other cloud services provide a unified monitoring experience.
Instant Root Cause Analysis and Error Trace
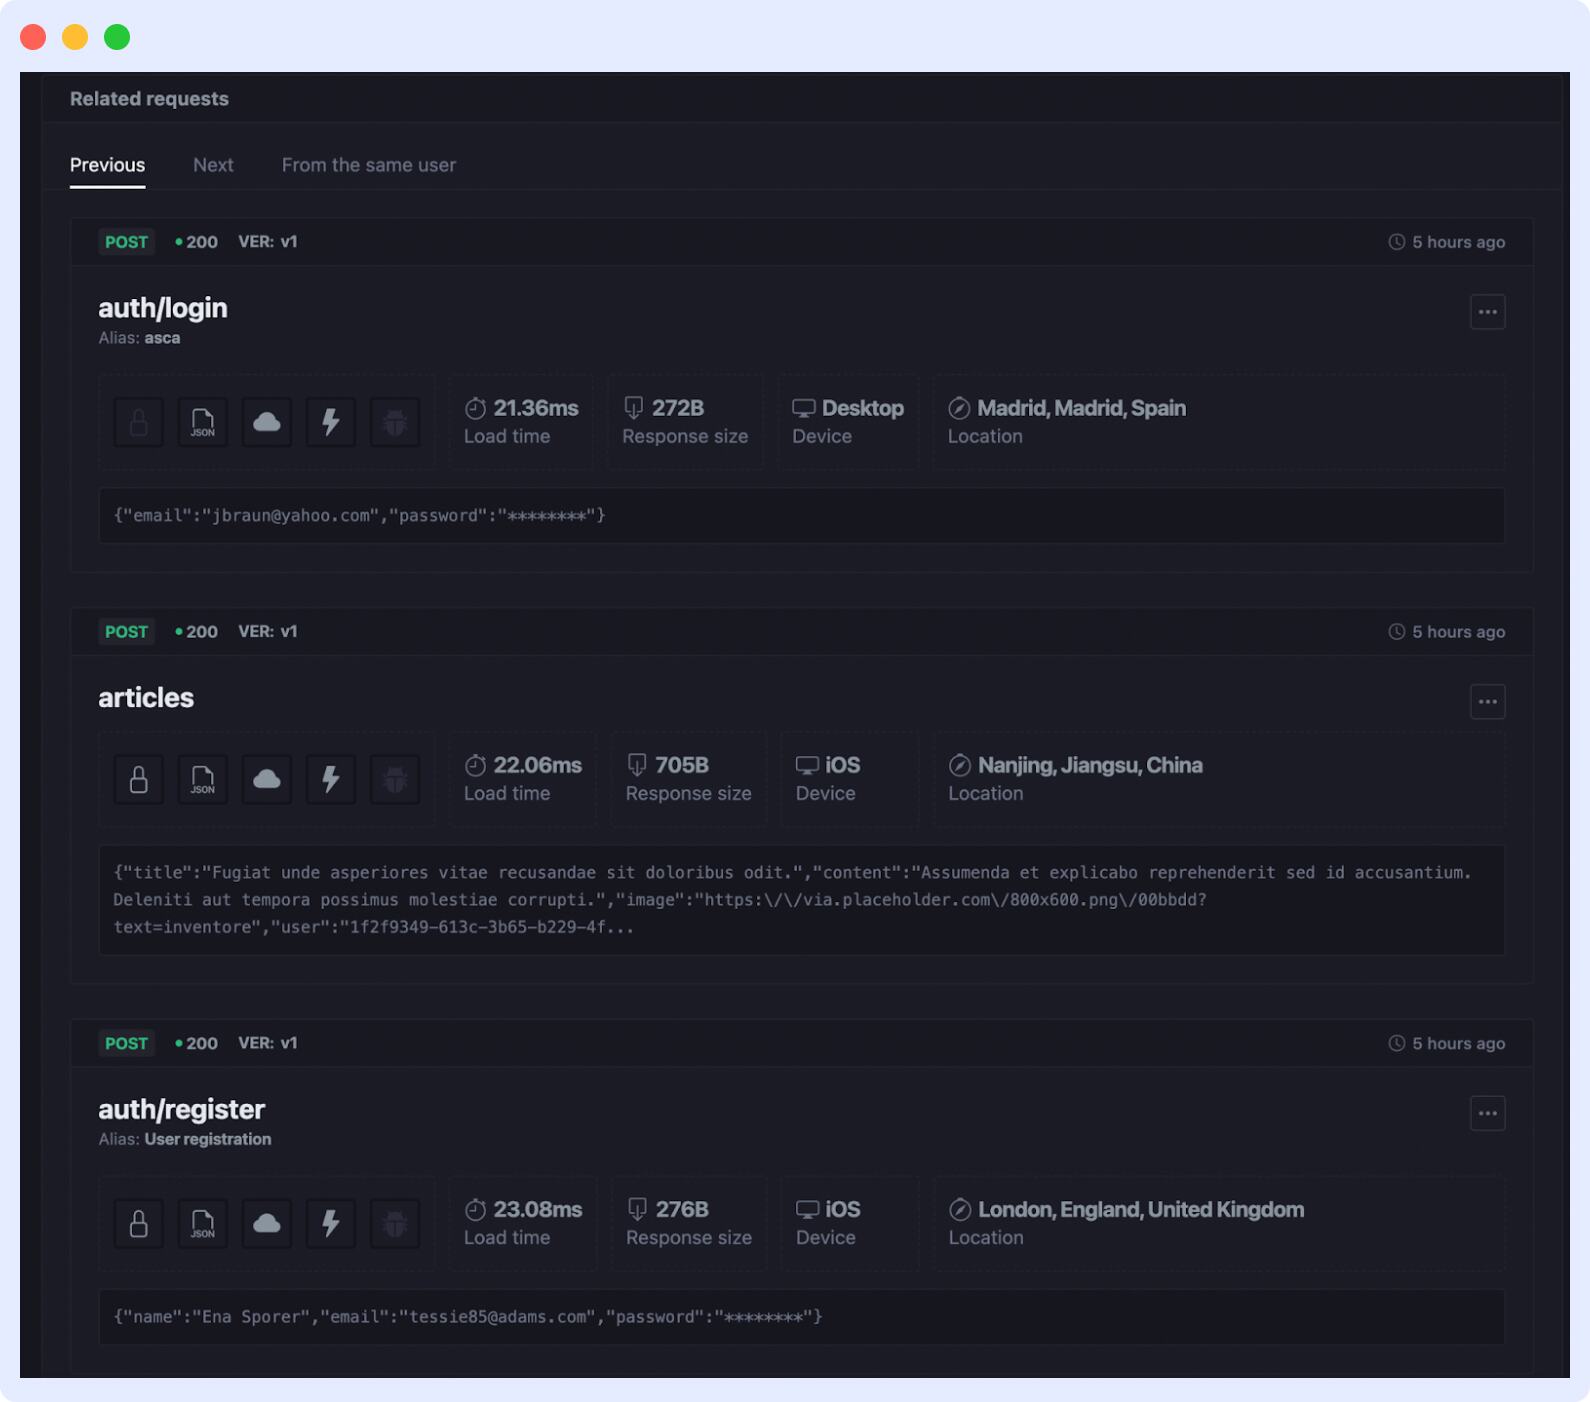
The error tracking explorer shows issues detected by Middleware, including total error count and frequency over time. AI-powered OpsAI workflows suggest probable root causes and highlight the most critical errors, reducing time to resolution and helping teams fix problems faster.
Having these error details and proper attributes can help you quickly identify the root cause behind any error.
AI-Powered Alerts
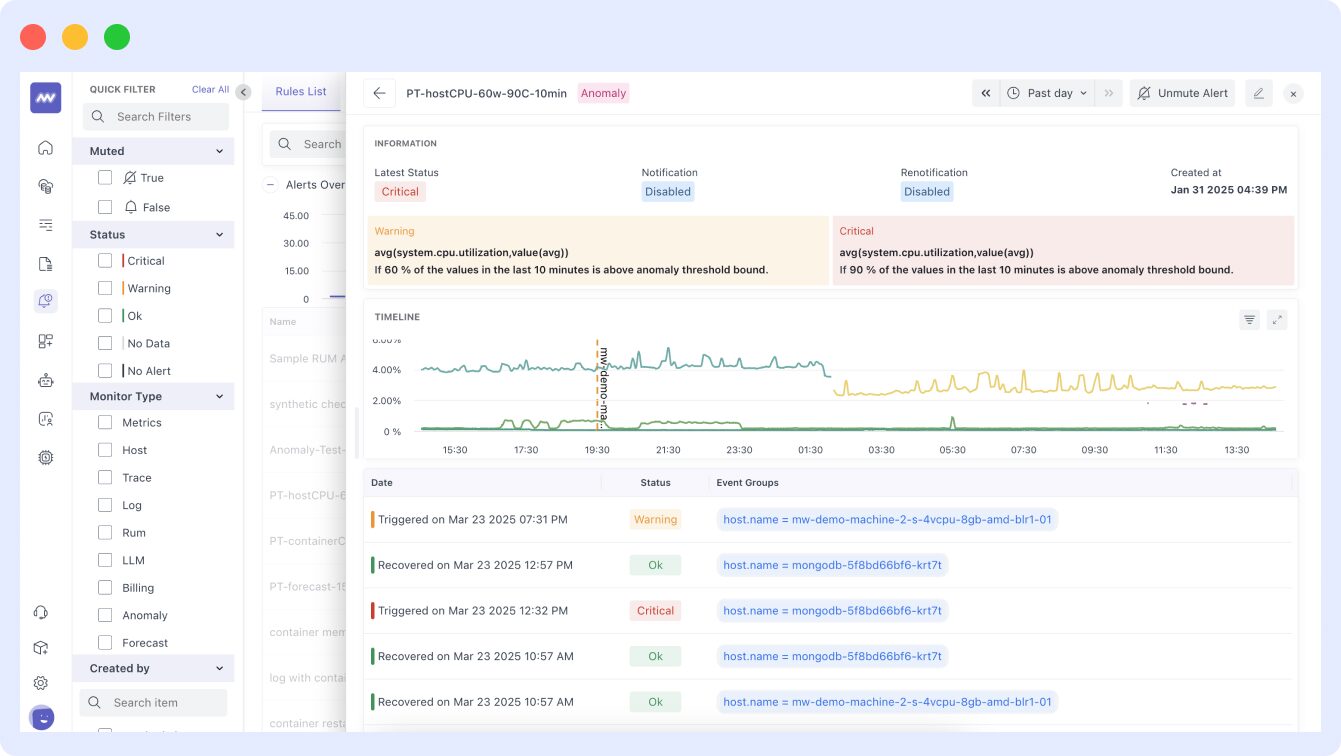
Middleware lets you set smart AI-powered alerts based on response time, response codes, and anomaly detection. When thresholds are triggered, notifications are sent via Slack, Microsoft Teams, Email, or your preferred channel. AI alerts can also suggest actionable next steps, helping your team respond proactively.
Pros
- Supports cloud, on-premise, and hybrid deployments
- Zero-code auto-instrumentation for multiple languages
- Endpoint Monitoring for detailed route-level insights
- 24/7 support via email, chat, and call
- Unified view reduces issue identification time
- Correlates metrics, logs, and traces for faster root cause analysis
- GDPR, CCPA, and SOC 2 compliant
Cons
- Middleware continues to expand its integration ecosystem and feature set, which means new users may need a short learning period to explore advanced capabilities like Endpoint Monitoring and OpsAI workflows.
Pricing
Middleware provides a transparent and flexible pricing structure tailored to users’ specific needs. Middleware offers a 14-day free trial with unlimited data ingestion, making it ideal for teams getting started.
Their pay-as-go plan costs $0.3 per GB for logs, metrics and traces. Plus, Real user monitoring starts at $1 for 1000 RUM sessions, and synthetic monitoring starts at $1 per 5000 synthetic checks.
Start monitoring your APIs for free. Get Started.
Middleware is well-suited for teams that need complete observability across APIs, applications, logs, and infrastructure from a single platform.
2. Treblle
Treblle is a real‑time API observability and intelligence platform that helps Engineering and Product teams monitor, secure, analyze, and document APIs in one place. It provides complete visibility into API requests and responses, error patterns, performance metrics, and usage trends so you can spot issues faster and optimize API behavior.
- Real‑time API request and response logging with detailed metadata like headers, payloads, latency, and status codes.
- Automatic API documentation and governance scoring across your entire API portfolio.
- Security and compliance analysis, including data masking and compliance tracking (e.g., GDPR, PCI DSS, HIPAA).
- Integrates with 20+ languages and frameworks via SDKs (Node.js, Python, PHP, Java, .NET, Go, etc.).
Pros
- Lightweight
- 1-click API request testing
- Auto-generated API documentation
- Quality, security & performance tracking
- Real-time problem detection
Cons
- Treblle may have limited integration options compared to more extensive API development tools.
- Some advanced analytics and governance features are only available in higher plans.
- Data retention is limited on lower plans (7–30 days)
- Teams unfamiliar with API observability may require a short onboarding period to use its full power.
Pricing
- Free- $0
- Starter- $25
- Team- $233
Treblle is ideal for engineering and product teams that want to monitor API requests, improve API quality, and gain insights into API usage with minimal setup.
3. Sematext
Sematext offers comprehensive cloud monitoring tools that provide visibility into APIs, applications, logs, infrastructure, and user experience. It helps engineering teams monitor API performance, detect anomalies, and troubleshoot issues using logs, metrics, distributed tracing, and synthetic monitoring from a single platform.
With integrations across major cloud and container platforms, including Kubernetes, Docker, AWS, and Azure, Sematext enables monitoring of private, public, and hybrid cloud environments while centralizing observability for infrastructure, applications, APIs, and user experience.
- Provides distributed tracing to monitor end-to-end request execution across services, containers, and microservices.
- Real-time alerts and anomaly detection notify teams when API performance or uptime deviates from expected thresholds.
- Correlates logs, metrics, traces, and events in one platform to provide deeper insights into performance issues.
- Supports log ingestion via log4j, logback, syslog, and other log shippers, while enabling visualization through dashboards and integrations with Grafana and other analytics tools.
- Real User Monitoring (RUM) tracks actual user interactions with applications and APIs to understand frontend performance and user experience.
Pros
- Unified monitoring for logs, metrics, traces, and APIs
- Synthetic monitoring for APIs and web applications
- Real-time alerts and anomaly detection
- Kubernetes and container monitoring support
- Intuitive dashboards and visualization tools
- Strong integrations with cloud platforms and DevOps tools
Cons
- Distributed tracing support is stronger for some languages than others
- Pricing may become expensive for high-volume monitoring
- Some users report a learning curve when navigating metrics and dashboards
Pricing
- Pay-As-You-Go:
- $2per HTTP monitor
- $7per Browser monitor
- Standard Starts at- $29/month
- Pro Starts at – $99/month
Sematext is particularly suitable for teams looking for a unified observability platform that combines API monitoring, logs, metrics, and synthetic monitoring in a single interface.
4. Better Stack
Better Stack is an observability and incident management platform that combines uptime monitoring, API monitoring, log management, and on-call incident response in a single solution. It helps teams detect API failures, investigate logs, and resolve incidents faster using automated alerts and collaborative workflows.
Better Stack integrates with popular tools and platforms such as Heroku, Datadog, New Relic, Grafana On-Call, PagerDuty, Opsgenie, AWS CloudWatch, Slack, and Google Cloud, enabling teams to connect monitoring alerts with their existing DevOps workflows.
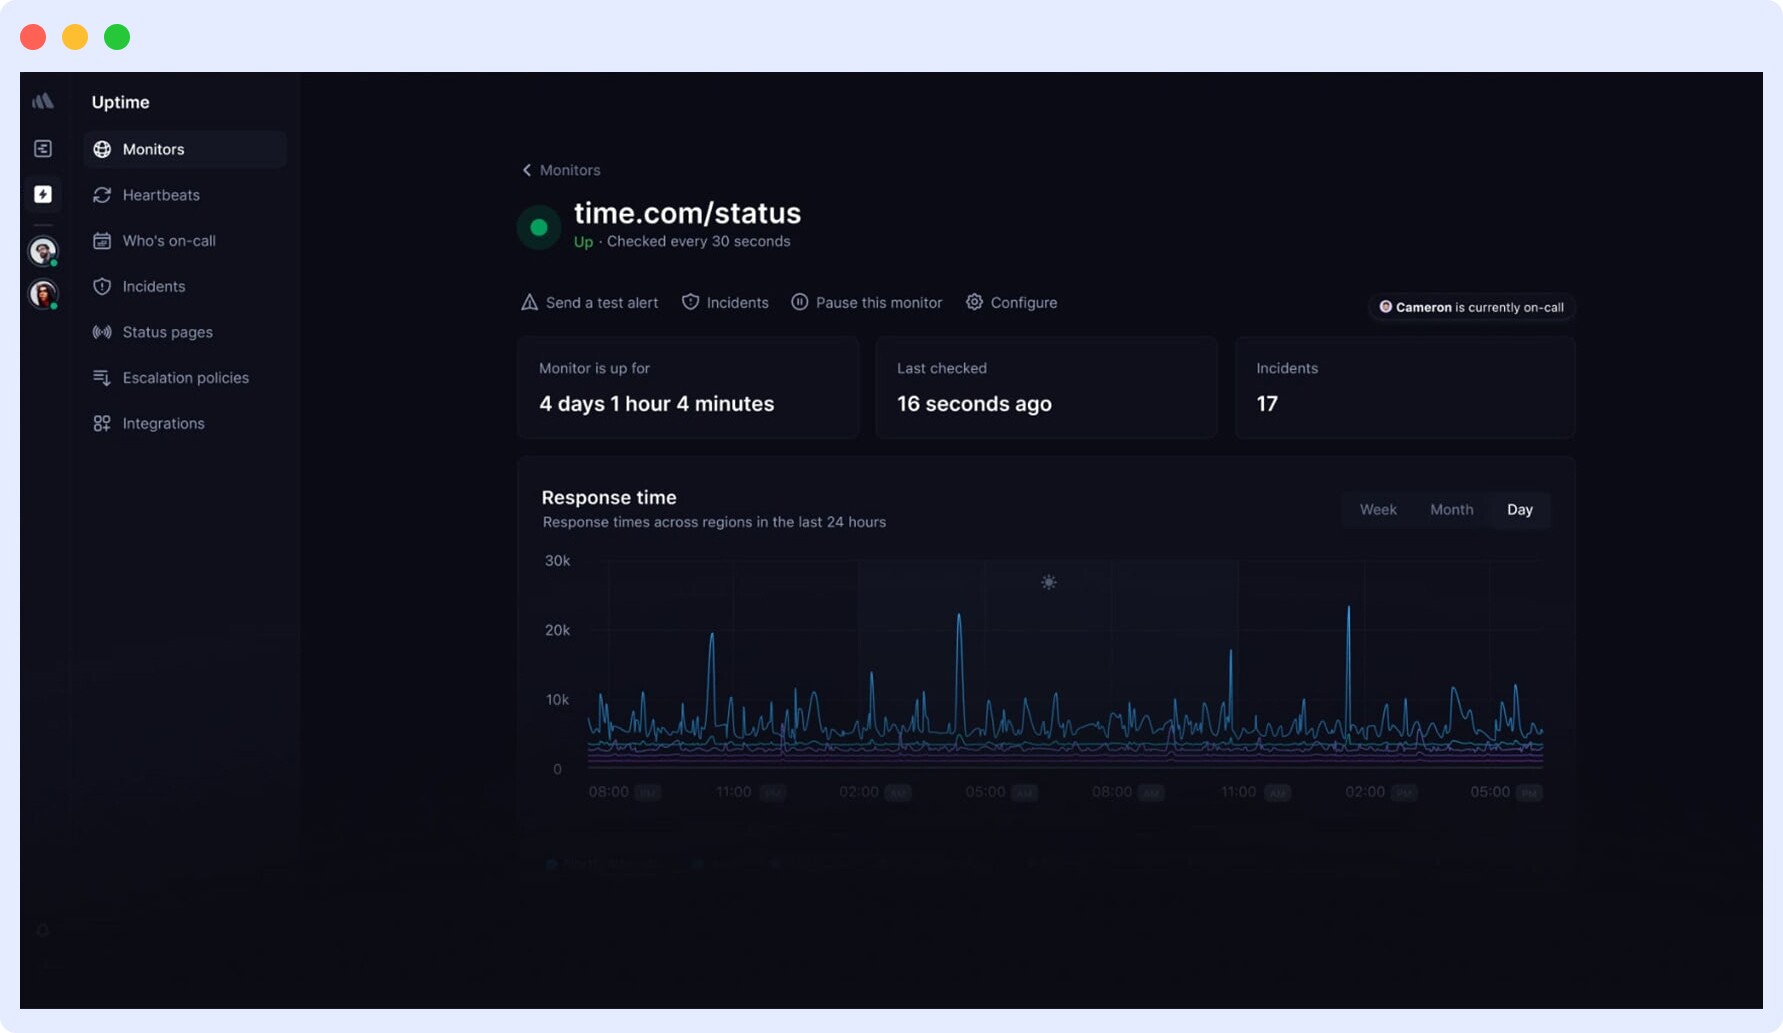
- Monitor Websites, APIs, servers, SSL certificates, ports, and DNS using uptime checks and synthetic monitoring to ensure service availability.
- Centralized log management aggregates logs into structured data and allows querying using SQL-like syntax powered by high-performance log storage.
- Collaborative dashboards and shared incident workflows allow teams to investigate issues together and resolve outages faster.
- Built-in incident management tools include on-call scheduling, automated alerts, and customizable status pages to improve incident response.
- Alerts are verified from multiple global monitoring locations to reduce false positives and ensure reliable incident detection.
- eBPF-based tracing enables deeper insights into application performance without requiring complex instrumentation.
Pros
- Unified platform for uptime monitoring, logs, and incident management
- Real-time alerts and automated incident workflows
- Global uptime monitoring with multi-location verification
- Integrations with major DevOps tools and cloud platforms
- Intuitive dashboards and fast log search capabilities
Cons
- Advanced observability features may require higher-tier plans
- Status page customization options are somewhat limited compared to dedicated status page tools
- Large teams may require additional configuration to manage alerts effectively
Pricing
- Basic – Free
- Freelancer – $25 /mo
- Small Team – $85 /mo
- Business – $170 /mo /team
Better Stack is ideal for teams looking for a combined solution that includes uptime monitoring, incident management, and log observability in a single platform.
5. Datadog
Datadog is a cloud-based observability platform that provides monitoring for applications, APIs, infrastructure, logs, and user experience in a single dashboard. It uses distributed tracing and AI-driven insights to help teams detect performance issues, identify root causes, and improve system reliability.
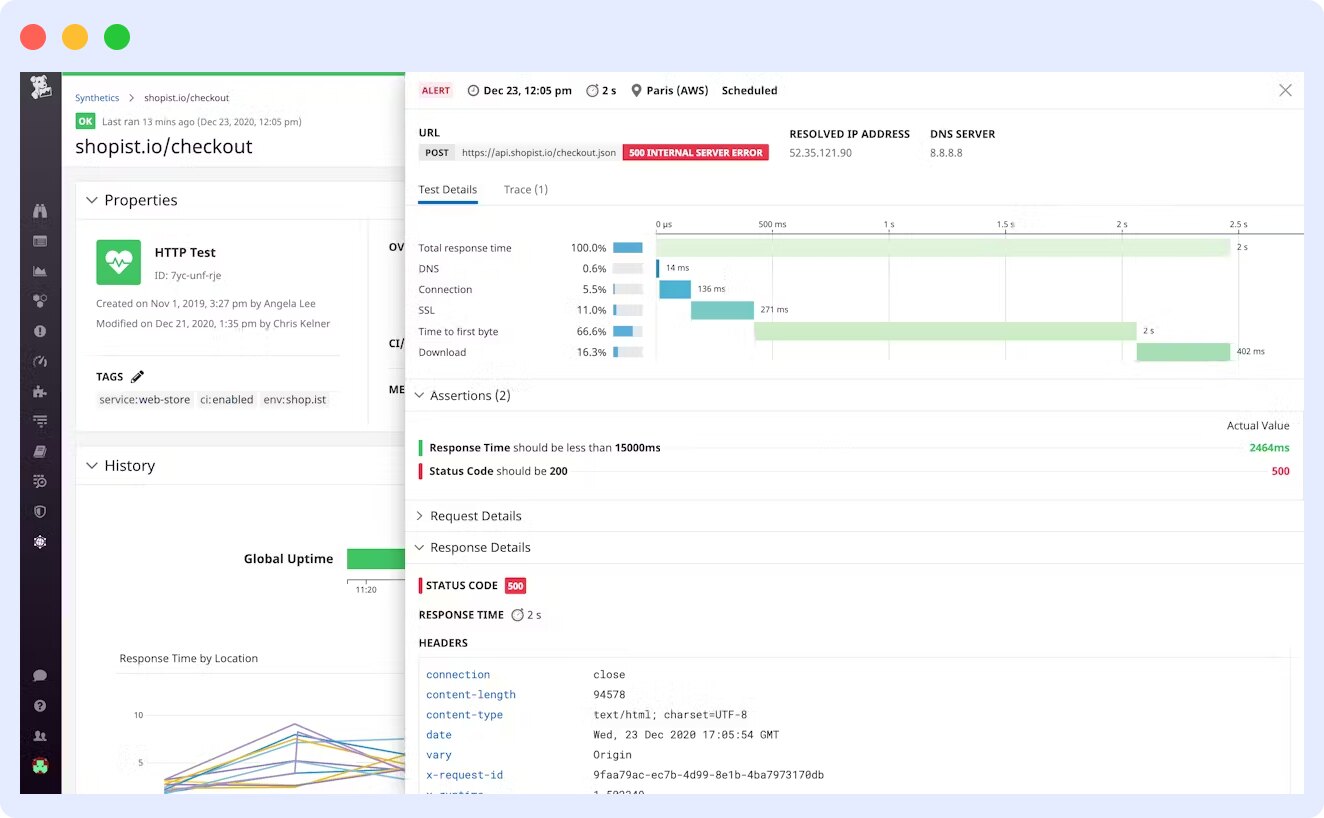
- Datadog provides 1000+ integrations with cloud platforms, databases, containers, DevOps tools, and third-party services.
- Real-time trace search helps teams quickly investigate API requests, application transactions, and system performance issues.
- Real User Monitoring (RUM) collects user experience metrics to measure application performance and its impact on business outcomes.
- Built-in security monitoring features help detect vulnerabilities and track suspicious activity across applications and infrastructure.
- Synthetic monitoring allows teams to simulate API requests and user journeys to proactively detect performance issues.
Pros
- End-to-end distributed tracing.
- Automated service mapping using application traces.
- Provides machine-learning-powered insights.
- Reduces resolution time with the Service Map.
- Scalable monitoring for large cloud infrastructures
Cons
- Pricing can become expensive as monitoring usage increases
- The platform may feel complex for new users due to its extensive features
- No self-hosted deployment option available
Pricing
- API Tests – $5/per 10k tests/month
- Browser Tests – $12/per 1000 tests run/month
- Mobile App Testing – $50/per month
- Additional pricing applies for infrastructure monitoring, logs, APM, and other observability features.
To learn more about detailed pricing plans and feature breakdowns, check out our complete guide on Datadog pricing.
Datadog is ideal for organizations that need advanced observability, a larger budget, powerful integrations, distributed tracing, and real-time monitoring across complex cloud environments.
6. SigNoz
SigNoz is an open-source observability platform that provides monitoring for logs, metrics, and traces in a unified interface. Built on OpenTelemetry, it helps engineering teams monitor application performance, troubleshoot issues, and gain insights into distributed systems and microservices.
It acts as an open-source alternative to traditional APM tools, enabling teams to monitor applications and microservices with distributed tracing, real-time metrics, and log analysis.
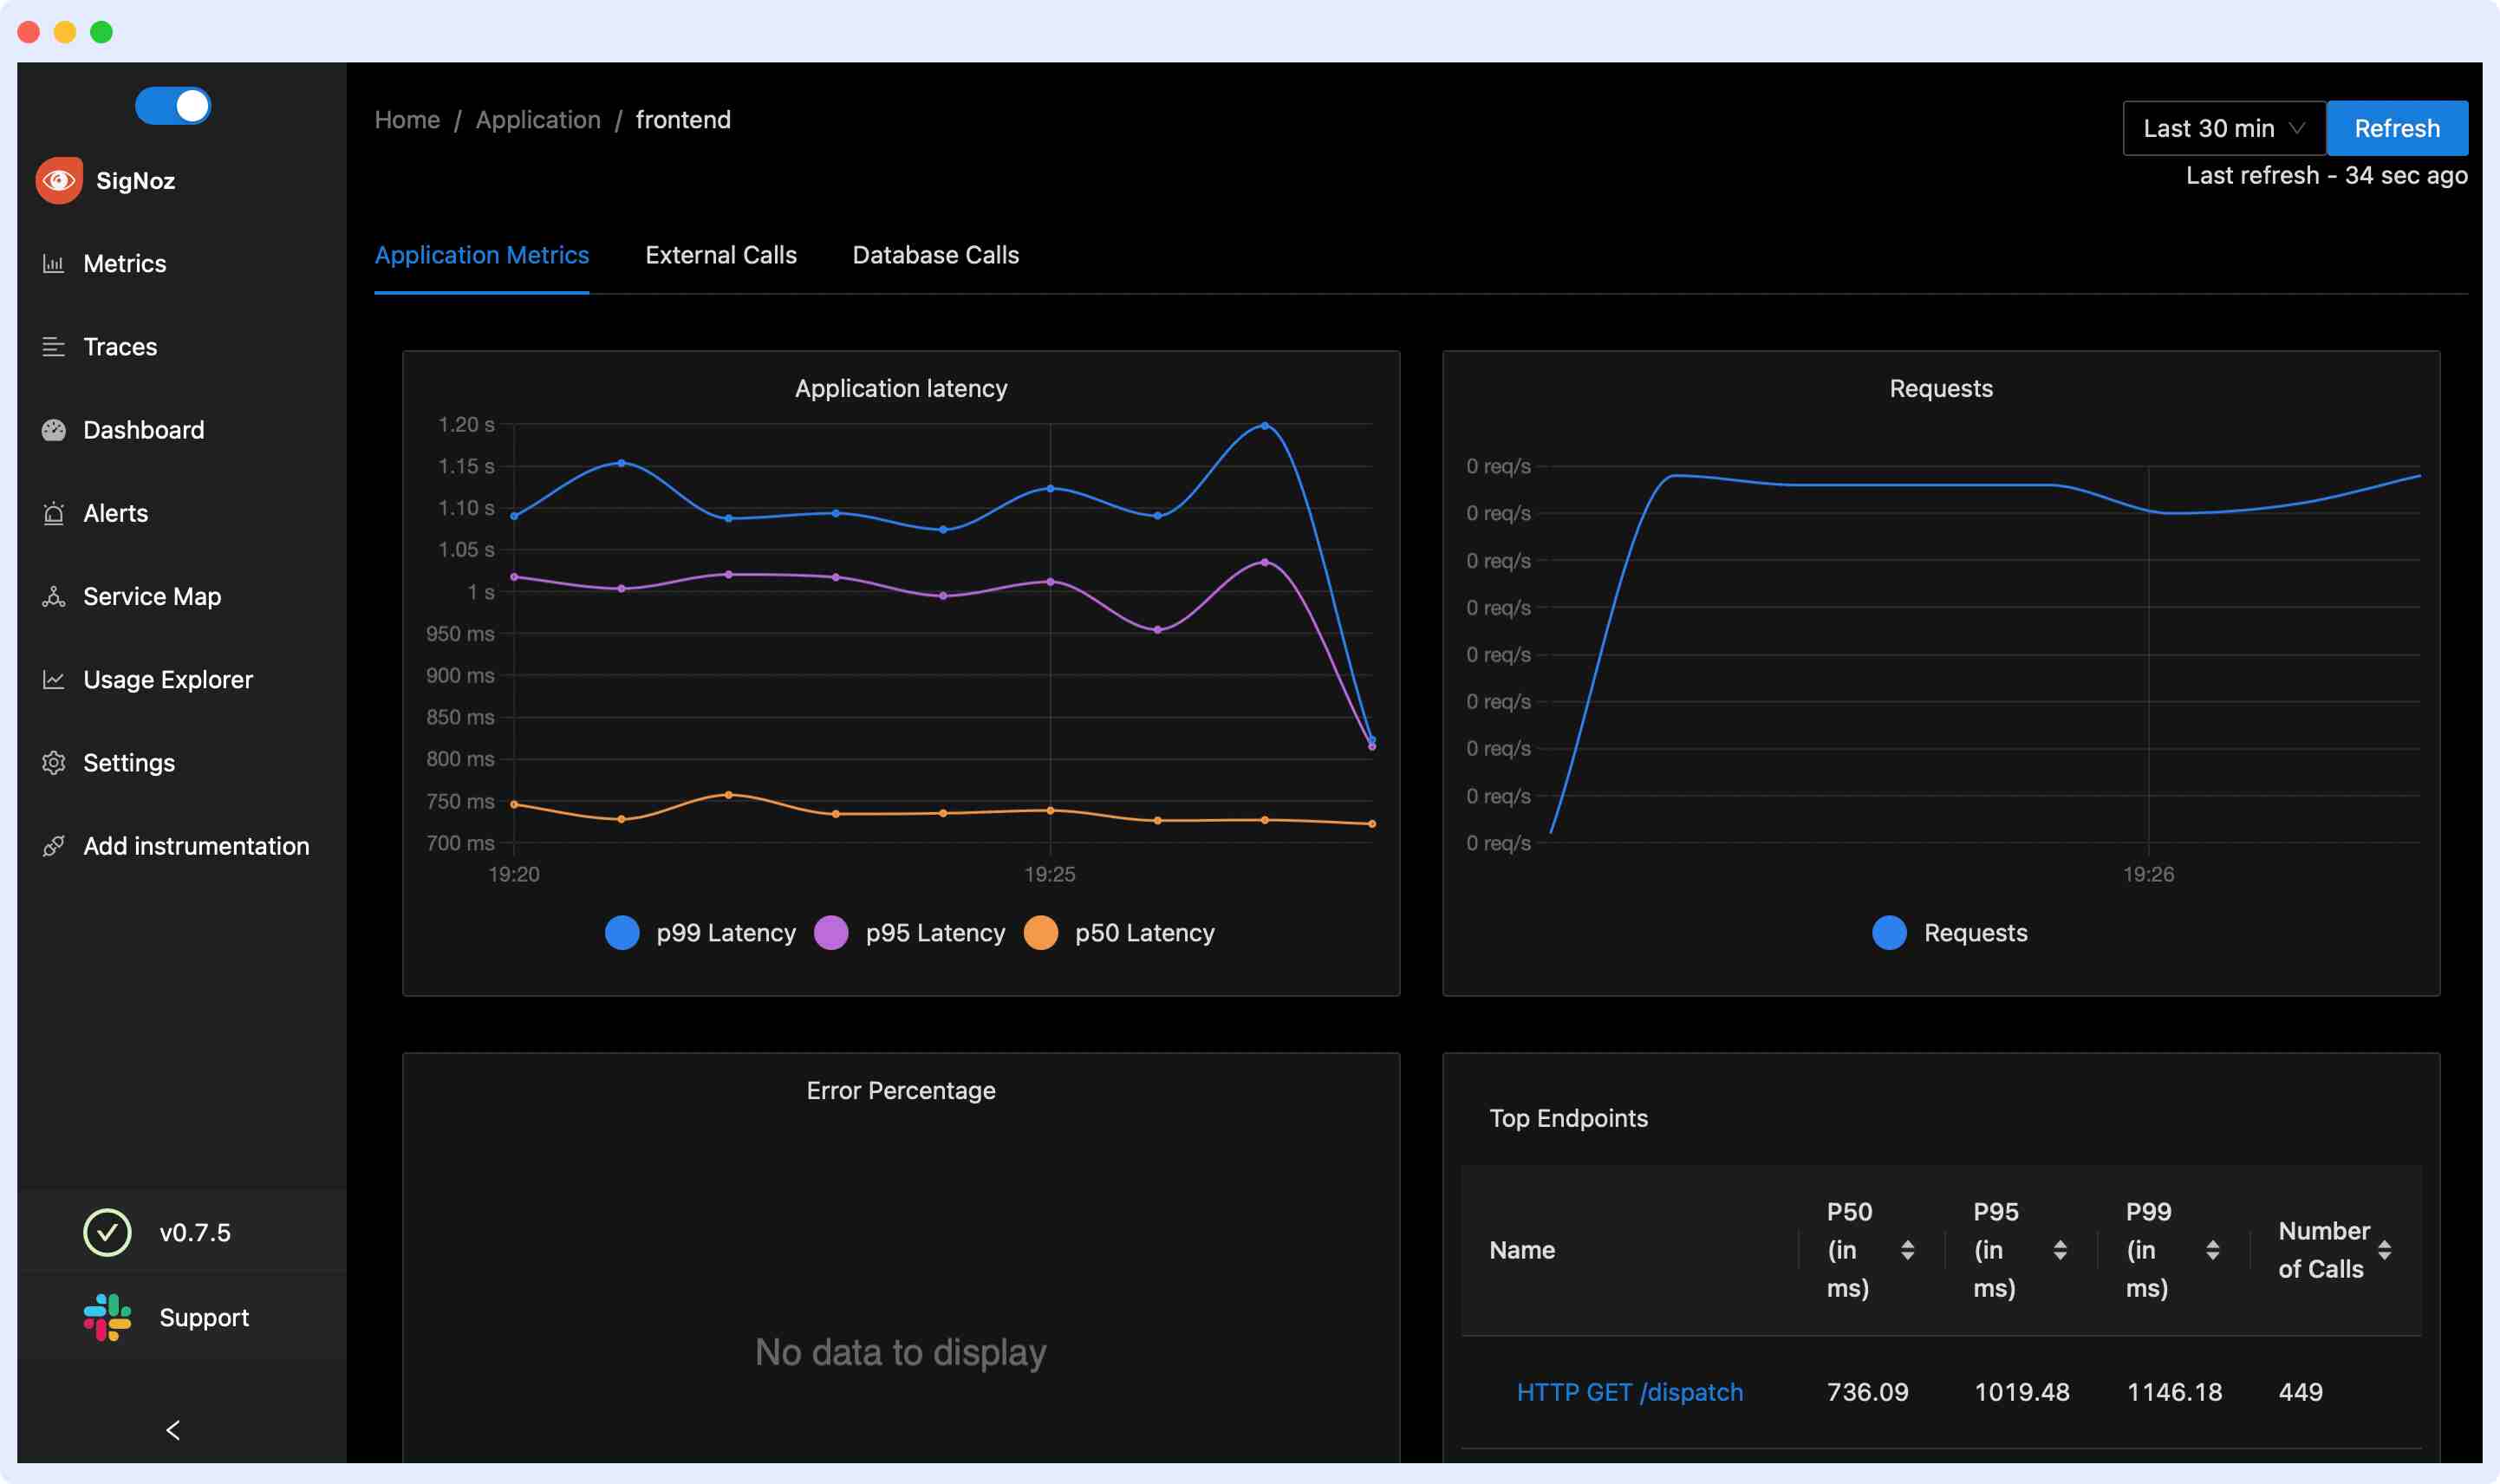
- Distributed tracing allows teams to track requests across multiple services and understand the complete transaction flow in microservice architectures.
- Tracks key performance metrics such as P95 and P99 latency, request throughput, and error rates to monitor API and application performance over time.
- Flexible data storage options allow teams to deploy SigNoz in different regions such as the US, EU, or India depending on compliance and security requirements.
- Uses high-performance columnar storage powered by ClickHouse for efficient querying and large-scale observability data analysis.
- Supports self-hosted deployments, allowing teams to maintain full control over monitoring data and infrastructure.
Pros
- Offers a unified view of logs, metrics, and traces, providing a holistic monitoring experience.
- Strong developer and open-source community support
- Scalable and modular architecture.
Cons
- Requires technical expertise for setup and maintenance
- Some advanced enterprise features are still evolving
- Smaller ecosystem compared to commercial observability platforms
Pricing
- Teams – Starts at just $199/Month
- Enterprise users- Offers tailored solutions with custom pricing structures to meet specific enterprise requirements.
SigNoz is a strong choice for teams looking for an open-source observability platform with distributed tracing, metrics monitoring, and flexible self-hosting options.
7. New Relic
New Relic is a cloud-based observability tool that provides monitoring for applications, APIs, infrastructure, logs, and user experience from a single dashboard. It helps engineering and DevOps teams detect performance issues, analyze system behavior, and improve application reliability.
It enables cross-functional teams to detect issues early, troubleshoot performance problems faster, and gain insights into application and API behavior using real-time observability data.
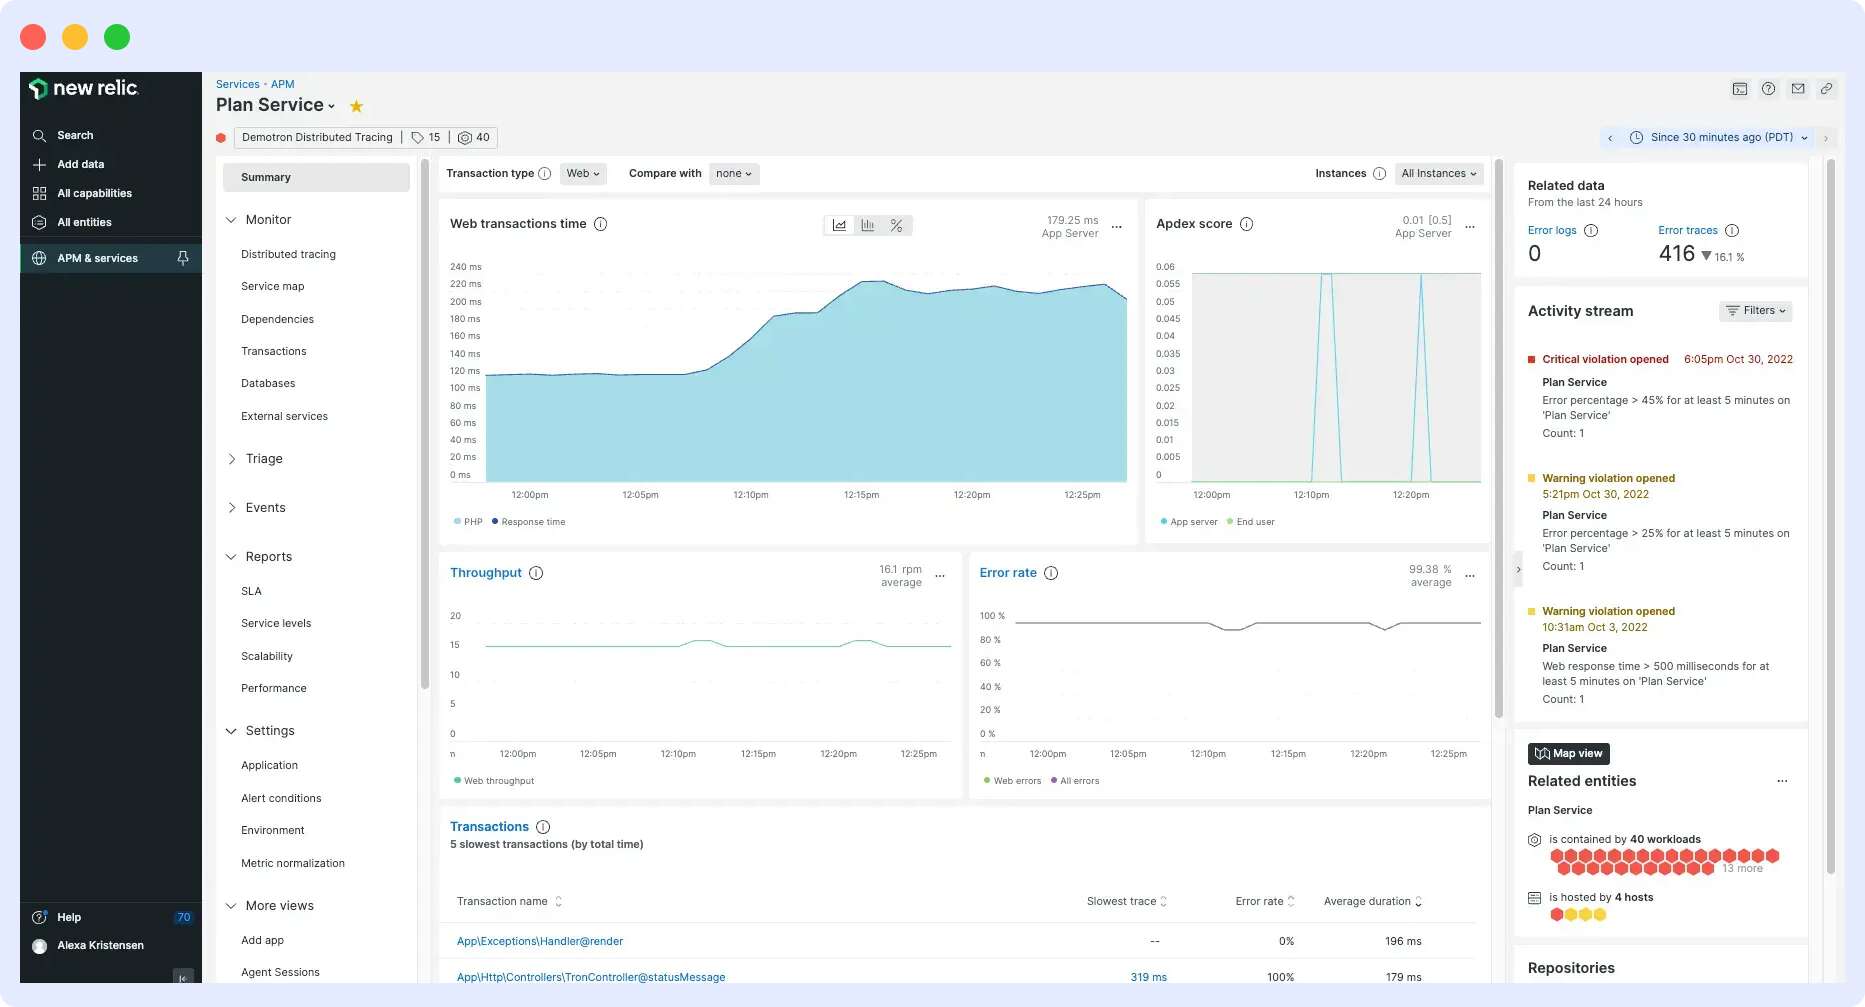
- Provides a consolidated view of API metrics such as response time, error rates, and throughput alongside application and infrastructure metrics.
- Real-time alerts notify teams when API performance drops below defined thresholds.
- Helps teams debug performance issues by correlating API latency, error rates, and response metrics with full-stack observability data.
- AI-powered insights and anomaly detection help identify unusual behavior and potential performance issues automatically.
Pros
- Unified monitoring for APIs, infrastructure, logs, and applications
- Real-time application and user experience insights
- AI-powered anomaly detection and alerts
- Highly scalable cloud observability platform
- Extensive integrations with cloud and DevOps tools
Cons
- Costs can increase significantly with higher data ingestion
- Some users find the dashboard interface complex to navigate
- Visualization tools may require customization for better usability
- Occasional data refresh or host detection issues have been reported
Pricing
New Relic offers a pay-as-you-go pricing model. Their pay-as-you-go plan costs $0.35 per GB for logs, metrics and traces after 100GB of data ingestion. Plus, $49-99 per user per month, per plan, for complete observability.
New Relic is an alternative to Datadog for teams seeking a scalable observability platform that delivers deep insights into API performance, application health, and user experience.
8. Prometheus
Prometheus is an open-source monitoring and alerting toolkit designed for cloud-native environments. It is widely used for monitoring APIs, microservices, and infrastructure in containerized platforms such as Kubernetes.
It collects metrics from applications and services in real time, helping teams monitor API performance, system health, and infrastructure reliability in modern cloud environments.
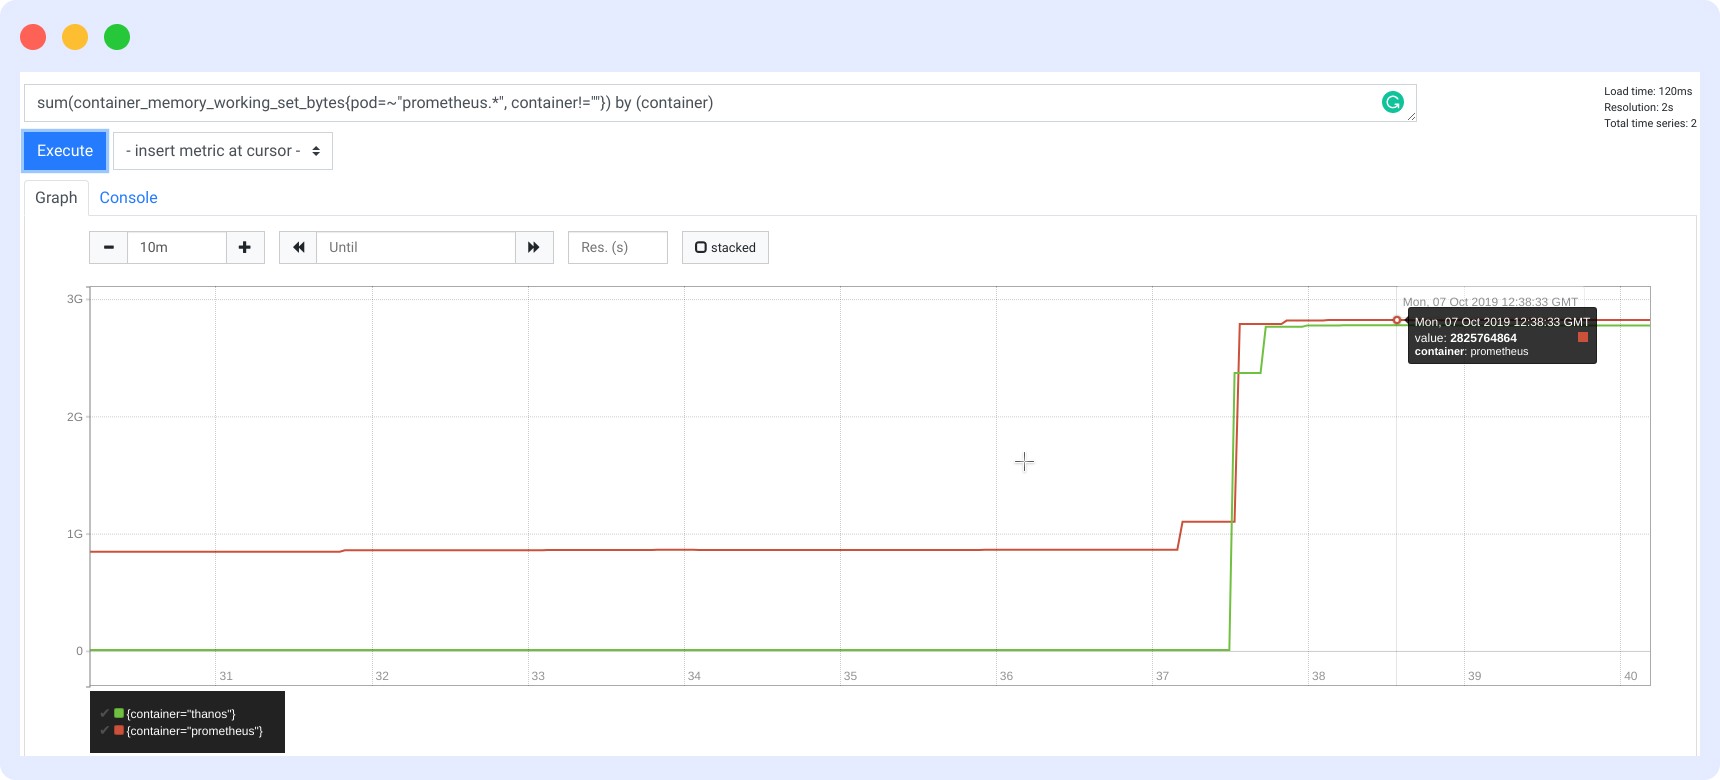
- Prometheus stores metrics as time-series data, allowing teams to analyze trends, monitor system performance, and detect anomalies over time.
- Its scalable architecture allows it to monitor dynamic cloud-native environments where services frequently scale up or down.
- Prometheus includes PromQL, a powerful query language that allows teams to retrieve, analyze, and visualize metrics for deeper performance insights and troubleshooting.
- Prometheus integrates seamlessly with visualization tools like Grafana to create interactive dashboards for monitoring application and API performance.
Pros
- Open-source and free to use
- Highly scalable monitoring for cloud-native systems
- Powerful query language (PromQL) for analyzing metrics
- Strong community support and extensive documentation
- Integrates well with visualization tools like Grafana
Cons
- Primarily focused on metrics monitoring rather than full observability
- Requires additional tools for logs and tracing
- Initial setup and configuration may be complex for beginners
Since Prometheus is open-source software, it can be deployed and used without licensing costs, though infrastructure and maintenance costs may apply.
9. SmartBear(AlertSite)
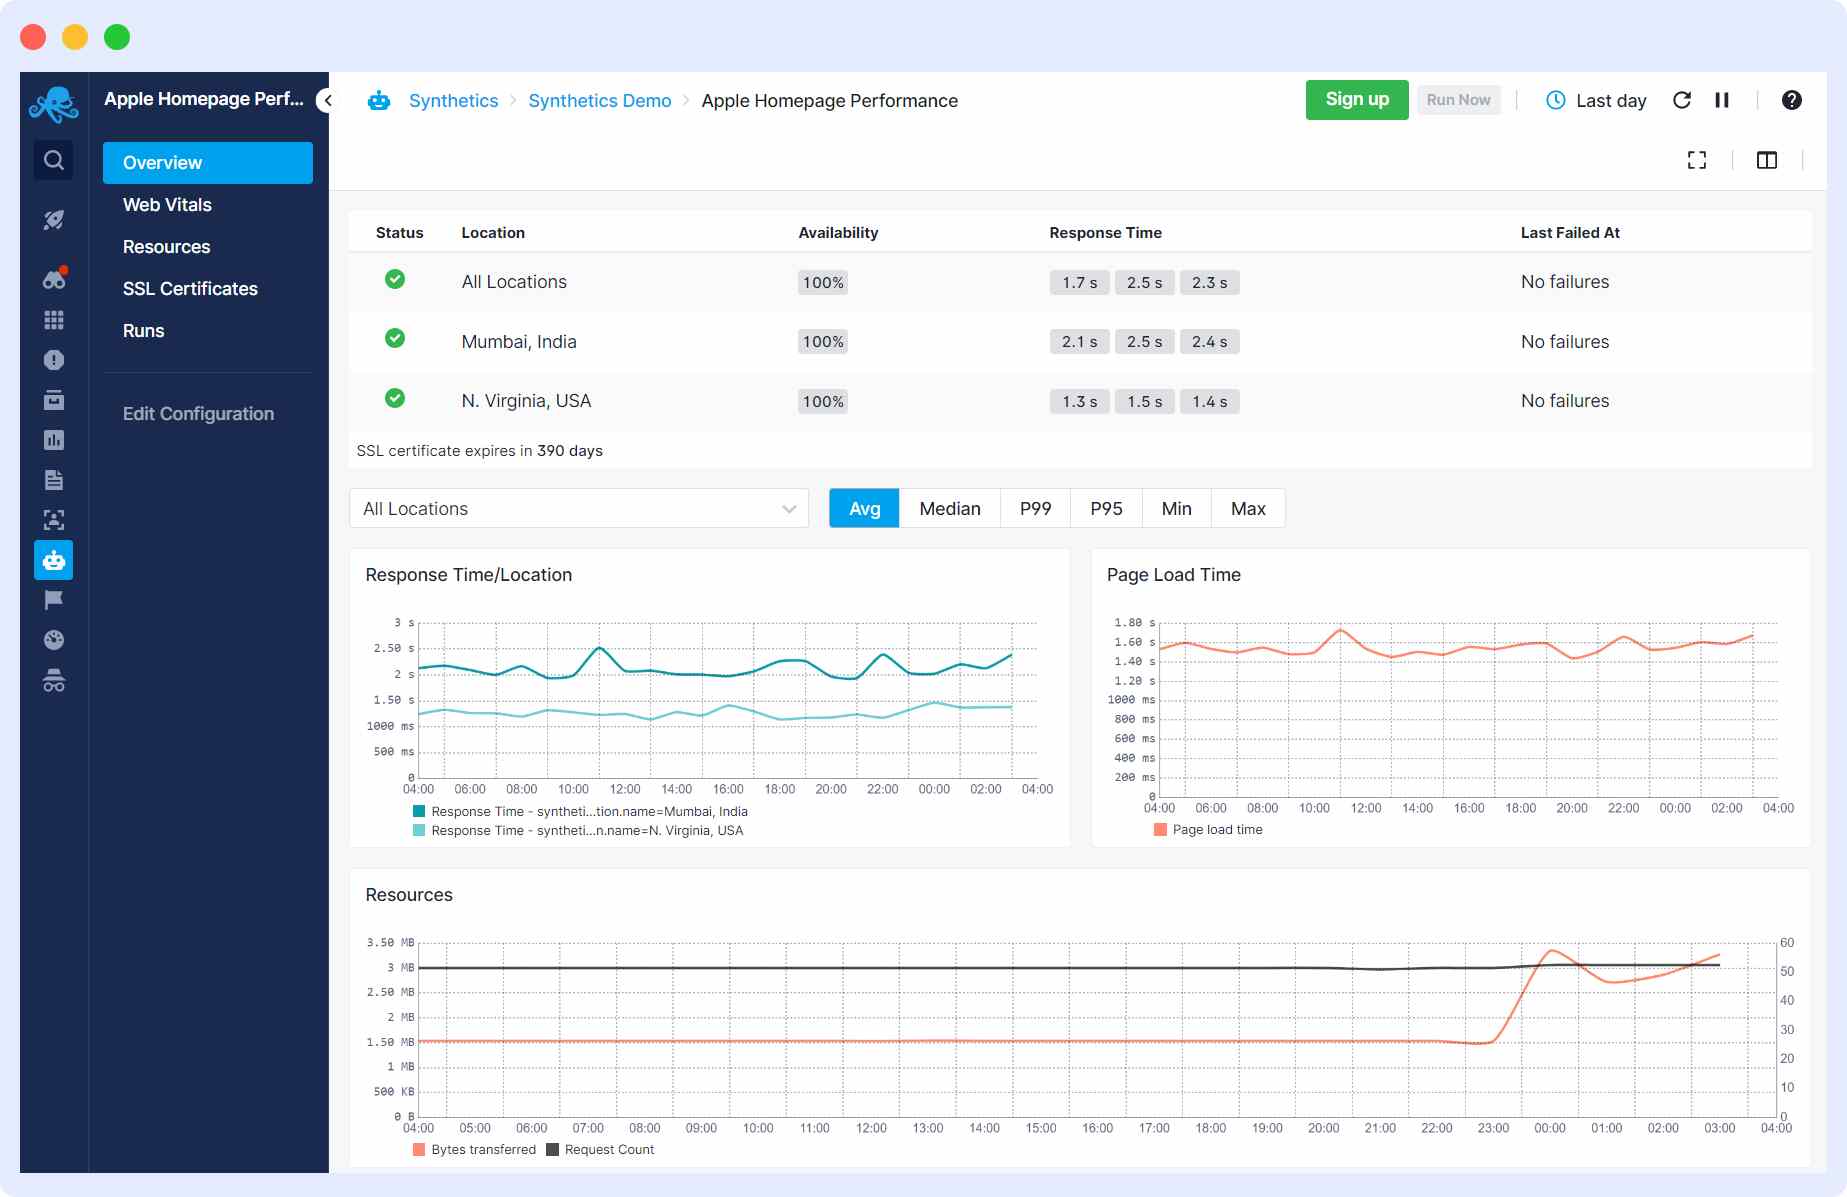
SmartBear AlertSite is a synthetic monitoring and API monitoring tool designed to track the performance, reliability, and availability of web applications and APIs across different locations and environments.
It provides real-time insights into application and API endpoint health, helping teams detect performance issues and resolve them before they impact users.
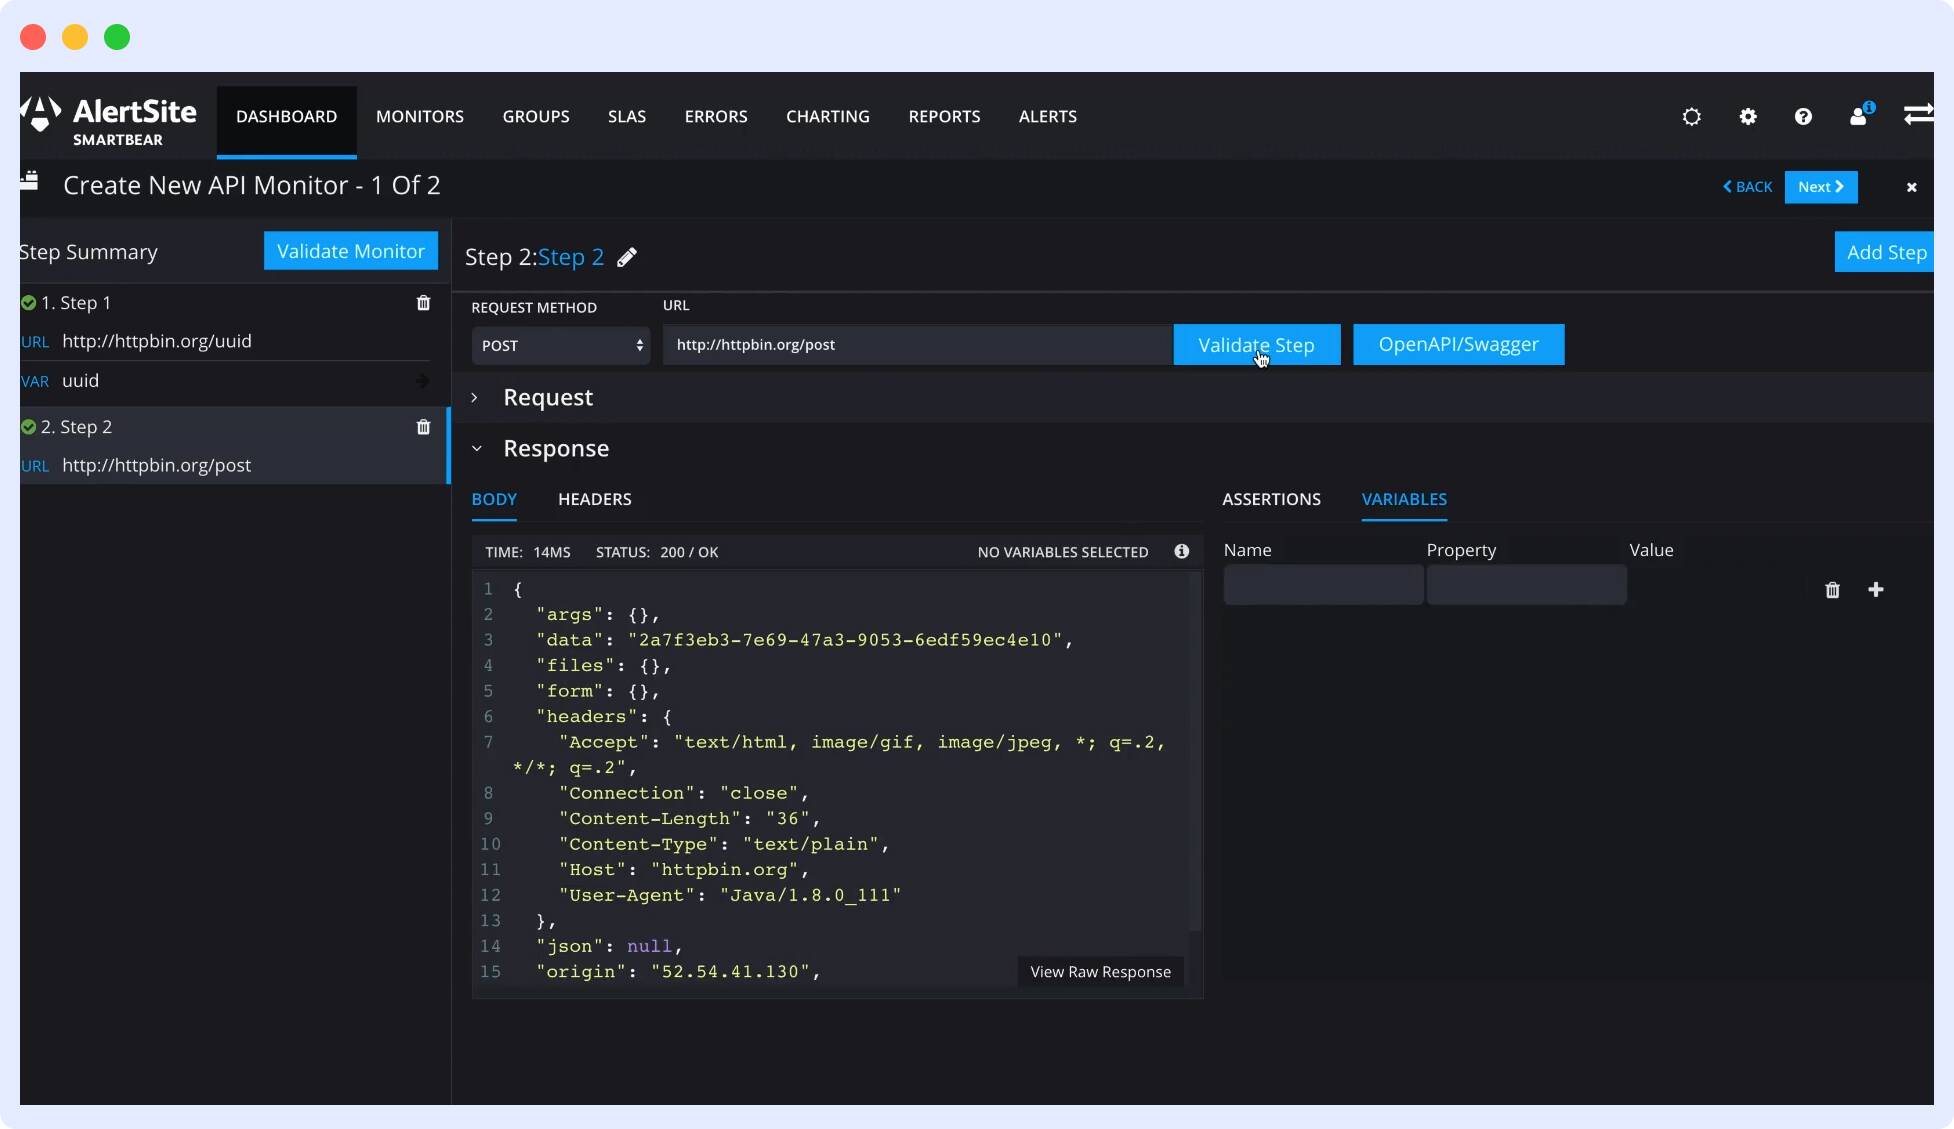
- Monitors APIs, websites, and web applications in real time to quickly detect performance issues or service disruptions.
- Generates detailed performance reports and analytics to help teams analyze API response times, uptime, and system behavior.
- Provides scripting capabilities that allow teams to create custom monitoring workflows and simulate complex user interactions.
- Uses a global monitoring network to test APIs and applications from multiple geographic locations.
Pros
- Global monitoring network for accurate uptime testing
- Supports integrations with DevOps and monitoring tools
- Detailed performance reports and analytics
- Flexible scripting options for custom monitoring scenarios
Cons
- Custom scripting may require technical expertise
- Pricing can be higher compared to some API monitoring tools
- Interface may feel complex for new users
Pricing
- Fixed Starting at $1,828
- Floating Starting at $3,655
SmartBear AlertSite is well suited for organizations that need reliable synthetic monitoring and global performance testing for APIs and web applications.
10. Moesif
Moesif is an API analytics and monitoring platform that helps organizations understand how their APIs are used, analyze API traffic, and optimize performance. It focuses on API usage analytics, user behavior insights, and monetization strategies.
It enables teams to analyze API consumption patterns, identify performance issues, and make data-driven decisions to improve API design and adoption.
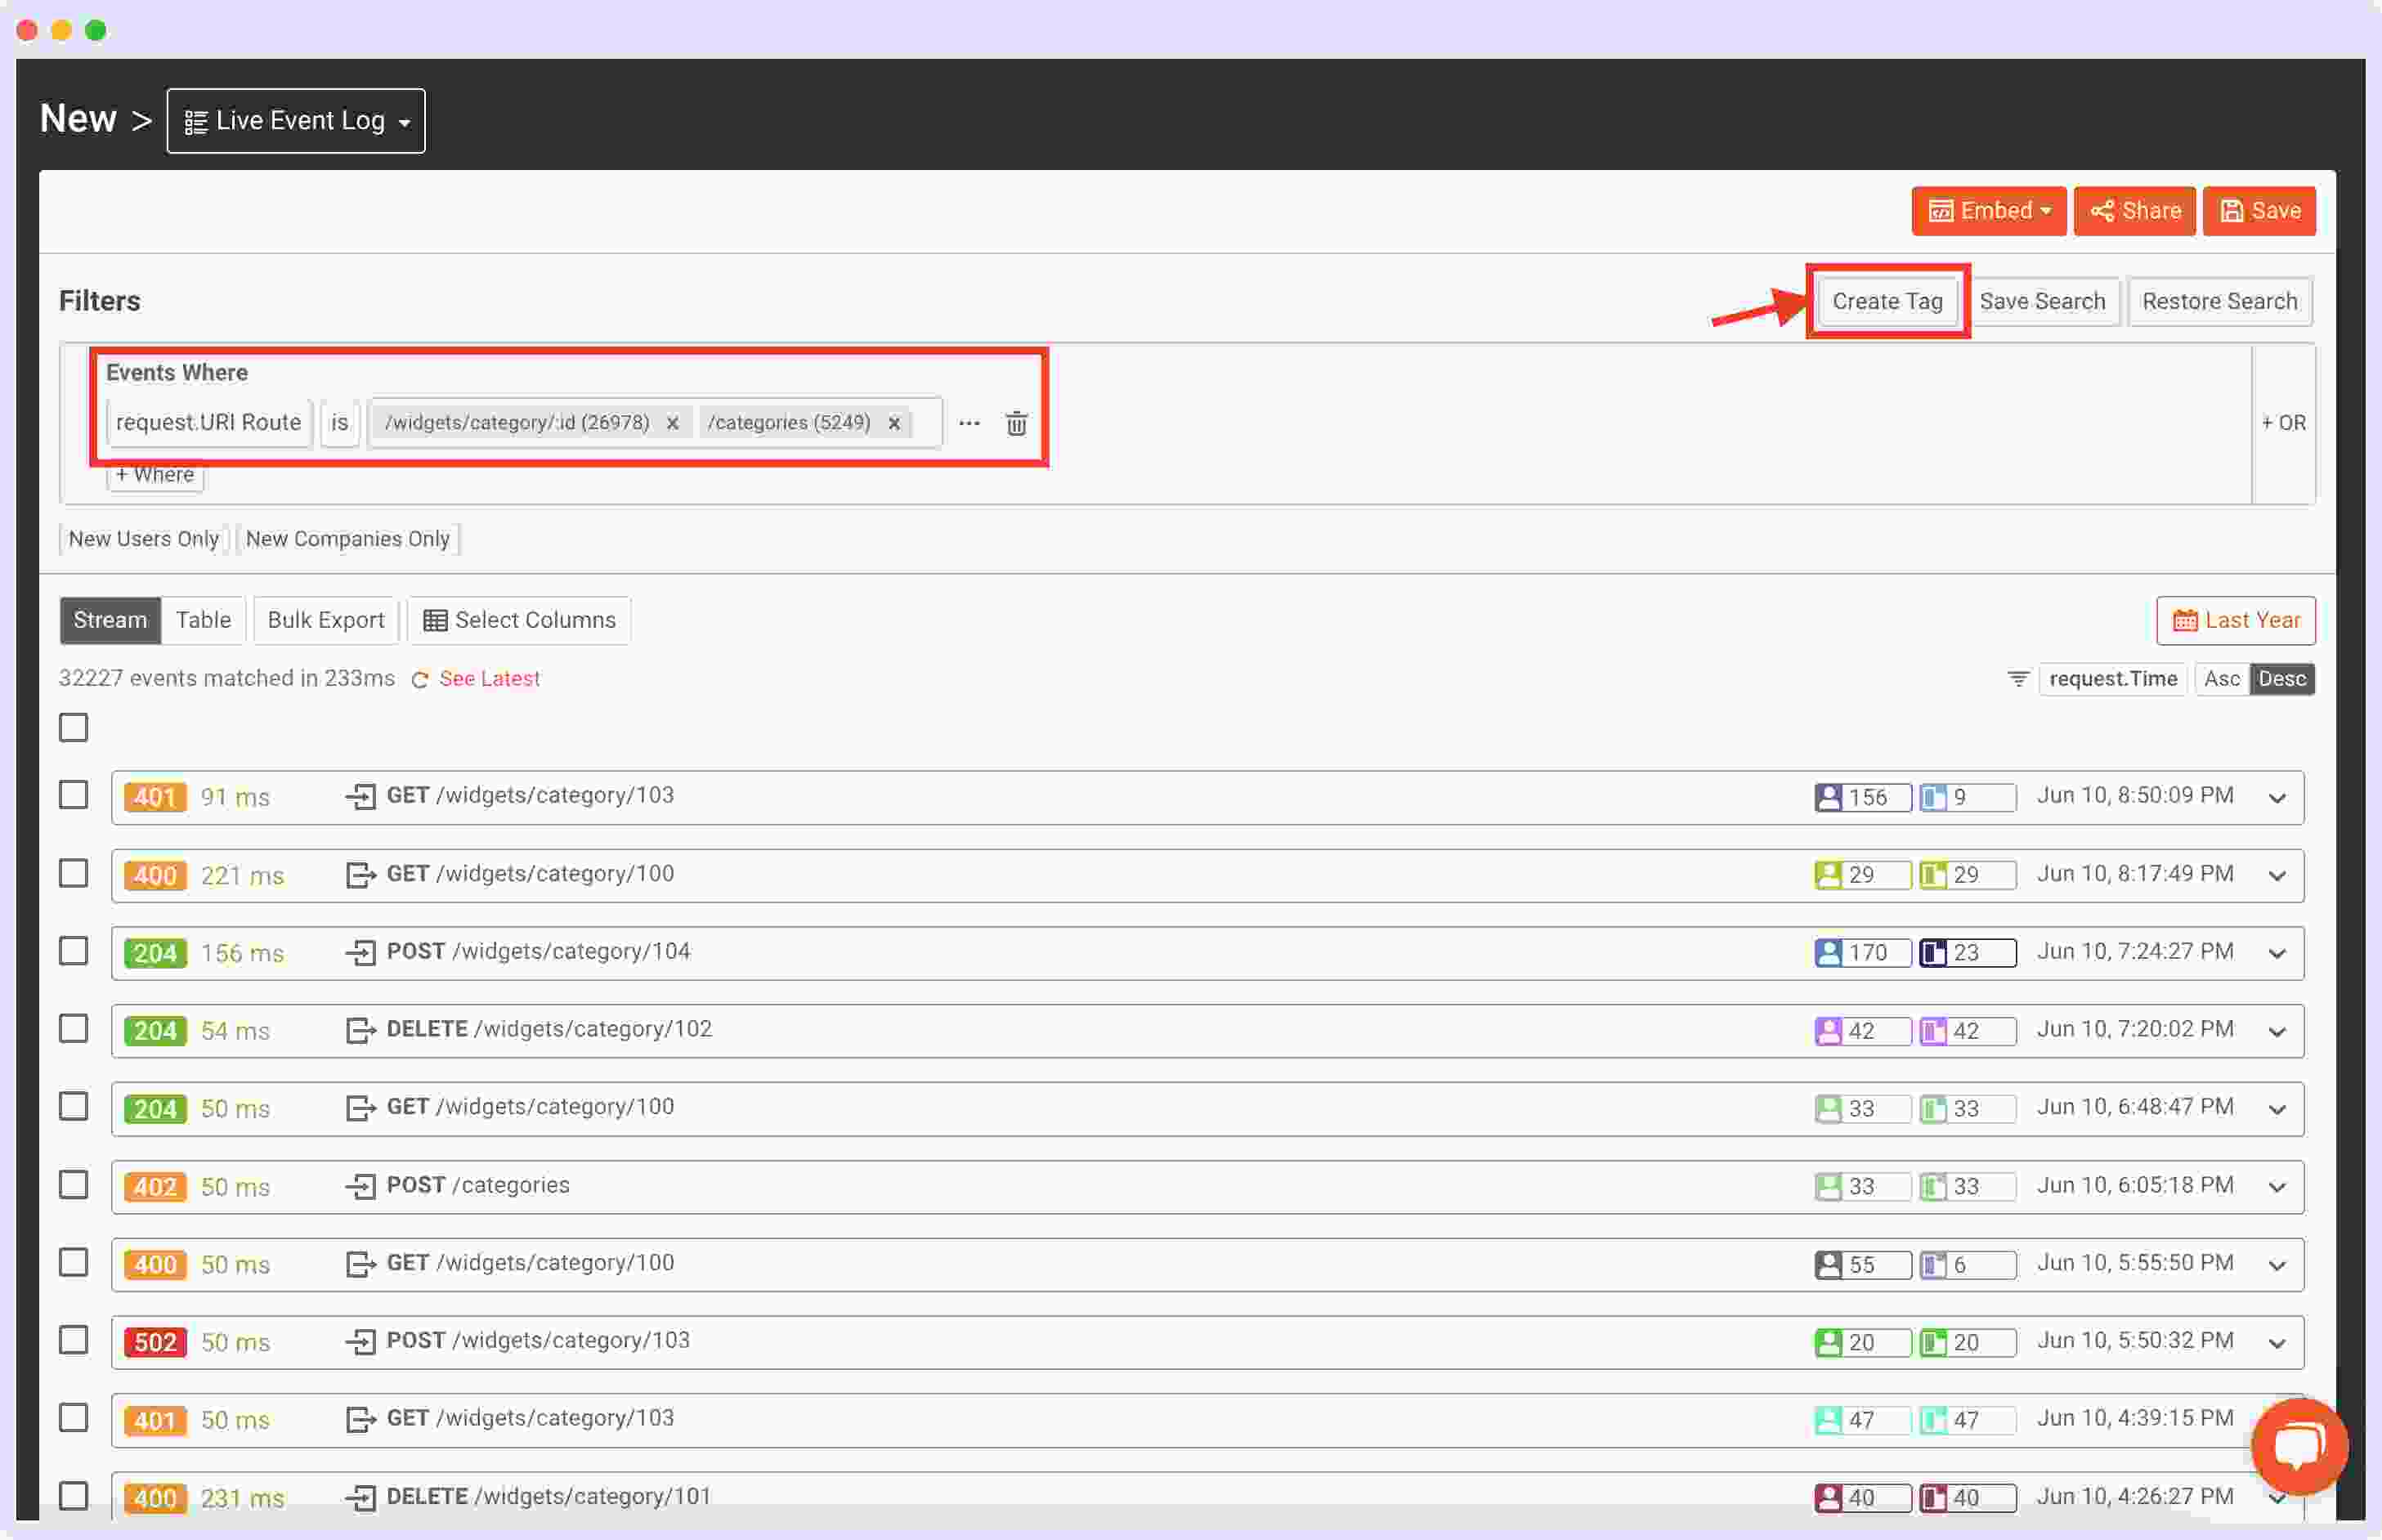
- Provides detailed API analytics to track usage patterns, user behavior, traffic trends, and API performance metrics.
- Supports usage-based billing and metering, allowing organizations to track API usage for monetization and subscription-based pricing models.
- Supports multiple API protocols including REST, GraphQL, XML/SOAP, and RPC.
- Integrates easily with API gateways, cloud platforms, and frameworks to capture API traffic and analytics data.
Pros
- Powerful API usage analytics and traffic insights
- Supports usage-based billing and API monetization models
- Integrates with popular API gateways and frameworks
- Helps teams understand API adoption and user behavior
Cons
- Focuses more on API analytics than full infrastructure monitoring
- Setup may require integration with existing API gateways
- Some advanced analytics features are available only in higher plans
Pricing
- Free Get Started Free $0/mo.
- Growth Pay as You Go $60/mo.
- Custom for enterprise users.
Moesif is a choice for organizations that want deep API usage analytics and insights to improve API adoption, performance, and monetization strategies.
11. AppDynamics
AppDynamics is an application performance monitoring (APM) and observability platform that provides real-time insights into the performance of applications, APIs, microservices, and infrastructure. It helps organizations monitor business transactions, detect performance bottlenecks, and improve application reliability.
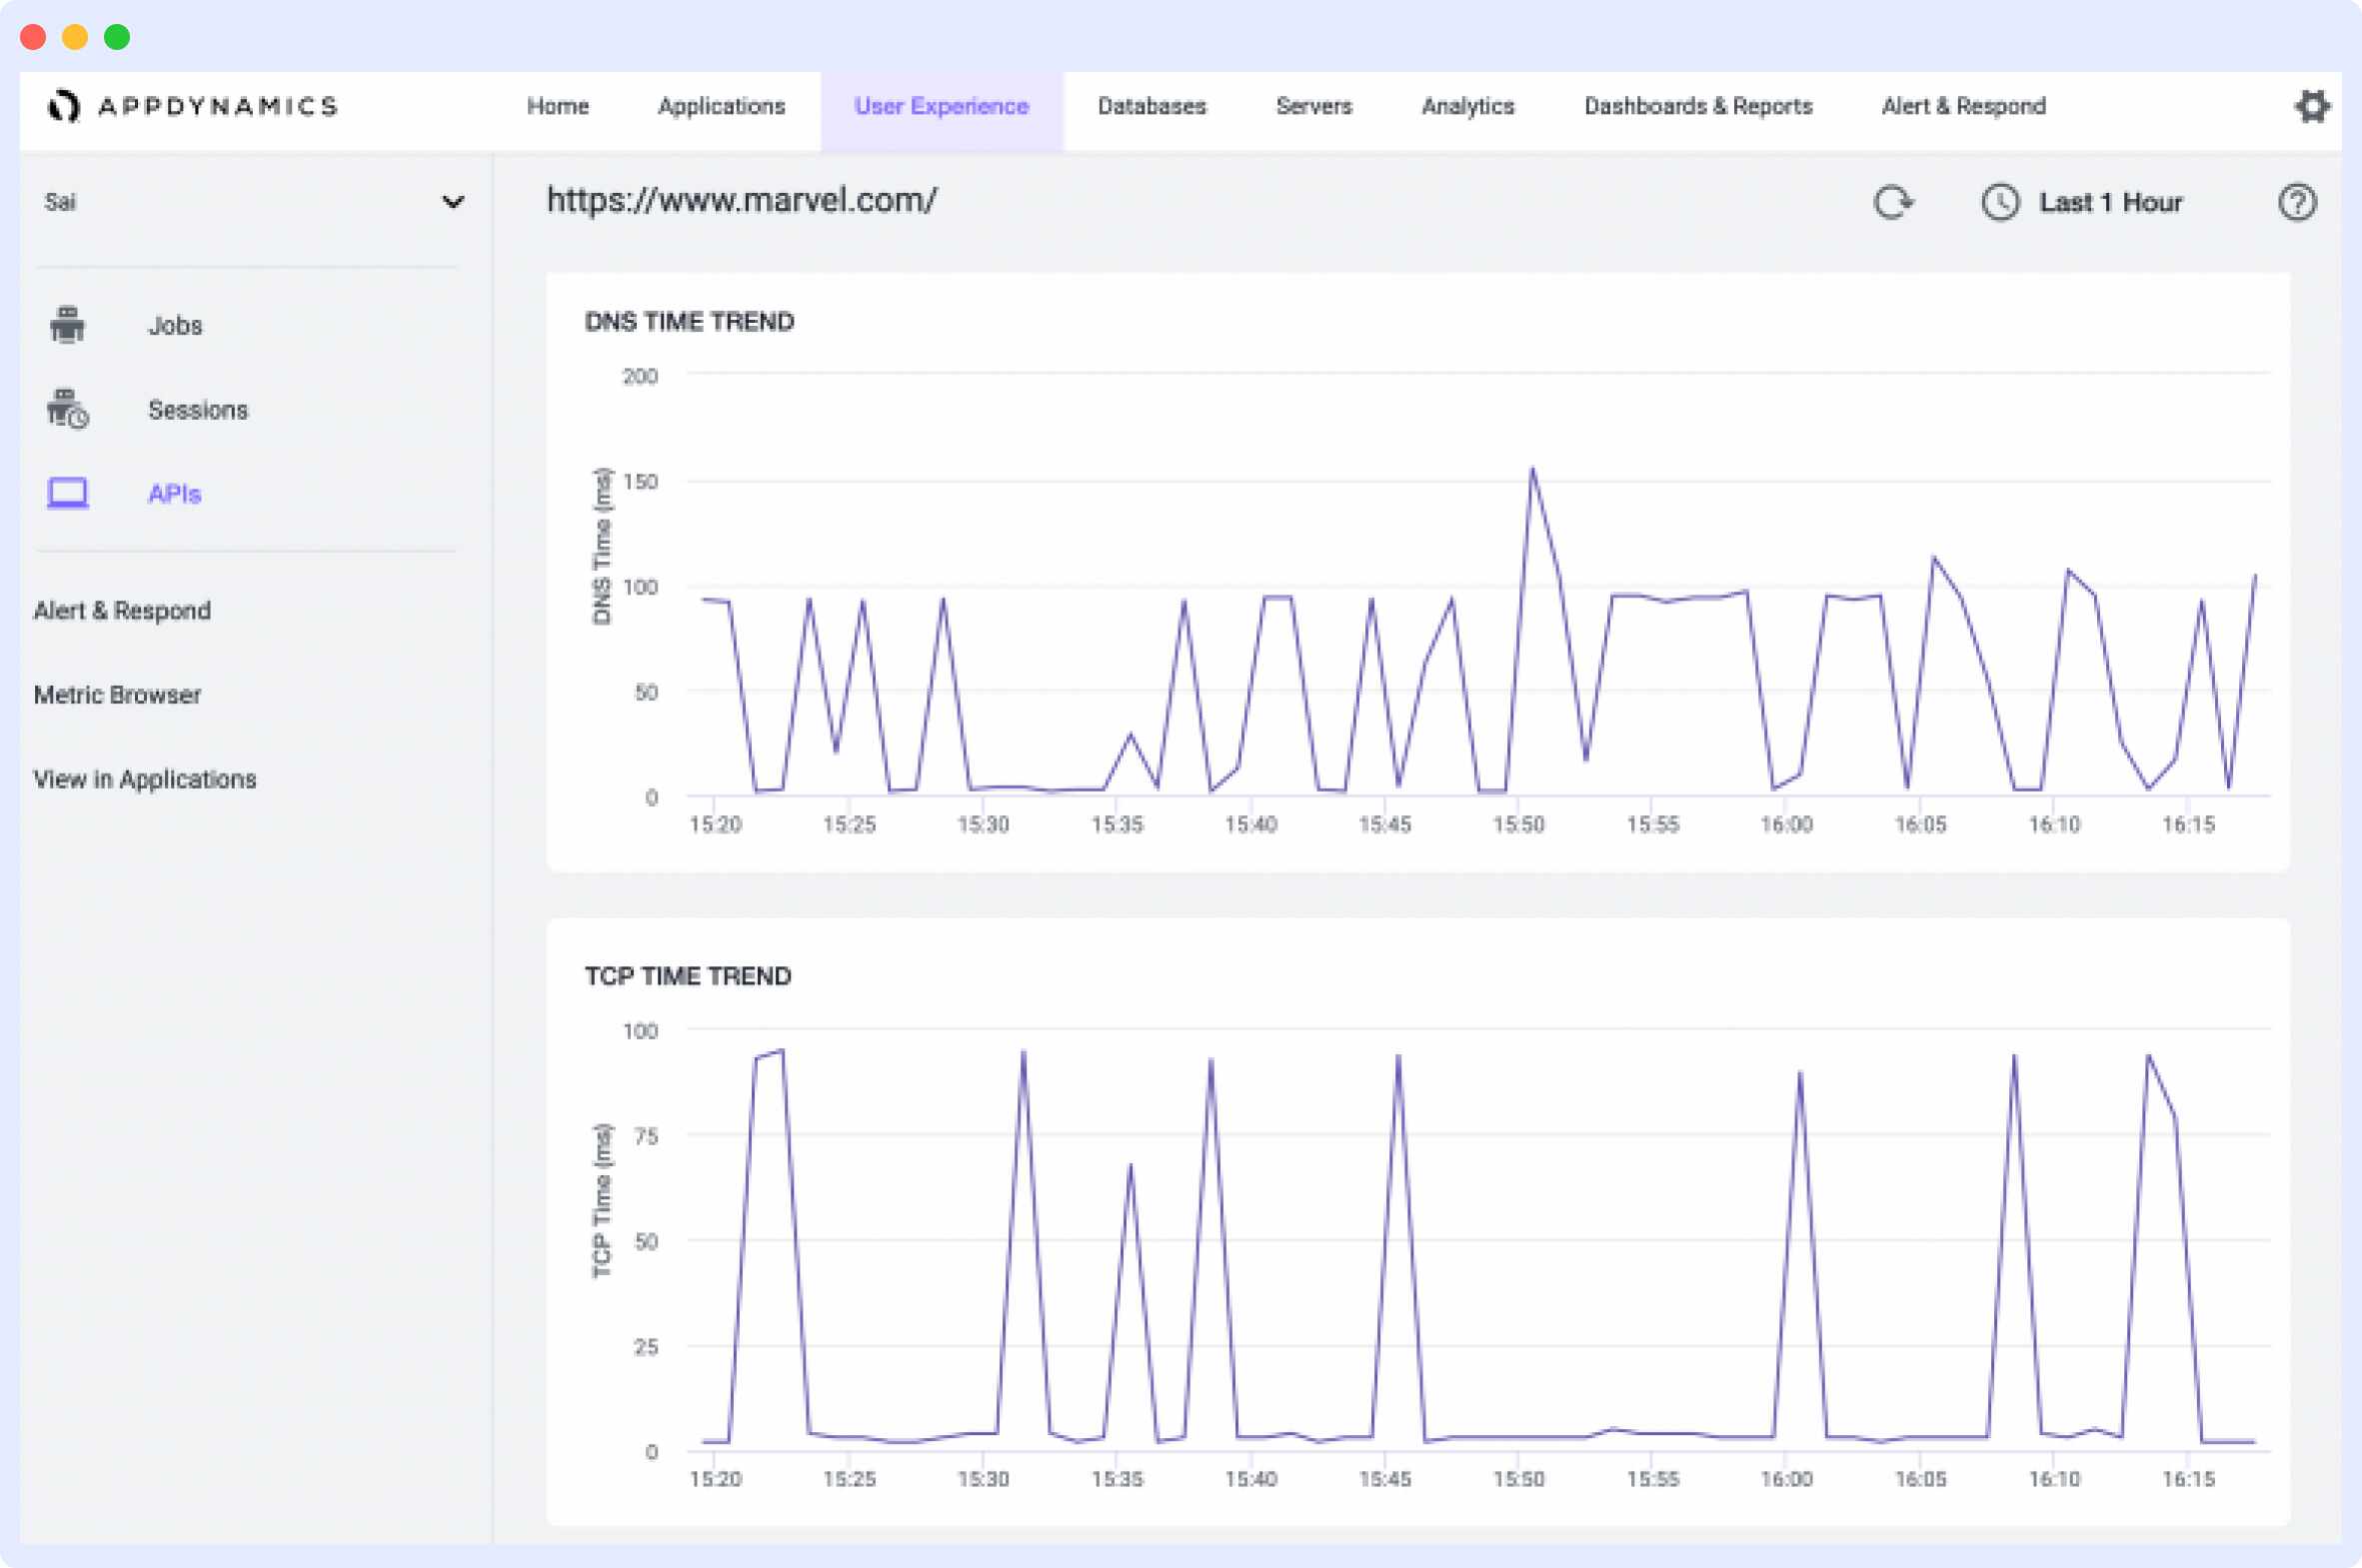
- Supports monitoring of complex API workflows, including chained API requests and multi-step transactions.
- Provides detailed network performance insights such as wait time, TCP latency, and DNS resolution time within API requests.
- Sends real-time alerts when API performance drops or when service-level agreements (SLAs) are breached.
- Business transaction monitoring allows teams to track how application performance impacts key business processes.
Pros
- Deep visibility into application and API performance
- Automated anomaly detection using machine learning
- Strong business transaction monitoring capabilities
- Detailed performance analytics and diagnostics
Cons
- Pricing may be expensive for smaller organizations
- Some users find the dashboard less intuitive compared to newer observability tools
- Implementation and configuration may require technical expertise
Pricing
- AppDynamics pricing is typically based on monitored infrastructure and application usage.
- Custom Plan starts at $60 per CPU Core.
- Pricing varies depending on the number of applications, hosts, and advanced observability features required.
AppDynamics is suited for enterprises that require deep application performance monitoring and insights into how application performance impacts business operations.
12. Dotcom-Monitor
Dotcom-Monitor is a web performance and synthetic monitoring platform that helps organizations track the availability, performance, and functionality of websites, applications, and APIs from multiple global locations.
It provides detailed performance analysis, functional checks, real-time alerts, and comprehensive reporting to help teams quickly identify and resolve performance issues.
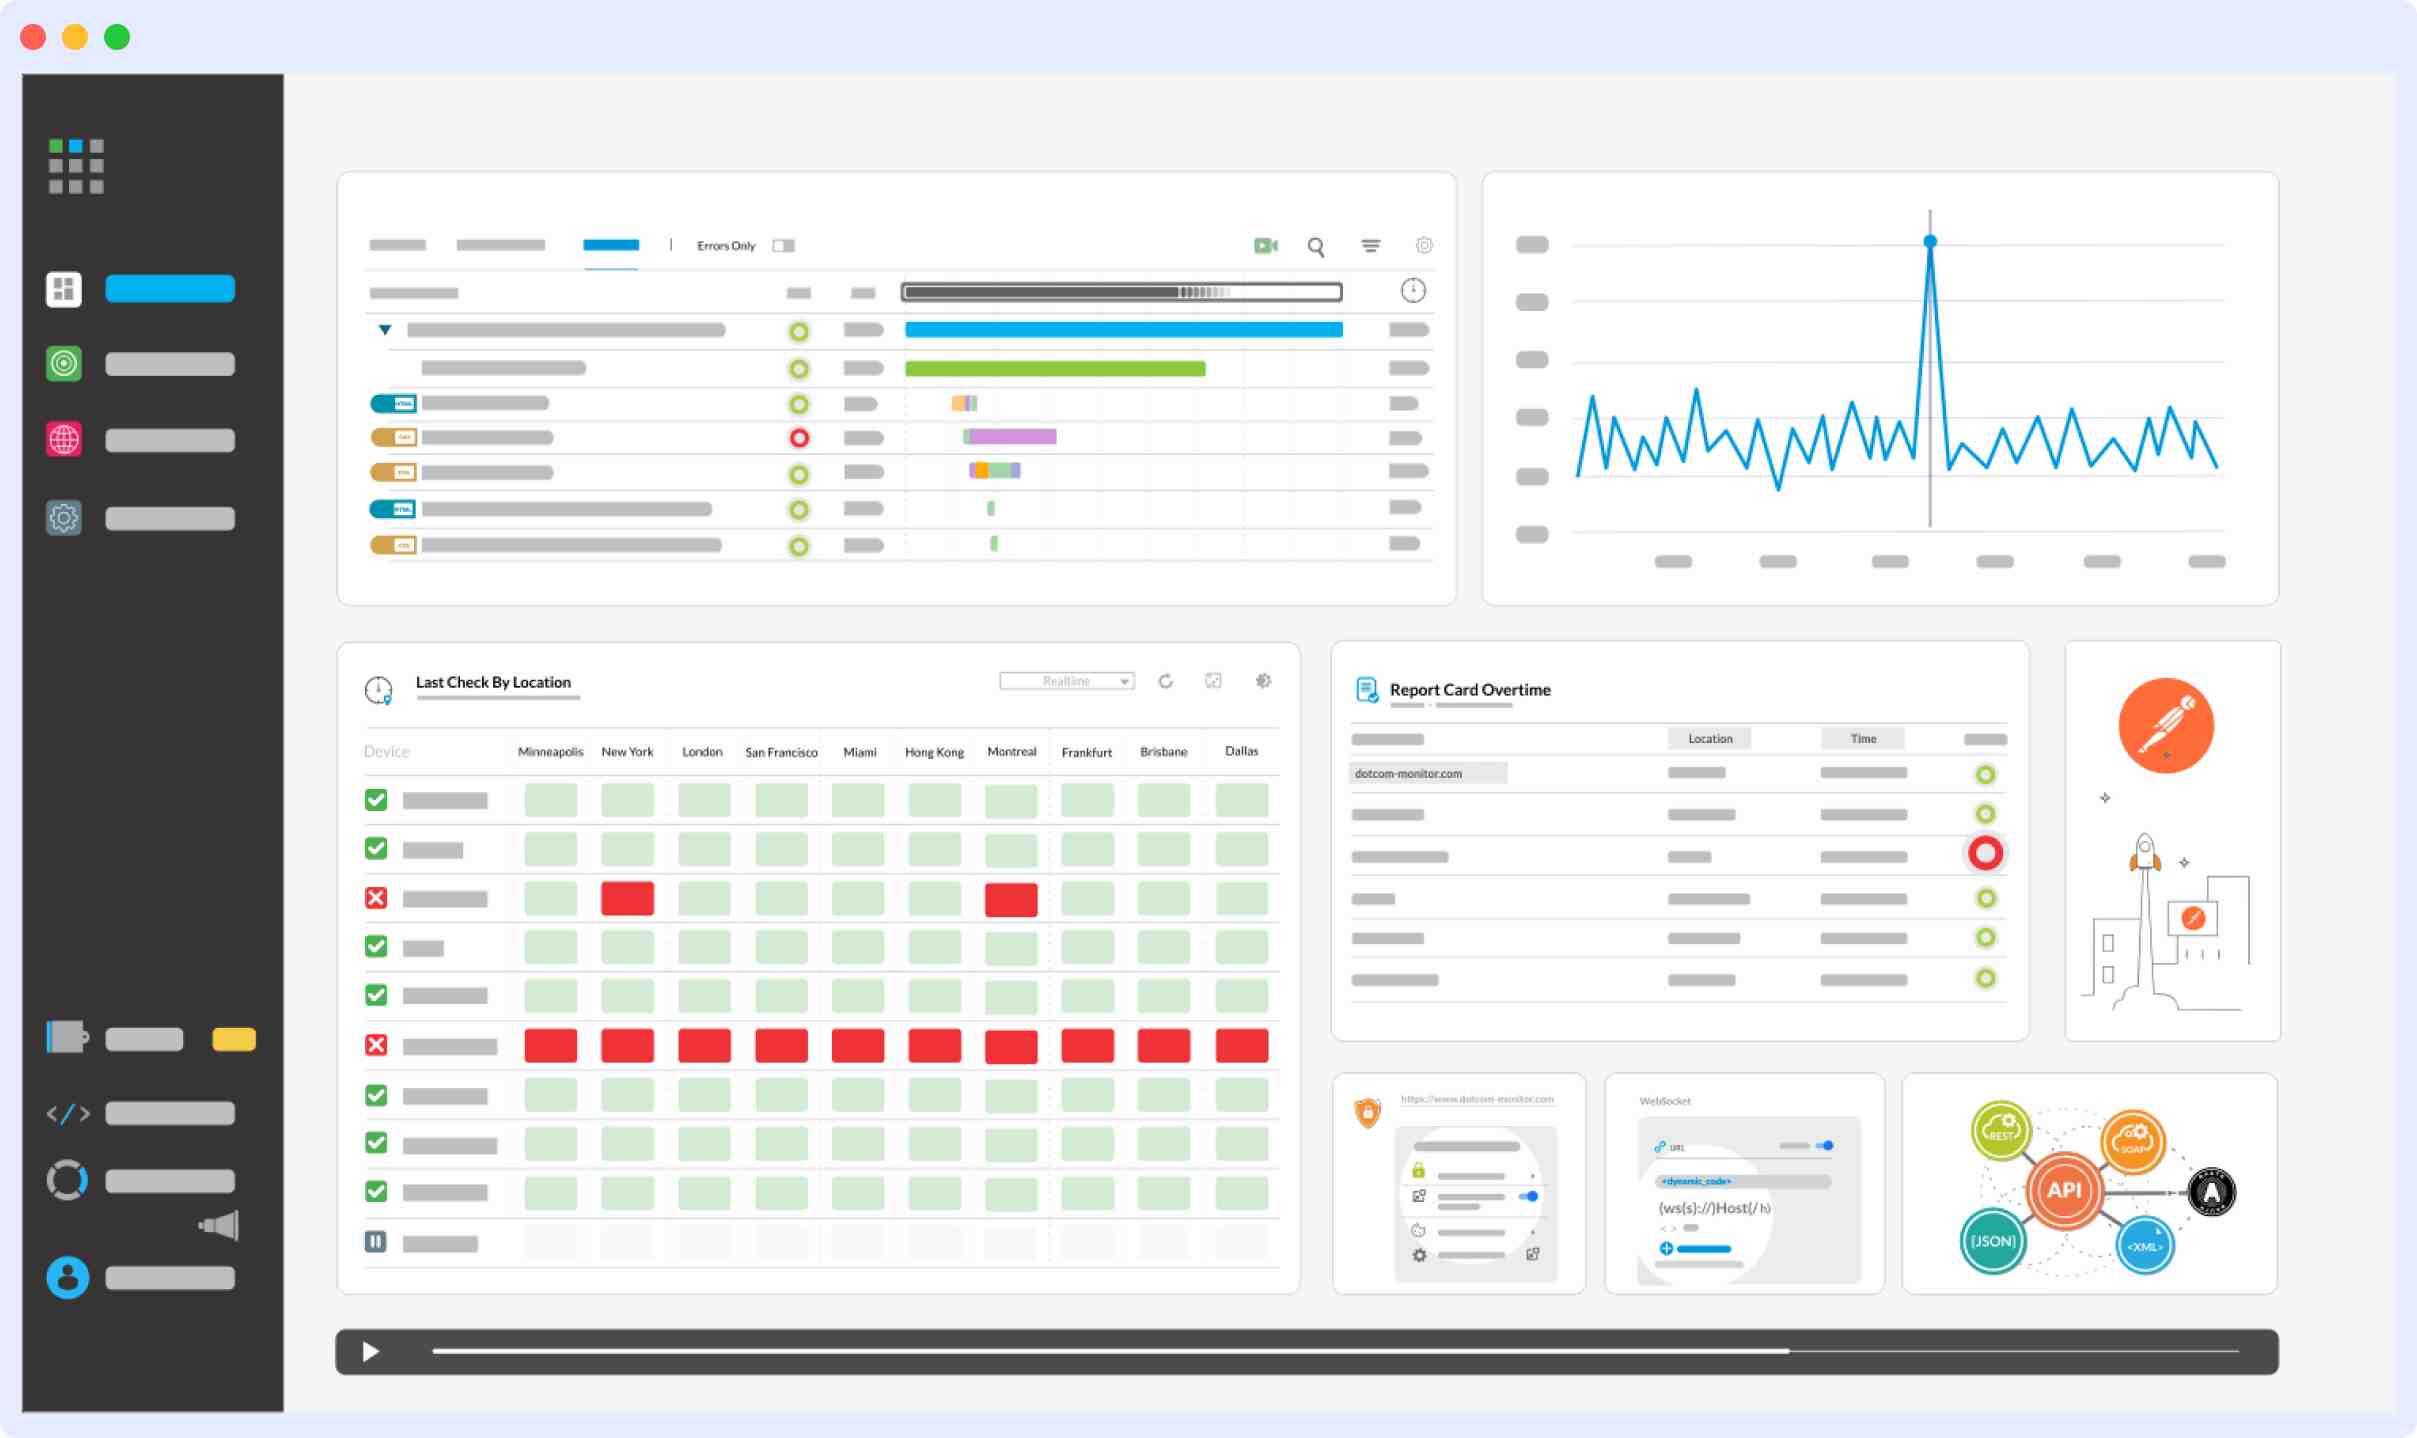
- Monitors complex web transactions such as login flows, checkout processes, and user journeys to ensure functionality and uptime.
- Sends alerts through multiple channels such as email, SMS, phone calls, webhooks, Slack, PagerDuty, WhatsApp, and ServiceNow.
- Uses a global monitoring network to test APIs and applications from multiple geographic locations.
Pros
- Global monitoring network for accurate uptime checks
- Supports monitoring of complex web transactions
- Multiple alert notification channels
- Detailed performance analytics and reporting
- 24/7 customer support
Cons
- Some advanced observability features available in larger platforms may be limited
- Interface may require time to learn for new users
- Pricing may increase depending on monitoring frequency and locations
Pricing
- Basic: $29.99 per month
- Standard: $55.99 per month
- Advanced: $129.99 per month
- Custom for enterprise.
- Pricing depends on monitoring frequency, number of monitored targets, and advanced monitoring features.
Dotcom-Monitor is suited for organizations that need reliable synthetic monitoring and performance testing for APIs, websites, and complex web transactions.
If you’re comparing API monitoring tools based on pricing, AI alerts, and root cause analysis, Middleware offers a Free Forever plan with 100GB ingestion, making it ideal for teams getting started.
Key API Metrics to Monitor
Ensuring APIs’ optimal performance and reliability requires a keen focus on specific metrics. These key indicators serve as vital benchmarks, allowing organizations to assess and enhance the efficiency of their digital interactions.
Let’s explore the essential API metrics:
Uptime
One of the most basic and fundamental metrics in API monitoring, Uptime is a golden standard in measuring the performance of any service. You might have heard the term 99.999% uptime, which measures the number of uptimes relative vs downtimes per year.
Response Time
Response time is the time an API takes to process a request and return a response to the client. It is a critical API metric to monitor because it directly influences operational efficiency.
Latency
Latency refers to the delay between sending an API request and receiving the response. By minimizing latency, organizations can optimize application performance.
Endpoint
An endpoint is the specific URL or route through which an API request is sent and processed.
CPU Usage
The CPU usage metric is a direct indicator of any application’s responsiveness and performance. High CPU usage indicates that your servers or virtual machines are oversubscribed or overloaded, or that a bug is consuming more resources than the main service.
Memory Usage
Just like CPU usage, memory usage is a good indicator of the performance of an API, as it is a physical resource and not a metric that may be more configuration-dependent.
Errors Per Minute
Errors Per Minute (error rate) is the number of API calls with non-200 status codes per minute and is a critical metric for measuring how buggy and error-prone your API is.
How to Choose the Right API Monitoring Tool?
With all the diverse features offered by each API monitoring platform, the challenge lies in deciphering which one aligns perfectly with our unique operational requirements. Let’s delve into the key considerations that guide us towards making the right choice in this complex landscape.
Intuitive
An intuitive API monitoring tool provides a user-friendly interface that simplifies navigation and setup.
An intuitive tool reduces the learning curve, ensuring efficient utilization and quicker onboarding for teams. It contributes to a better monitoring experience by simplifying setup and troubleshooting.
Reusability
Reusability entails the capability to recycle code and test cases for efficient and consistent monitoring.
A tool that promotes reuse saves time, maintains consistency across tests, and facilitates easier maintenance and updates. It optimizes resources and ensures reliability in monitoring scenarios.
Run Options
Run options encompass the flexibility to execute tests on demand, at scheduled intervals, or in response to specific events.
Flexible run options adapt to dynamic operational needs. Whether triggered manually or automatically, they ensure that monitoring aligns precisely with your organizational requirements.
Sequencing and Assertions
Sequencing involves the orderly execution of API calls, while assertions validate expected outcomes.
Effective sequencing and assertions enable accurate testing of complex workflows, identifying deviations and potential issues in API interactions. This ensures thorough and reliable monitoring.
Alerts
Alerts refer to notifications triggered by predefined thresholds, indicating API performance issues or deviations.
Robust alerting capabilities are crucial for timely responses to potential disruptions. Customizable alerts through various channels enhance proactive issue resolution, minimizing downtime and optimizing performance.
API Monitoring with Middleware
API monitoring plays an important role in maintaining application performance, uptime, and reliability. Platforms like Middleware help teams track API performance, detect anomalies, and troubleshoot issues using logs, metrics, and traces in a unified observability platform.
The next steps involve a meticulous evaluation of these insights against the specific requirements of your organization. Selecting the right API monitoring tool is not just a technical decision but a strategic investment, contributing significantly to the efficiency and success of your digital operations.
Companies are increasingly focusing on proactive measures to ensure API interactions, and industry leaders are paving the way for innovative solutions. As technology keeps getting better, staying updated on these changes is crucial to stay ahead in the digital world.
So, choosing the right API monitoring tool isn’t just about today’s needs; it’s an ongoing process that adapts to the ever-changing tech scene.
What is an API monitoring tool?
API monitoring tools are software solutions designed to track, analyze, and ensure the optimal performance of Application Programming Interfaces (APIs).
These tools monitor various metrics, such as response times, error rates, and overall API health, to enhance reliability and user experiences.
What is the tool for monitoring API calls?
Several free and paid API monitoring tools are available, including Middleware, Treblle, Sematext, Prometheus, Better Stack, and Datadog. The right choice depends on your infrastructure, monitoring needs, and budget. The choice depends on specific organizational needs and preferences.
How to choose API monitoring for enterprises?
Enterprises need scalable tools with 400+ integrations, distributed tracing, and SLA alerts like Middleware or New Relic. Prioritize robust alerting, global monitoring, and compliance (GDPR/SOC2) over free tiers.
What API metrics should I monitor first?
Start by monitoring key metrics such as uptime (99.999% availability), response time (ideally below 200ms), and error rates (non-200 status codes). These metrics help identify the majority of API performance issues affecting users. These catch 80% of issues affecting users; add CPU/Memory later for root cause.
API monitoring tools with AI alerts?
Modern monitoring platforms also use AI-powered alerting to detect anomalies automatically. For example, Middleware provides AI alerts and anomaly detection, while Datadog offers severity scoring and automated anomaly detection.