Summary: Log parsing is the process of converting raw log entries into structured fields that can be searched, filtered, and analyzed. Teams use techniques such as regex, Grok patterns, and JSON parsing to extract data from different log formats. Parsing can happen at different stages of the pipeline, including the application, collector, ingest layer, or query layer, depending on the architecture. Parsed logs help teams to troubleshoot issues faster, correlate logs with metrics and traces, create alerts, and control observability costs.
TL;DR
- Log parsing converts raw log entries into structured fields that tools can search, filter, and analyze.
- Common log parsing techniques include regex, Grok patterns, JSON parsing, and OpenTelemetry Collector operators. These techniques work with structured, semi-structured, and unstructured logs.
- You can parse logs at the application, collector, ingest layer, or query stage, depending on your architecture.
- Parsed logs help engineers troubleshoot problems faster, find root causes, correlate logs with metrics and traces, and create alerts.
- Changing log formats, multi-line entries, mixed formats, sensitive data, and indexing costs create common challenges in log parsing.
- Structured logging, consistent formats, and real log samples help keep parsing reliable and easier to maintain.
- You can reduce observability costs by filtering, masking, and indexing only the data you need.
What is log parsing?
Log parsing is the process of converting raw log data into structured fields that are easier to search, filter, and analyze. A parser reads each log entry and extracts important information, such as the timestamp, log level, and message, into separate fields.
Without parsing, logs are just blocks of text. You can read them manually or search through them with tools like `grep`, but you can’t use them to see things like “All 500 errors from the checkout service in the last hour” or “The IP address that generated the most requests.”
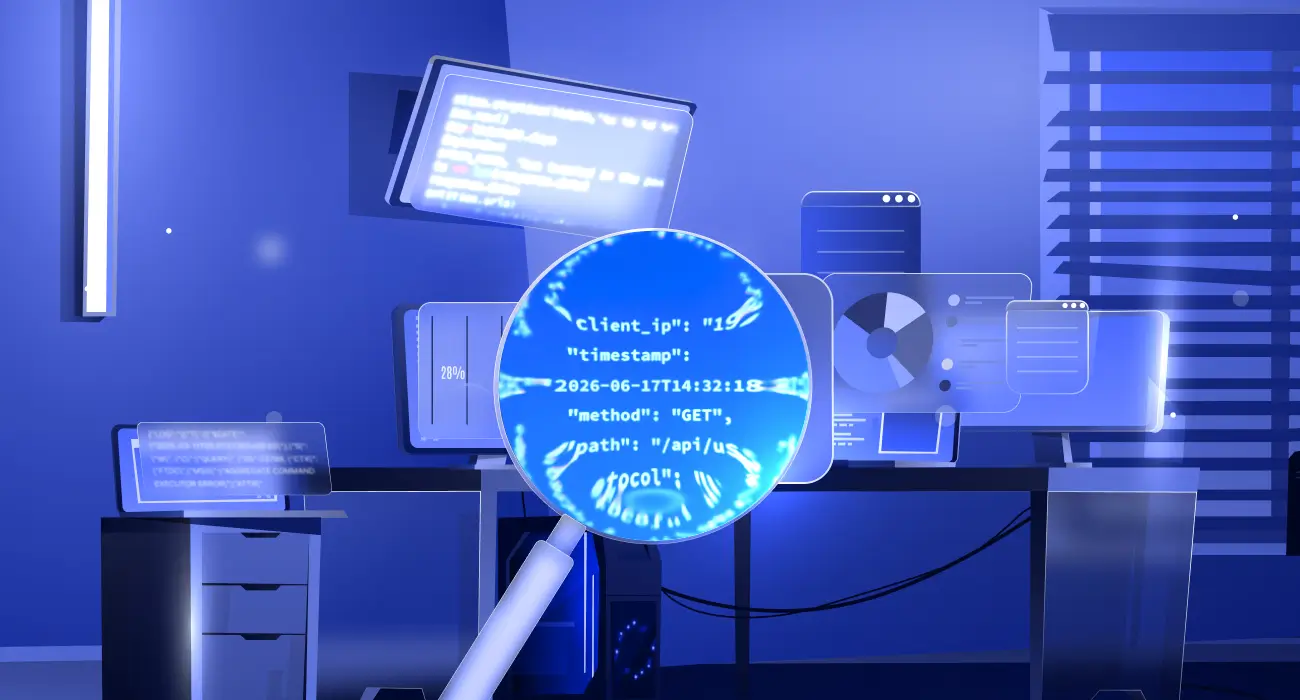
An example of a raw Nginx access log before parsing:
192.168.1.42 - - [17/Jun/2026:14:32:18 +0000] "GET /api/users HTTP/1.1" 200 1547 "https://app.example.com" "Mozilla/5.0"A logging platform can store this log, but all the information sits inside a single text entry. Searching or filtering individual values becomes more difficult because different pieces of information are mixed.
After parsing, the same log entry will look like this:
{
  "client_ip": "192.168.1.42",
  "timestamp": "2026-06-17T14:32:18Z",
  "method": "GET",
  "path": "/api/users",
  "protocol": "HTTP/1.1",
  "status": 200,
  "bytes": 1547,
  "referer": "https://app.example.com",
  "user_agent": "Mozilla/5.0"
}
Now each value has its own field. This makes it easier to filter logs by status code, group requests by path, count requests from a specific IP address, or create alerts based on certain conditions. The log hasn’t changed. Log parsing simply extracts the important data and organizes it into a format that’s easier to search and analyze.
Why is log parsing important?
Log parsing is important because raw logs become difficult to manage as log volume increases. You can store raw logs, but searching, filtering, and analyzing them become a problem when all the information is inside a single text entry. Parsing extracts important values into separate fields, making logs easier to use across monitoring, troubleshooting, and security workflows.
Some of the benefits of log parsing include:
- Faster troubleshooting: Parsed fields allow you to quickly filter application logs by service, error code, status code, or user ID instead of manually searching through thousands of entries.
- Root cause analysis: Fields such as request IDs, trace IDs, and host names make it easier to follow requests across systems and find where failures started.
- Better monitoring and alerting: Monitoring tools can create alerts based on specific field values, such as error rates, response time, or HTTP status codes.
- Security investigations: Parsed logs help security teams detect suspicious activity, failed login attempts, unusual IP addresses, and other events that may indicate a security issue.
- Audit and compliance: Searchable audit logs make it easier to meet auditing and compliance requirements and investigate historical events when needed.
- Lower storage and processing costs: Parsing lets teams filter unnecessary data and decide which logs are worth storing and indexing.
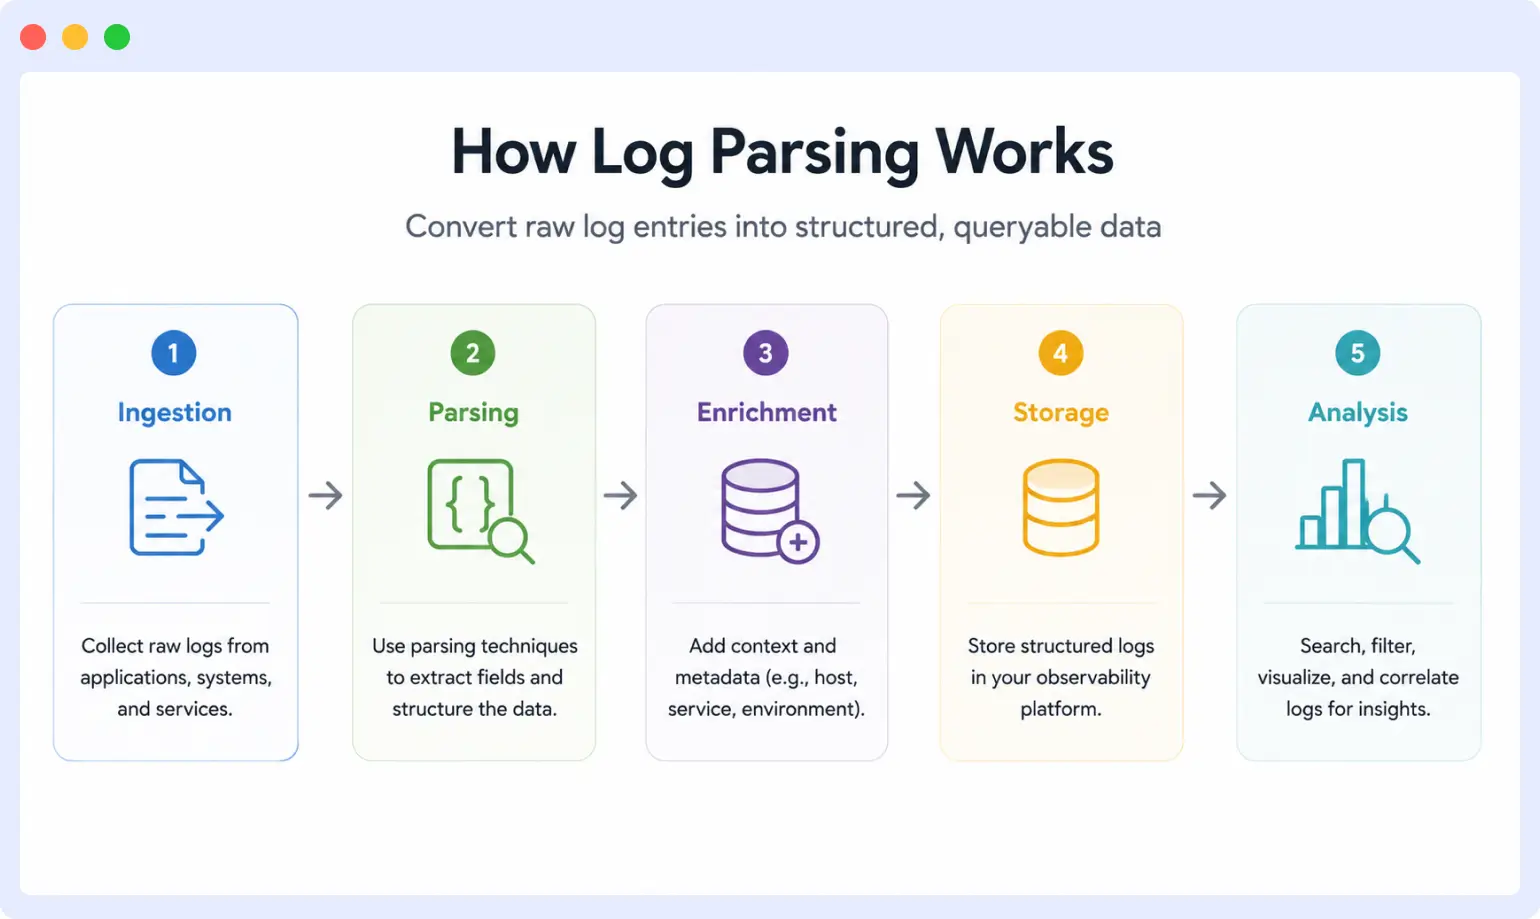
How does log parsing work?
Log parsing moves through several stages, from collecting logs to storing and analyzing them. Each stage has a specific job, from collecting logs to storing and analyzing them. The exact pipeline varies by tool, but the overall process is similar across most logging and observability platforms.
To make this easier to follow, we’ll use the same Nginx access log throughout this section:
192.168.1.42 - - [17/Jun/2026:14:32:18 +0000] "GET /api/users HTTP/1.1" 200 1547 "https://app.example.com" "Mozilla/5.0"1. Log ingestion
Log ingestion is the process of collecting logs from their source and bringing them into the parsing pipeline. Logs may come from files, applications, containers, servers, network devices, or APIs.
In this example, Nginx writes the access log to a file. A log collector such as Fluent Bit, Logstash, or the OpenTelemetry Collector reads the file and forwards each new entry for processing.
At this stage, the log is still plain text.
2. Preprocessing
Preprocessing prepares logs for parsing. Depending on the source, this step may remove unwanted characters, combine multi-line records, or discard unnecessary logs.
From the Nginx example, preprocessing is simple because the log already consists of a single line. In other systems, preprocessing may combine multi-line stack traces into a single log entry so they can be parsed correctly.
3. Parsing
Parsing is the step where the raw log entry is broken into individual fields. The parser identifies values like the timestamp, HTTP method, path, status code, and response size and stores them separately.
For the Nginx log, parsing extracts information like this:
| Field | Value |
| client_ip | 192.168.1.42 |
| timestamp | 17/Jun/2026:14:32:18 +0000 |
| method | GET |
| path | /api/users |
| protocol | HTTP/1.1 |
| status | 200 |
| bytes | 1547 |
Instead of working with one long text entry, tools can now access each value individually.
4. Data transformation
After the fields are extracted, they may need additional processing. This step converts values into a format that is easier to store and analyze.
For example, timestamps are often converted to a standard format:
17/Jun/2026:14:32:18 +0000Becomes:
2026-06-17T14:32:18ZOther transformations may include converting strings into numbers, renaming fields, or normalizing data so logs from different sources follow the same format.
5. Enrichment
Enrichment adds extra context that was not present in the original log. For example, the pipeline may add information like the service name, environment, host name, or Kubernetes namespace.
{
"service": "api-gateway",
"environment": "production",
"host": "web-server-01"
}
This additional context makes it easier to filter logs and understand where events happened.
6. Storage
Once parsing and enrichment are complete, the structured log is stored in a logging platform or database.
At this point, our Nginx log might look like this:
{
"client_ip": "192.168.1.42",
"timestamp": "2026-06-17T14:32:18Z",
"method": "GET",
"path": "/api/users",
"protocol": "HTTP/1.1",
"status": 200,
"bytes": 1547,
"referer": "https://app.example.com",
"user_agent": "Mozilla/5.0",
"service": "api-gateway",
"environment": "production",
"host": "web-server-01"
}
Depending on the use case, teams may store logs in search engines, databases, or object storage for long-term retention.
7. Analysis
Once the logs are stored, teams can search, visualize, and analyze them. For example, they can:
- Find all requests that returned a 500 status code.
- Count requests from a specific IP address.
- Build dashboards for traffic and errors.
- Create alerts when error rates increase.
- Correlate logs with metrics and traces during troubleshooting.
At this point, the original log has been transformed into structured data that tools can search, filter, and analyze. How those fields are extracted depends on the parsing method being used.
Log parsing vs. log processing: Parsing is the step where raw log text is converted into structured fields. Processing is the broader set of operations applied to those fields, including filtering, enrichment, routing, transformation, and storage. Parsing is one stage inside the larger processing pipeline.
Log parsing techniques and methods
Different techniques can be used to extract fields from raw logs. The right approach depends on the log format and the parsing tool you’re using. Some methods work well for plain text logs, while others are designed for structured formats like JSON.
Regular expressions (regex)
Regular expressions, or regex, use patterns to find and extract values from text. They are one of the most common ways to parse unstructured logs because they can match almost any format.
For example, consider the following log:
User=123 Status=FailedA regex pattern like `User=(\d+)` will extract the user ID from the log entry.
Regex gives you a lot of flexibility, but complex expressions can become difficult to read and maintain. This is why teams often use higher-level patterns or structured logs when possible.
Grok patterns
Grok patterns are built on top of regular expressions and provide predefined patterns for common data types such as IP addresses, timestamps, and HTTP methods. Tools like Logstash, Fluentd, Vector, and the OpenTelemetry Collector use Grok patterns to simplify log parsing.
Instead of writing long regex expressions from scratch, you can combine existing patterns to extract fields from logs. This makes parsing rules easier to read and maintain, especially for common formats like Apache or Nginx access logs.
For example, here’s a Grok pattern for an Nginx access log:
%{IPORHOST:client_ip} - - \[%{HTTPDATE:timestamp}\] "%{WORD:method} %{DATA:path}" %{NUMBER:status}Each `%{TYPE:field_name}` extracts a value from the log entry and stores it in a named field.
JSON and key-value parsing
JSON and key-value logs are easier to parse because their fields are already structured.
For example, a JSON log looks like this:
{
"status": 200,
"path": "/api/users"
}
A key-value log looks like this:
status=200 path=/api/usersMost logging tools can extract fields from these formats without relying on complex patterns. This is one reason why structured logging has become the preferred approach in many modern applications and the recommended option when you control the source.
OpenTelemetry Collector operators
The OpenTelemetry Collector parses logs using operators, which are small processing units that run inside the filelog receiver. Each operator handles one task, such as reading a file, matching a pattern, or extracting fields.
Operators can be chained together to build a parsing pipeline. A common setup uses a `regex_parser` or `json_parser` operator to extract fields, followed by other operators to set the timestamps or rename fields.
This approach works well for teams that already use OpenTelemetry because logs, metrics, and traces can be processed through the same pipeline.
Machine learning and pattern mining
Some platforms use machine learning and pattern-mining techniques to detect log structures automatically. Instead of relying entirely on manually defined rules, these systems can find patterns and infer fields from large volumes of log data.
These approaches are less common than regex, Grok patterns, or JSON parsing. They work best when log formats change frequently or when maintaining parsing rules manually becomes difficult.
What type of logs can be parsed?
Almost any log can be parsed, but the effort involved depends on how the log is written. Logs generally fall into three categories: structured, unstructured, and semi-structured. The way a log is structured determines how easy or difficult it is to parse.
Structured logs: These are written in a predefined format with clear fields, such as JSON or key-value pairs. The fields already exist, so a parser can read them directly without needing to match patterns. Structured logs are the easiest to parse.
{
  "timestamp": "2026-06-17T14:32:18Z",
  "level": "ERROR",
  "service": "checkout",
  "message": "Payment failed"}
Unstructured logs: These logs are written as free text with no fixed format. A log line may include a timestamp, a message, and other details, but the order and structure can vary between entries. Parsing them usually requires regex or Grok patterns, and parsing rules often need updates when the log format changes.
2026-06-17 14:32:18 ERROR Payment failed for user 123Semi-structured logs: These logs sit between structured and unstructured logs. They follow a loose pattern but may include free text, embedded JSON, or mixed formats within the same line. Apache access logs, syslog, and many application logs fall into this group. Parsing them often requires a combination of techniques, such as a pattern to extract the outer fields and a JSON parser for embedded data.
2026-06-17T14:32:18Z app=checkout {"user_id": 123, "status": "failed"}Common log formats
Logs come in different formats, and some are easier to parse than others. The table below shows some of the most common formats you’ll encounter.
| Format | Structure | Where it shows up | Parsing difficulty |
| JSON | Structured | Modern applications, microservices | Easy |
| Key-value | Structured | Application logs, API gateways | Easy |
| Plain text | Unstructured | Legacy applications, custom logs | Difficult |
| Syslog | Semi-structured | Linux systems, network devices | Moderate |
| Apache & Nginx access logs | Semi-structured | Web servers | Moderate |
| Windows Event Log | Semi-structured | Windows hosts | Moderate |
| CEF and LEEF | Semi-structured | Security tools, SIEM platforms | Moderate |
| Multi-line logs | varies | Java stack traces, Python exceptions | Difficult |
Structured formats are generally easier to parse because the fields already exist. Semi-structured formats usually require parsing rules, while unstructured and multi-line logs often need more processing to extract useful information.
Do structured logs still need parsing?
Yes, but the process is much simpler. Structured logs already store data in separate fields, so they usually don’t require complex regex or Grok patterns to extract values.
However, log pipelines still need to validate data, convert timestamps and data types, add metadata, and prepare logs for storage and analysis. In other words, parsing doesn’t disappear with structured logging. It simply involves less work.
How do you handle multiline logs?
Multiline logs, such as Java stack traces and Python exceptions, span several lines in a log file. Most log collectors expect one event per line, so a stack trace with 20 lines would be ingested as 20 separate log events without multiline handling configured.
This breaks parsing because each line fragment lacks the context of the full exception and cannot be matched against any useful pattern.
Example: a Java stack trace
2026-06-17 14:32:18 ERROR Unhandled exception in PaymentService
java.lang.NullPointerException: Cannot invoke method getId()
    at com.example.PaymentService.processPayment(PaymentService.java:42)
    at com.example.OrderController.checkout(OrderController.java:88)
Without multiline handling, a collector ingests four separate log events from this block.
How to fix it
Most log collectors provide a multiline mode that detects the start of a new log entry using a pattern and combines subsequent lines until the next entry begins.
Fluent Bit uses the multiline parser with a start_state regex that matches the first line of the entry:
[FILTER]
    Name          multiline
    match         *
    multiline.key log
    mode          partial_message
OpenTelemetry Collector uses the recombine operator inside the filelog receiver:
yaml
operators:
  - type: recombine
    combine_field: body
    is_first_entry: body matches "^\\d{4}-\\d{2}-\\d{2}"
The key is matching the correct start-of-entry pattern so lines are joined into a single event before any field extraction runs.
Where should you parse logs?
You can parse logs at several points in the pipeline, most commonly at the application, agent or collector, ingest layer, or query time. The right place depends on how much control you have over the source, how fast you need queries to run, and how much complexity you’re willing to manage.
Parse logs at the application
Parsing can be done inside the application itself. Instead of writing plain text logs, the application uses a logging library that produces structured logs, usually in JSON. The fields are created when the log is written, so little or no field extraction is needed later.
This reduces the amount of processing needed later because downstream tools receive structured data from the start. The trade-off is that you need access to the application code, and services need to follow consistent logging practices.
Use this when: You control the application code and want to keep parsing work out of the pipeline.
Logs parse at the agent or collector
Agents like Fluent Bit, Filebeat, Vector, and the OpenTelemetry Collector can parse logs before sending them to a backend.
Teams can update parsing rules without touching application code since logs are handled close to the point of generation. The trade-off is that you have to manage the agents and keep parsing rules consistent across your environment.
Use this when: You can’t modify the application but still want parsing to happen early in the pipeline.
Parse logs at the ingest layer
This approach sends logs to a central pipeline that handles parsing, transformation, and enrichment before forwarding the data to a backend. Common tools include Logstash and Cribl.
Centralizing parsing rules makes them easier to manage across many applications and teams. The trade-off is additional infrastructure and another system to manage.
Use this when: You need centralized control over parsing rules, routing, and policies.
Parse logs at query time
Another option is to store logs with little or no preprocessing and extract fields only when queries are executed. Splunk and Grafana Loki support this model.
Query-time parsing provides the most flexibility because you can create new parsing rules without reprocessing old logs. The trade-off is that queries can take longer because the system has to extract fields every time a query runs.
Use this when: You need flexibility for investigations or you don’t know in advance which fields you’ll need.
The table below summarizes the trade-offs of each approach.
| Where parsing happens | Advantages | Limitations | Best for |
| Application | Reduces processing later and produces structured logs from the start | Requires access to application code and consistent logging standards | Teams that control the application code |
| Agent or collector | Keeps parsing close to the source and avoids code changes | Requires managing agents and parsing rules across hosts | Environments with many services or legacy applications |
| Ingest layer | Centralizes parsing, transformation, and routing | Adds another system to manage and can increase latency | Platform and security teams that need centralized control |
| Query time | Flexible and allows new fields to be extracted without re-ingesting logs | Queries are slower because parsing happens during searches | Ad-hoc investigations and changing requirements |
How do you mask sensitive data during log parsing?
Logs frequently contain data that should never reach storage: passwords submitted in request bodies, API keys that appear in headers, email addresses, credit card numbers, and IP addresses that fall under data privacy regulations.
Parsing provides a natural interception point to remove or mask this data before it is written to any backend.
Common approaches
Field-level masking replaces a specific field value with a placeholder. For example, replacing a credit card number with [REDACTED] or ****-****-****-1234.
Regex-based scrubbing scans the log body for patterns matching sensitive formats, such as 16-digit card numbers or email addresses, and replaces them before the log is stored.
Field dropping removes an entire field from the parsed event. This is useful for fields that are never needed downstream, such as raw request bodies that may contain form data.
In practice with OTel Collector
The OpenTelemetry Collector supports attribute-level transforms using the transform processor:
yaml
processors:
  transform:
    log_statements:
      - context: log
        statements:
          - replace_pattern(attributes["user.email"], "^.*$", "[REDACTED]")
          - delete_key(attributes, "authorization")
For Kubernetes environments, Middleware’s OTel-Native Filters can mask emails, credit card numbers, phone numbers, IP addresses, MAC addresses, and UUIDs at the cluster level before data leaves the node. This means sensitive data never enters the ingestion pipeline at all, which is the safest and most cost-effective point to apply masking.
What are the challenges of log parsing?
Log parsing comes with some challenges that affect accuracy, performance, and cost. Most of them appear once the volume of logs grows or when logs come from many different sources.
- Volume at scale: Large systems can produce millions of log entries per minute, and parsing all of them in real time requires enough compute resources and storage to keep up.
- Log format changes: A small update to an application or library can change the shape of a log, which breaks parsing rules that were working the day before.
- Multi-line entries: Stack traces, pretty-printed JSON, and long error messages span several lines and confuse parsers that expect one log per line.
- Mixed formats: A single stream often carries logs from different services, so the parser has to handle plain text, JSON, and key-value entries in the same pipeline.
- Timestamp variation: Different systems write timestamps in different formats and time zones, which makes it harder to order events accurately.
- Sensitive data leakage: Logs often contain passwords, tokens, or personal data that should not be stored. Parsing provides an opportunity to remove or mask sensitive data before it reaches storage.
- Indexing cost: Every parsed field that gets indexed adds to storage and query costs, so teams have to decide which fields are worth keeping searchable.
What are log parsing best practices?
Good log parsing practices keep parsing accurate, reliable, and easier to maintain as your system grows.
- Use structured logging whenever possible: When you control the application code, emit logs in JSON or another structured format so the parser can read the fields directly instead of matching patterns.
- Keep log formats consistent: Use the same field names, timestamp formats, and log level conventions across services so parsing rules can be shared and reused.
- Parse logs as early as possible: Running parsing at the application or agent level reduces repeated work later in the pipeline and helps keep queries fast.
- Test parsing rules against real log samples: Synthetic test logs often miss the edge cases found in production, so validate rules against real samples before rolling them out.
- Remove sensitive data during parsing: Strip or mask values such as passwords, API keys, tokens, and personal data before logs are stored or indexed.
- Plan for log format changes: Applications change over time, so parsing rules should be reviewed whenever log formats are updated.
How is log parsing used in observability and monitoring?
Log parsing is used in observability and monitoring to turn raw logs into structured data that tools can search, correlate, and alert on. This helps teams troubleshoot issues faster, connect logs with metrics and traces, and create more reliable alerts.
Faster troubleshooting and root cause analysis
Parsed logs make it easier to find the source of an issue during an incident. Instead of searching through raw text, engineers can filter by fields such as service name, status code, error type, or user ID and narrow down the problem much faster.
When something breaks, the speed of the investigation often depends on how quickly you can find the relevant log entries. Parsed fields help reduce mean time to resolution (MTTR) because engineers spend less time searching and more time fixing the issue. This pairs naturally with distributed tracing, where trace IDs extracted from parsed logs let you follow a request across every service it touched.
Correlating logs with metrics and traces
Parsed logs can be linked with metrics and traces when they share common fields such as trace IDs, request IDs, or service names. This gives engineers a more complete view of what happened during a request, from high-level metrics down to individual log entries.
For example, a spike in error rates on a dashboard can be traced to a specific request, and that request can be followed across services using its trace ID. This correlation becomes much easier when parsing extracts those fields first. For a deeper look at the tools that make this possible, see our guide to log monitoring tools.
Alerting on parsed fields
Monitoring systems use parsed fields to trigger alerts when values cross thresholds or match certain conditions. For example, teams can create alerts when the number of HTTP 500 responses exceeds a limit, when a service logs too many errors in a short period, or when a specific error message appears repeatedly.
Parsing makes these alerts easier to build and maintain because the values already exist as fields instead of having to be extracted from raw text every time.
Log parsing with Middleware
Middleware handles log parsing through its OpenTelemetry-based observability pipeline. The Middleware Infrastructure Agent collects logs from the local file system, transforms them into OpenTelemetry format, and forwards them to Middleware for processing and indexing. Middleware also supports JSON-structured logs, so those fields can be searched and filtered immediately.
For the Apache integration, the setup lets you choose between Common, Combined, and Custom log formats. This makes it easier to collect and process web server logs without maintaining custom parsing rules.
For Kubernetes environments, Middleware’s OTel-Native Filters can modify fields, remove unwanted telemetry, and mask sensitive data, including email addresses, credit card numbers, phone numbers, IP addresses, MAC addresses, and UUIDs, before the data leaves the cluster. This means sensitive data never enters the ingestion pipeline.
Where Middleware goes further than raw log parsing is in what happens after the logs are structured. OpsAI correlates parsed log signals with metrics and traces automatically. When error rates spike in your logs, OpsAI can identify the root cause by pulling in the relevant trace, the upstream service metric, and the infrastructure context, without requiring engineers to manually pivot between tools. Internally, Middleware sees 50%+ auto-resolution of production incidents. Beta customers report 70%+ auto-resolution and an 80% improvement in on-call productivity.
This means parsed logs are not just stored and searched. They actively feed automated triage and remediation workflows alongside APM and infrastructure monitoring data in a single platform.
Start your 14-day free trial — unlimited log ingestion, no credit card required.
FAQs
What is log parsing?
Log parsing is the process of converting raw log entries into structured fields that tools can search, filter, and analyze. A parser reads each log entry and extracts values such as the timestamp, log level, status code, and request path into separate fields, making it easier to query, alert on, and correlate logs with other telemetry signals.
Is log parsing still necessary with structured logging?
Yes, but the work is smaller. Structured logs already store values in separate fields, so there’s usually no need for complex regex or Grok patterns. However, log pipelines still need to validate data, convert types, normalize timestamps, and add context before storing the logs.
What is the difference between log parsing and log analysis?
Log parsing extracts fields from raw log entries. Log analysis uses those fields to answer questions, identify trends, and investigate issues. Parsing prepares the data, and analysis works with the prepared data.
What is the difference between log parsing and log aggregation?
Log parsing extracts structured fields from individual log entries. Log aggregation collects logs from many sources and stores them in a central location. Aggregation brings logs together, while parsing makes them easier to search and analyze.
Can log parsing be automated?
Yes. Most modern log collectors and observability platforms can automatically detect common formats such as JSON, syslog, and web server logs and apply built-in parsing rules. Custom formats may still require manual rules, but parsing can run automatically once those rules are in place.
Does log parsing require regular expressions?
Not always. Regex is commonly used for unstructured logs, but structured formats such as JSON and key-value logs can be parsed without it. Higher-level tools like Grok also reduce the need to write raw regex.
How does log parsing help reduce observability costs?
Parsing lets teams filter, sample, or drop logs before they reach storage. Removing unnecessary fields and noisy entries reduces the amount of data that needs to be indexed, which helps lower ingestion and storage costs.