You know that moment when something breaks in production? Alerts go off, you open logs, and it’s just… noise. Different formats, useless messages, missing context, and the one thing you need isn’t there.
That’s the current state of telemetry for most teams.
An observability pipeline sits between your data sources and your monitoring tools. It cleans, structures, and filters data before it reaches your backend, so instead of messy logs, metrics, and traces, you get data you can actually use.
This guide covers what observability pipelines are, how they work, and when you actually need one.
What Is an Observability Pipeline?
An observability pipeline is a real-time data processing layer that sits between your telemetry sources and your observability tools. It collects, transforms, filters, and routes logs, metrics, and traces before they are stored or analyzed.
Instead of sending raw telemetry directly to tools, pipelines process the data first, so what reaches your dashboards is clean, structured, and useful.
By processing telemetry in real time, observability pipelines help teams reduce data noise, control ingestion costs, standardize telemetry formats, and route different data types to the appropriate monitoring or analytics platforms.
What Does an Observability Pipeline Do?
A pipeline doesn’t just move data, it actively improves it before ingestion:
- Parse unstructured logs into searchable key-value pairs
- Add context to events (service names, environments, versions, that kind of thing)
- Filter out noise that wastes storage space and clutters your searches
- Route different types of data to different places based on rules you set
- Strip out sensitive stuff before it leaves your infrastructure
- Normalize formats so your dashboards don’t explode when someone changes how a service logs
If you’re new to observability, think of this like finally setting up an assembly line instead of hand-crafting every piece. If you’ve been at this for a while, it’s the automation that replaces all those scripts you’ve been duct-taping together.
Why Observability Pipelines Matter
Most teams begin with a simple observability setup. A few services generate logs and metrics, and everything is sent directly to monitoring platforms. At this stage, the setup works because the volume of telemetry is manageable and the infrastructure is relatively small.
Most teams start with a simple setup. A few services generate logs and metrics, and everything is sent directly to monitoring tools. It works at first because the volume is manageable.
However, as systems grow, the situation changes quickly.
The Observability Growth Problem
Over time, teams add more services, deploy microservices, and adopt containerized infrastructure. Different teams may use different logging frameworks or telemetry formats. At the same time, cloud providers generate large volumes of infrastructure metrics and events.
As telemetry volume increases, several challenges start to appear:
- Observability costs increase due to high ingestion and storage volumes
- Logs and metrics contain large amounts of low-value or duplicate data
- Engineers spend time writing complex queries to extract useful signals
- Inconsistent log formats make debugging and correlation difficult
This situation is common in modern engineering teams where telemetry grows faster than the observability systems designed to manage it.
Observability pipelines address this challenge by processing telemetry before it reaches observability backends, ensuring that only useful and structured data is stored and analyzed.
Core Benefits of Observability Pipelines
Observability pipelines help teams reduce costs, improve data quality, enhance security, speed up incident response, avoid vendor lock-in, and increase operational efficiency by processing telemetry data before it reaches observability tools.
Here’s what actually changes when you set up a pipeline:
1. Cost Control
Observability pipelines allow teams to filter, sample, or drop low-value telemetry before it reaches storage systems. For example, health-check logs, verbose debug logs, or high-volume traces can be filtered or sampled at the pipeline level.
By controlling data ingestion early, many organizations reduce 40-60% observability storage and indexing costs.
2. Consistent Data Quality
Pipelines can parse and normalize telemetry formats at ingestion. Logs that arrive as unstructured text can be converted into structured fields, and inconsistent naming conventions can be standardized.
As a result, all teams work with consistent telemetry schemas, improving dashboard reliability and query performance.
3. Security and Compliance
Telemetry sometimes contains sensitive information such as API keys, tokens, or personally identifiable information (PII). Observability pipelines can automatically redact or mask sensitive data before it leaves the infrastructure.
This ensures compliance with security policies and prevents accidental exposure of sensitive data in external observability platforms.
4. Faster Incident Response
When telemetry is parsed, enriched, and normalized, engineers can quickly search and correlate logs, metrics, and traces. Shared identifiers such as service, environment, trace_id, and request_id make it easier to identify root causes during incidents.
This significantly reduces the time required to investigate production issues.
5. Vendor Flexibility
Observability pipelines decouple telemetry collection from the backend where the data is stored. Teams can route the same telemetry data to multiple destinations or switch observability vendors without modifying application instrumentation.
This abstraction layer gives organizations greater flexibility and reduces vendor lock-in.
6. Operational Efficiency
By processing telemetry before storage, pipelines ensure that dashboards and alerts rely on clean, structured data. This reduces alert noise, simplifies queries, and prevents dashboards from breaking when log formats change.
Engineers spend less time cleaning data and more time focusing on system reliability and performance.
When Do You Need an Observability Pipeline?
You may need an observability pipeline if your current monitoring setup is becoming difficult to manage as systems scale.
Common signs include:
- Your observability bill is growing faster than your headcount
- Engineers complain that logs are “too noisy” to be useful
- Different teams use inconsistent telemetry fields or logging formats
- You’ve accidentally leaked sensitive data into a third-party SaaS tool
- Correlating logs with traces requires manual timestamp matching
- Dashboards break every time someone changes a log format
- You’re storing gigabytes of data you never actually search
- Compliance requires you to mask PII before it leaves your network
Many teams reach a tipping point when their systems grow to 10–15 services or more, and telemetry volume begins to grow faster than the tools used to manage it.
At this stage, an observability pipeline helps control telemetry ingestion, improve data quality, and ensure that monitoring systems receive only the data that actually provides value.
How Observability Pipelines Work
An observability pipeline processes telemetry data before it reaches monitoring or analytics platforms. Instead of sending raw logs, metrics, and traces directly to storage backends, the pipeline collects, transforms, and routes the data in real time.
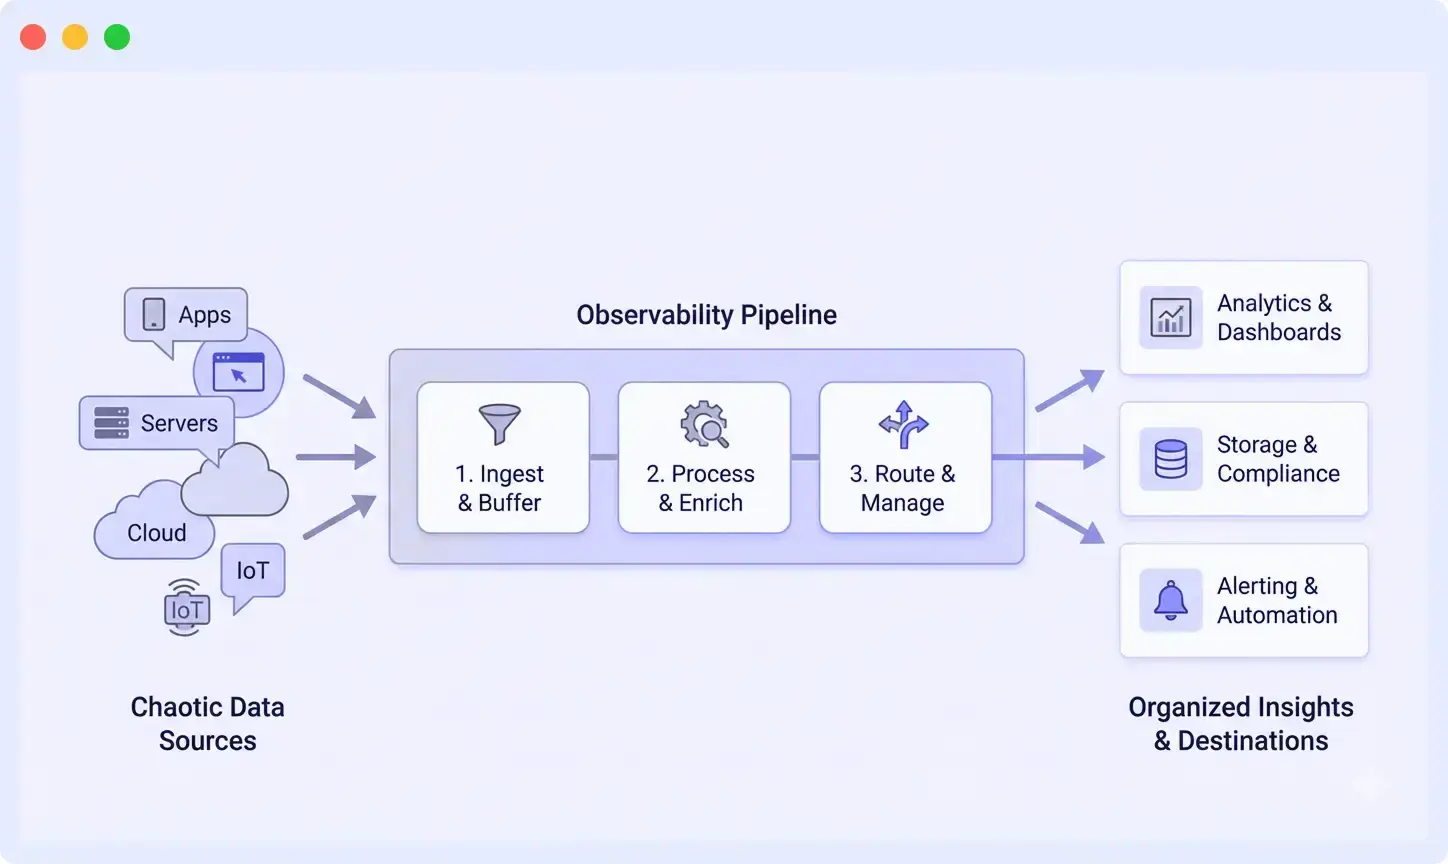
A typical observability pipeline includes four main stages.
Step 1: Collect Telemetry from Multiple Sources
The pipeline begins by collecting telemetry data from multiple sources across the infrastructure.
Common sources include:
- Cloud services report events and state changes
- Applications generating logs
- Kubernetes nodes exposing infrastructure metrics
- Instrumented services sending distributed traces
Telemetry is usually collected using lightweight agents or collectors deployed close to the source. These collectors may run:
- on virtual machines or EC2 instances
- as sidecars or DaemonSets in Kubernetes clusters
- as centralized gateways handling network telemetry
At this stage, telemetry formats can vary widely. Some services produce structured JSON logs, while others generate plain text or legacy formats such as XML. The telemetry collector’s primary responsibility is to reliably ingest this data and forward it to the processing layer without losing information during spikes in traffic or retries.
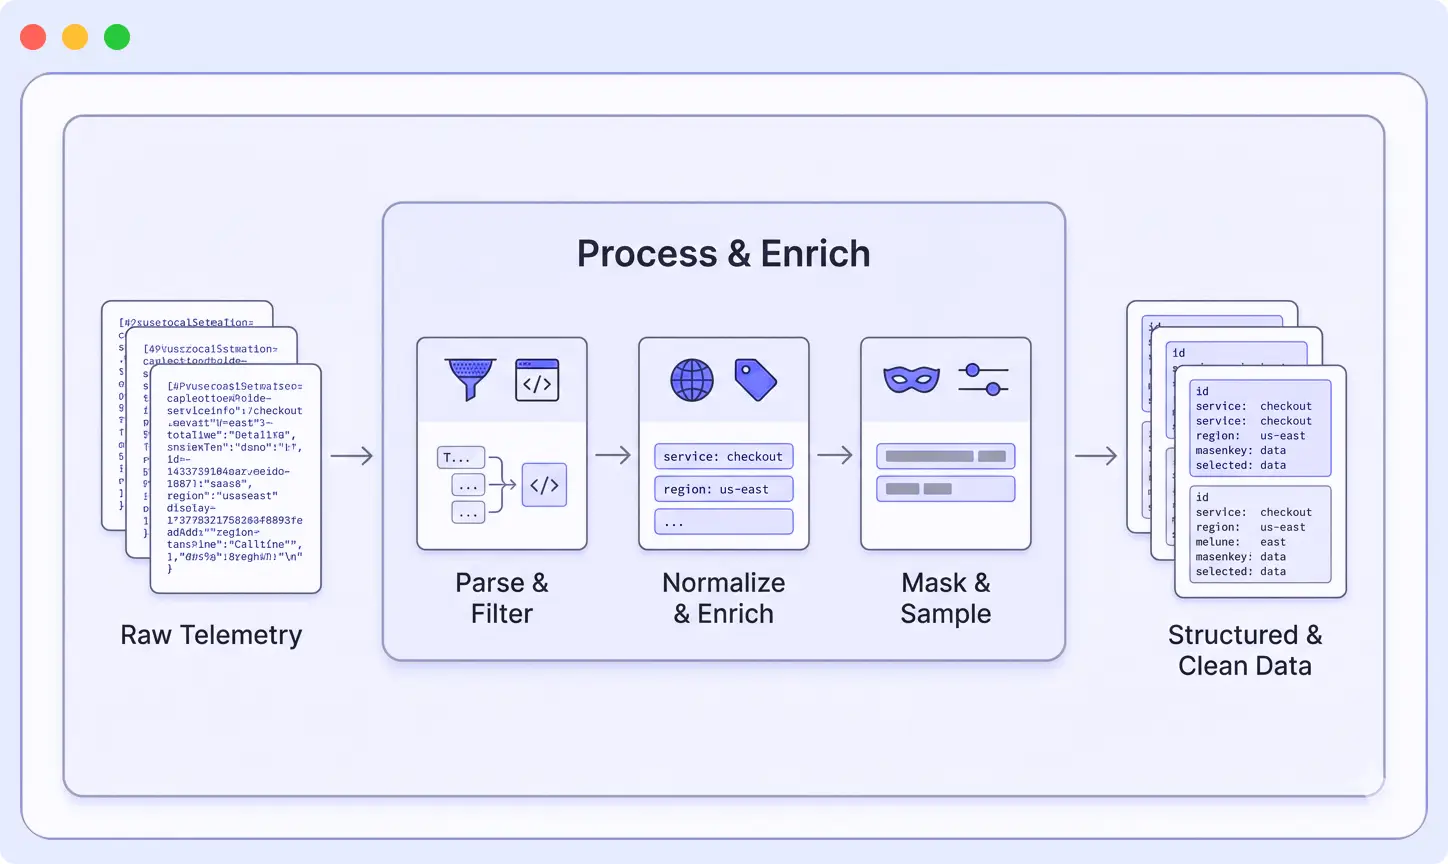
Step 2: Transform and Process Telemetry
At this point, logs, metrics, and traces are still messy. Different formats, missing context, and a lot of unnecessary data. The pipeline processes this data so it’s easier to search, analyze, and store. The transformation stage is where telemetry data becomes usable for monitoring and analysis.
Pipelines apply a few common operations:
Parsing
Unstructured logs (like plain text or XML) are converted into structured fields.
This makes data searchable without writing complex queries.
That XML blob with seventeen nested tags? Becomes a clean set of searchable fields. The inconsistent JSON? Normalized into a standard schema.
Enrichment
Additional context is added to each event, such as: Every log gets tagged with env: production, service: checkout, region: us-west-2, version: 2.3.1. When something breaks, you can instantly filter to exactly what you need.
Filtering
Low-value data is removed before storage. Here is where you save serious money:
- Health check logs that fire every five seconds and account for 40% of storage costs? Gone.
- Debug logs from staging? Dropped.
- Does that service log every database query? Sampled down to 1%.
This reduces noise and avoids storing data you don’t use.
Redaction
Sensitive information is removed or masked. API keys, passwords, credit card numbers, PII, all masked or removed before data leaves your infrastructure. This step helps prevent accidental exposure in external tools.
Sampling
High-volume data is reduced to a smaller, useful subset. You don’t need every single trace from an endpoint hit a million times per hour. Keep 1%, and you’ll still have 10,000 traces to analyze. However, for error cases, keep everything.
Field normalization
Field names are standardized across services. Pick a standard, timestamp not ts, service_name not svc, and enforce it. Your future self writing queries will thank you.
Step 3: Route Data to the Right Destinations
After telemetry is processed, the pipeline routes the data to appropriate destinations based on predefined rules.
Examples include:
- Production error logs routed to the primary observability platform
- Security events sent to a SIEM platform
- Development telemetry stored in lower-cost cold storage
- Traces sent to a distributed tracing backend
Some teams also route the same telemetry data to multiple destinations. For example, metrics may be sent both to a monitoring platform and to a data warehouse for long-term analytics.
Exporters within the pipeline manage delivery reliability by handling retries, buffering, and backpressure when destination systems are temporarily unavailable.
The transformation stage cleans and organizes telemetry so it becomes structured, consistent, and easier to work with before it reaches your observability tools.
Step 4: Clean Telemetry Reaches Observability Tools
Once telemetry passes through the pipeline, it reaches observability platforms in a structured and optimized format.
As a result:
- Searches are fast (you’re querying structured fields, not running regex against text)
- Queries are simple (service=”checkout” AND level=”error” instead of regex monsters)
- Dashboards don’t randomly break when services change log formats
- Alerts trigger on meaningful signals, actual user problems, not noise
- Correlation between logs, metrics, and traces works because everything shares common fields
By performing processing before ingestion, observability pipelines ensure that monitoring systems receive high-quality telemetry that is easier to search, analyze, and act upon.
Observability Pipeline Architecture: Key Components
A typical observability pipeline is built around several core components that work together to collect, process, and deliver telemetry data efficiently.
1. Collection Layer
The collection layer gathers telemetry data from various sources across the infrastructure. This layer usually consists of lightweight agents or collectors deployed close to the data source.
Collectors are responsible for reliably ingesting telemetry while minimizing resource overhead. They also buffer data temporarily when downstream systems experience delays.
Common collection tools include:
- OpenTelemetry Collector
- Fluent Bit
- Vector
- Vendor-specific agents
Collectors can run on virtual machines, inside containers, or as Kubernetes DaemonSets to ensure consistent data collection across environments.
2. Processing Layer
The processing layer is where telemetry data is transformed and optimized before storage.
Processors in this layer perform several important tasks:
- Parsing unstructured logs into structured fields
- Enriching events with metadata such as service name, environment, or region
- Filtering low-value telemetry to reduce ingestion volume
- Redacting sensitive data such as API keys or personally identifiable information
- Sampling high-volume traces or logs
- Normalizing fields so telemetry uses consistent naming conventions
This layer is typically stateless and horizontally scalable, allowing it to handle large spikes in telemetry traffic.
3. Routing Layer
The routing layer determines where processed telemetry should be sent. Instead of sending all data to a single destination, the pipeline can route different data types to the most appropriate systems.
For example:
- Logs may be sent to a log management platform
- Metrics may be routed to a time-series database
- Traces may be forwarded to a distributed tracing system
- Security events may be sent to a SIEM platform
Exporters in the routing layer handle retries, buffering, and backpressure to ensure reliable delivery when destination systems experience latency or downtime.
4. Destination Layer
After processing and routing, telemetry data reaches its final destinations. These may include observability platforms, analytics systems, or long-term storage environments.
Common destinations include:
- Observability and monitoring platforms
- Security monitoring tools (SIEM)
- Data lakes or warehouses
- Long-term archival storage
Because telemetry has already been cleaned and structured by the pipeline, these systems can index and analyze the data more efficiently.
Real Example: Parsing XML Logs with a Pipeline
Theory is useful, but a real example makes observability pipelines easier to understand. Let’s look at a common pain point: XML logs.
If you’ve worked with them before, you probably just groaned. If you haven’t, consider yourself lucky.
The XML Nightmare
Maybe you’re integrating with a legacy enterprise system. Maybe it’s a third-party API that refuses to modernize. Either way, you’re stuck with logs that look like this:
<log>

  <timestamp>2025-12-01T10:15:30Z</timestamp>
  <level>ERROR</level>
  <service>checkout</service>
  <requestId>abc123</requestId>
  <message>Payment failed</message>
  <errorCode>PMT_42</errorCode>
  <additionalContext>
    <customerTier>premium</customerTier>
    <paymentMethod>credit_card</paymentMethod>
  </additionalContext>
</log>
Without an observability pipeline, your backend often stores this entire log as one large text string.
Now imagine trying to analyze it.
Want to find all checkout errors? You’re writing regex.
Want to trigger an alert when PMT_42 spikes? Now you’re building fragile parsing rules.
Everything becomes slower and more complicated than it should be.
How Pipeline Parsing Fixes Everything
When this log passes through an observability pipeline with an XML parser, it gets converted into structured data like this:
{

  "timestamp": "2025-12-01T10:15:30Z",
  "level": "ERROR",
  "service": "checkout",
  "request_id": "abc123",
  "message": "Payment failed",
  "error_code": "PMT_42",
  "customer_tier": "premium",
  "payment_method": "credit_card"
}
Suddenly, working with the data becomes much easier.
- Filter with simple queries: service=”checkout” AND level=”ERROR”
- Group errors by error_code to see which failures are most common
- Alert when error_code=”PMT_42″ crosses a threshold
- Correlate logs with traces using request_id
- Segment errors by customer_tier to see if premium customers are affected differently
All without writing a single line of regex.
You also reduce storage overhead. Instead of storing nested XML tags and redundant metadata, the system stores only the structured fields that matter.
Much of this complexity can also be avoided by adopting consistent log formatting practices from the beginning, but observability pipelines provide a safety net when dealing with legacy or inconsistent log formats.
Much of this complexity can be avoided by following consistent log formatting practices from the start.
Observability Pipeline vs Log Forwarding: What’s the Difference?
Observability pipelines are often confused with traditional log forwarding tools, but the two serve very different purposes.
Log Forwarding
Traditional log forwarders, such as rsyslog or basic Fluentd setups, primarily move data from point A to point B.
They typically handle tasks like:
- collecting logs from sources
- buffering data during temporary outages
- forwarding logs to a storage or monitoring system
- applying basic filtering
However, log forwarders usually do not transform the data in a meaningful way. The backend receives logs exactly as they were generated.
In simple terms, you get what you collect.
Observability Pipelines
Observability pipelines go much further by processing telemetry data in transit.
They can:
- parse unstructured logs into structured fields
- enrich events with metadata such as service, environment, or region
- filter out low-value or noisy logs
- normalize field formats across different services
- route telemetry to multiple observability backends
This processing ensures that the data reaching your monitoring tools is clean, structured, and ready for analysis.
Common Mistakes with Observability Pipelines (And How to Avoid Them)
Even teams that implement observability pipelines often run into predictable challenges. Understanding these common mistakes can help you design a pipeline that actually improves observability instead of adding unnecessary complexity.
Mistake #1: Using the Pipeline as an Expensive Forwarder
Some teams spin up a pipeline and just forward data through it unchanged. No parsing, no filtering, no enrichment. Just data in, data out.
Congratulations, you’ve built an over-engineered data mover that costs more than the simple agents you replaced.
The fix is simple: Actually use the pipeline’s capabilities. Configure parsers to extract fields. Add processors that enrich data with tags. Set up filters that drop noise you’ll never look at.
Mistake #2: Cleaning Data Only in the Backend
Another common mistake is pushing raw logs into the observability backend and parsing them in dashboards or queries.
The problem compounds quickly. Every dashboard has its own custom parsing logic. Queries run slower because you’re parsing on every search. Things break constantly when log formats change because fifteen different dashboards need updating.
Move that work into the pipeline. Parse once at ingestion. Everyone downstream gets clean data automatically.
Mistake #3: Uncontrolled Observability Costs
Nobody actively decides what data deserves storage. Everything gets ingested by default: production, staging, debug logs, health checks, and verbose tracing.
Then the invoice arrives, and observability costs become a budget line item getting executive attention.
Get ruthless about filtering in the pipeline:
- Drop health check logs that provide zero value
- Sample high-volume traces to 1-10%, depending on traffic
- Route development data to cheaper storage or drop it entirely
- Use tools like Middleware to see volume breakdowns by service and tune based on actual data
Control what gets ingested before costs lock in. Storage is expensive. Regret is expensive. Prevention is cheap.
Mistake #4: Inconsistent Telemetry Fields
Your logs, metrics, and traces all use different field names. Logs call it svc, metrics call it service, traces call it service_name.
Matching them up requires manual detective work every time you debug an incident. This isn’t just annoying, it slows down incident response when every second matters.
Fix it in the pipeline. Normalize telemetry and enrich everything with shared identifiers: service, environment, request_id, trace_id. Pick a standard and enforce it.
To better understand which logs are worth keeping and which ones should be filtered or sampled, see Middleware’s guide on understanding common log levels in detail.
Middleware: Observability Pipeline Tool
Middleware’s built for teams wanting pipelines without the operational headache. Handles collection, parsing, enrichment, filtering, routing right out of the box.
The Middleware Observability Pipeline is designed as a unified platform where correlation between logs, metrics, and traces works automatically. Cost controls are built in so you can see what’s generating volume and adjust on the fly.
What makes it different? Everything’s integrated from day one. You’re not stitching together separate tools for collection, processing, and storage. The pipeline processes your telemetry data in real-time, applying transformations, enrichment, and filtering before data hits your backends.
You can read more about how it works in their pipeline announcement.
Best for: teams wanting to actually use observability data, not build and maintain pipeline infrastructure.
Implementing an Observability Pipeline: Where to Start
If you’re convinced pipelines make sense for your team, here’s a practical roadmap:
1. Audit Your Current State Document what data you’re collecting, where it’s going, and what it costs. Identify the biggest pain points, noise, cost, inconsistent formats, slow queries.
2. Start with One High-Value Use Case Don’t try to pipeline everything at once. Pick one annoying problem and solve it. Maybe it’s parsing XML logs, filtering health checks, or normalizing field names across three services.
3. Choose Your Architecture: Decide whether you want a managed platform or self-hosted infrastructure. Consider your team’s operational capacity and comfort with running distributed systems.
4. Deploy Collectors Close to Sources. Start with one service or environment. Deploy collectors as sidecars, DaemonSets, or standalone agents. Test that data flows correctly.
5. Add Transformations Incrementally. Start with parsing. Then add enrichment. Then filtering. Test each transformation with real data before moving to the next.
6. Route to Destinations Configure exporters to send data where it needs to go. Test retries, backpressure handling, and failover behavior.
7. Monitor the Pipeline Itself. Your pipeline is now critical infrastructure. Monitor infrastructure health, throughput, error rates, and resource usage. Set up alerts for when things go wrong.
8. Expand Coverage Gradually Once one service works well, add another. Share patterns across teams. Build a library of parsers and enrichment rules you can reuse.
The key is starting small and proving value quickly. Don’t try to boil the ocean.
Conclusion
Observability today isn’t about collecting more data it’s about collecting the right data and making sure it’s actually useful when things go wrong.
As systems grow more distributed, raw logs, metrics, and traces quickly turn into noise. That’s where observability pipelines make the difference. They give you a place to clean, shape, and control telemetry before it reaches your tools, so teams spend less time fighting data and more time fixing real problems.
From parsing verbose XML logs to enriching signals with context and routing data smartly, a good pipeline becomes the foundation of a healthy observability stack not just another component.
Start building a smarter observability setup today → Try Middleware Pipeline and see how structured telemetry can cut costs and speed up incident response.
FAQs
What's the difference between an observability pipeline and an ETL pipeline?
They’re similar concepts but optimized for different use cases. ETL pipelines batch-process data for analytics warehouses. Observability pipelines stream-process telemetry in real-time for monitoring and debugging. The transformations are also different, observability focuses on parsing logs, enriching with metadata, and filtering noise, while ETL focuses on data cleansing, aggregations, and schema mapping.
Do I need a pipeline if I'm already using OpenTelemetry?
OpenTelemetry handles instrumentation (generating telemetry) but doesn’t process it. You still need something to collect, transform, and route that data. The OpenTelemetry Collector is actually one of the most popular pipeline implementations. So yes, you still need a pipeline, OpenTelemetry just makes it easier to implement.
How much does it cost to run an observability pipeline?
It depends on your architecture. Managed platforms like Middleware include pipeline capabilities in their pricing. Self-hosted options like OpenTelemetry Collector cost whatever infrastructure you run it on, typically 5-10% of your total observability budget. However, the savings from filtering noise usually far exceed the pipeline’s operational cost.
Can I use multiple pipelines for different data types?
Absolutely. Some teams run separate pipelines for logs, metrics, and traces. Others use a unified pipeline that handles everything. The unified approach gives you better correlation but requires more upfront design. Start with whatever makes sense for your team’s maturity and scale.
What happens if my pipeline goes down?
This is why buffering and failover matter. Well-designed pipelines buffer data at collection points when downstream systems are unavailable. You might lose real-time visibility temporarily, but you won’t lose data. For critical systems, teams often run pipelines in high-availability configurations with multiple instances behind load balancers.
How do observability pipelines affect data latency?
Minimal impact if designed well. Most transformations add milliseconds of latency. The real latency usually comes from network hops and backend ingestion, not the pipeline itself. Teams typically see latencies under 100ms from collection to storage, which is fine for most observability use cases.