
Summary: Endpoint monitoring provides real-time visibility into API, device, and system performance to detect issues early, strengthen security, and reduce downtime.
Organizations operate in a rapidly expanding digital environment. A lot of people work from home offices, coffee shops, and corporate headquarters. Applications are deployed on physical servers, virtual machines, cloud, and containerized environments. About 40% of the global workforce now works remotely in some capacity, with 83% preferring hybrid models, increasing both the scale and complexity of modern IT environments.
Endpoint monitoring provides real-time visibility into device performance, API behavior, and security signals across your infrastructure.
In this guide, you’ll learn what endpoint monitoring is, why it’s critical, what it measures, and how to build an effective strategy using modern observability platforms like Middleware.
Key Takeaways
- Endpoint monitoring delivers real-time visibility into device, API, and system performance across distributed environments.
- Modern infrastructure requires monitoring beyond network boundaries, especially in remote and cloud-native setups.
- Effective endpoint monitoring focuses on meaningful signals like latency, errors, configurations, and user activity.
- Well-defined baselines and response workflows reduce alert fatigue and improve incident resolution speed.
- Integrated observability platforms connect endpoint data with metrics, logs, and traces for faster root cause analysis.
What is Endpoint Monitoring?
Endpoint monitoring is the continuous monitoring and analysis of computing devices and systems within an organization’s infrastructure. It is the process of gathering real-time information about system performance, security events, system configurations, and user activities, and consolidating it to analyze, issue alerts, and take necessary action.
At its core, endpoint monitoring addresses essential operational questions regarding the proper functioning of this device. Is it secure? Is it compliant with organizational policies?
This aims to identify inconsistencies, fix problems at the earliest, and ensure overall operational stability. Endpoint monitoring is an approach that helps IT and security teams address issues before they escalate into incidents or breaches.
What Qualifies as an Endpoint
The term “endpoint” has taken on multiple meanings. It now covers traditional user devices and all computing resources that connect to an organization’s system for tasks.
- User devices: laptops, desktops, tablets, and smartphones
- Servers: physical servers, virtual machines, cloud instances, bare-metal servers, and containerized nodes
- Specialized hardware: IoT devices, industrial control systems, and edge devices
- Infrastructure endpoints: containers, Kubernetes nodes, CI/CD agents, serverless compute
- Remote or hybrid endpoints: VPN-connected laptops, mobile employees, and contractor devices
These categories can be used to determine what should be monitored, as the strategies and telemetry collection can differ based on the type of endpoint and where it operates.
How Endpoint Monitoring Differs From Other Monitoring
| Monitoring Type | Focus |
| Endpoint Monitoring | Device-level health, performance, user activity, security signals, and configuration state |
| Network Monitoring | Traffic flow, connectivity, latency, and bandwidth between systems |
| Application Monitoring | Application performance, errors, and user experience |
| Infrastructure Monitoring | Resource utilization across servers, cloud infrastructure and VMs |
| Endpoint Security/ EDR | Malware prevention, incident response and threat detection. |
Endpoint monitoring gives clear insights into specific devices and systems. It adds to other monitoring types by focusing on endpoint performance and how they interact with users and workloads.
Why Modern Infrastructure Requires Endpoint Monitoring
Before remote work and BYOD (Bring Your Own Device), organizations used firewalls. They protected clear network boundaries. Most users, devices, and workloads operate in trusted environments.
Endpoints now operate beyond traditional networks. They connect to unmanaged environments and communicate directly with cloud-hosted apps and services on platforms such as Cloudways or DigitalOcean. Because of this, many performance problems, misconfigurations, and security incidents have their roots at the endpoint and not in the network.
Endpoint monitoring provides:
- Identification of performance degradation and misconfigurations early.
- Understanding of user-driven activity and access patterns.
- Continuous validation of endpoint security and compliance
- Faster incident investigation and root cause analysis
Endpoint Monitoring Architecture
Endpoint monitoring gathers signals from each system. It then provides clear, actionable insights at scale. Most endpoint monitoring setups have four key parts, though the details may differ.
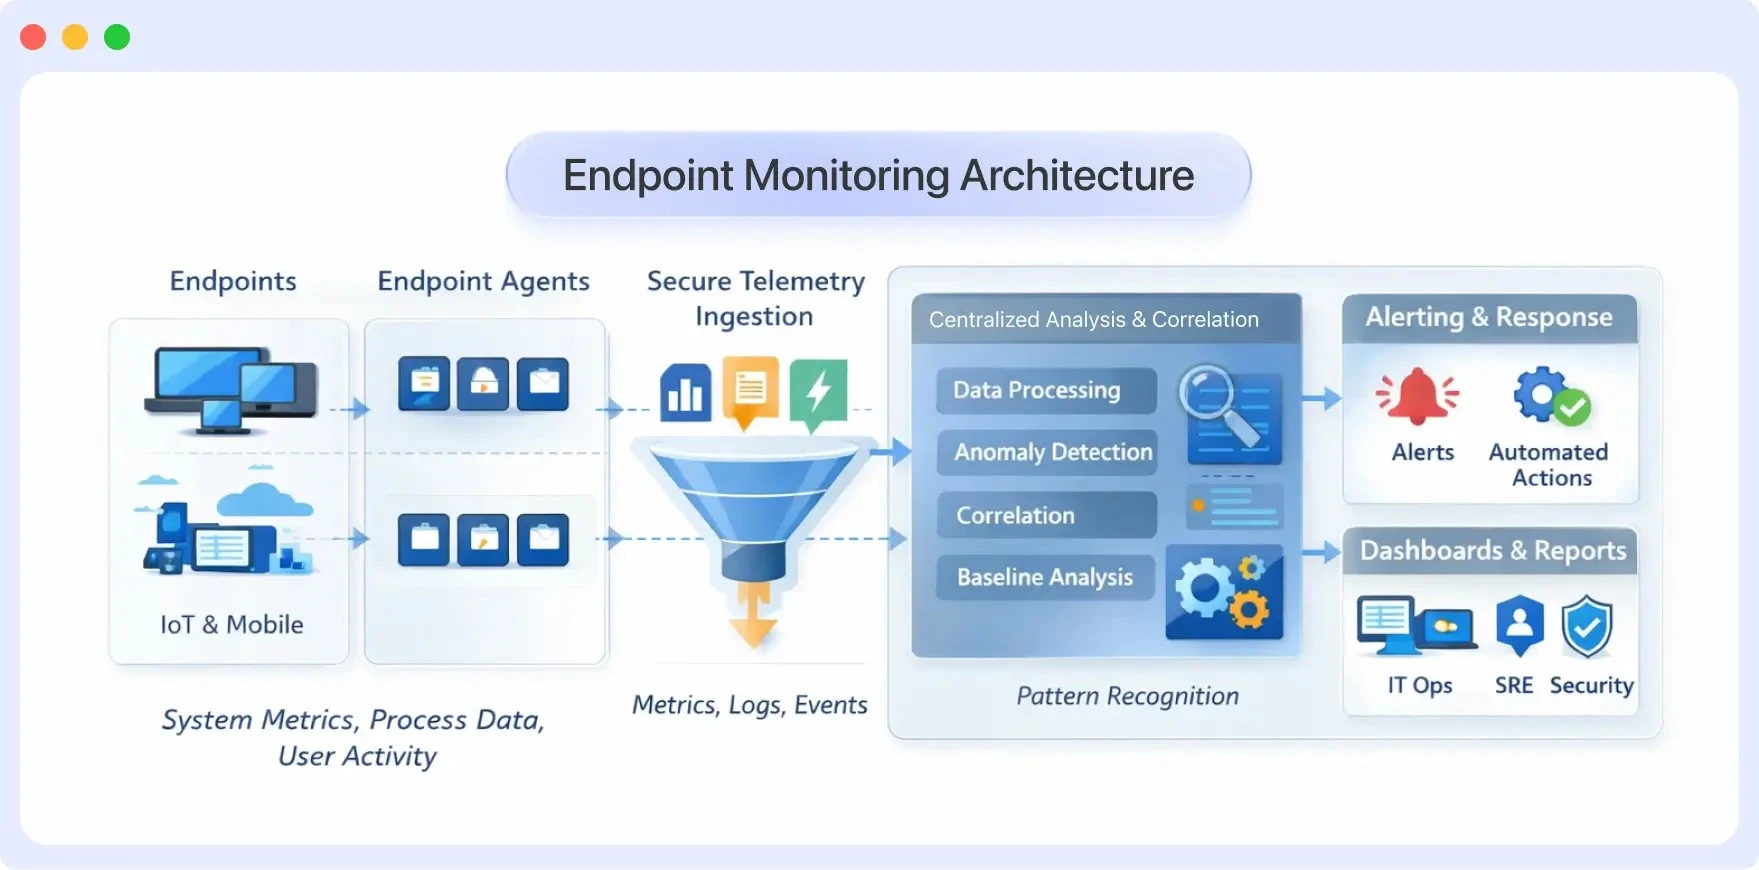
Core Components of Endpoint Monitoring
1. Endpoint Agents and Telemetry Collection
Endpoint agents are programs installed on devices to gather information about how they’re running. These agents capture essential telemetry, including system performance, active processes, and security events.
You can collect telemetry in different ways: agentless approaches, APIs, or platform integration. This is useful when you can’t install agents. The success of endpoint monitoring relies on choosing the right signals. It’s important to reduce performance overhead and avoid collecting unnecessary data.
2. Centralized Analysis and Correlation Platform
The collected telemetry is sent to a centralized platform where thousands of endpoints are aggregated, normalized and correlated. This layer enables teams to analyze trends across devices, identify outliers, and observe how endpoints change their behavior over time.
By comparing endpoint data with infrastructure and application indicators, teams can provide context that helps them differentiate between individual and large-scale problems.
3. Alerting and Response Engine
The alerting layer compares endpoint telemetry to pre-configured thresholds, baselines and behavioral patterns. In the event of an abnormal situation, such as resource overload, unpredictable process behavior, or configuration drift, the system generates alerts.
Response actions can take the form of notifications, workflow automation, or integration with IT and security systems, enabling responding teams to take quick action without relying on manual inspection.
4. Visualization and Reporting Layer
The visualization tools gather raw data from endpoints. They then create reports, dashboards, and timelines. This helps users see what is happening on the devices. The visualizations help teams track system health, analyze incidents, support audits, and update stakeholders.
Effective visualizations are important because they help identify patterns. These patterns may not be visible in monitoring logs or metrics.
Implementing an Endpoint Monitoring Strategy
Implementing endpoint monitoring isn’t about deploying agents everywhere and collecting as much data as possible. In fact, that approach often creates more problems than it solves. Having a defined purpose, gathering the appropriate telemetry and establishing response workflows that teams can work with in reality make the endpoint monitoring strategy truly functional.
Define Clear Monitoring Objectives
Before selecting tools or enabling data collection, it is important to consider what success looks like. In most cases, endpoint monitoring involves performance, security, and compliance.
It can be operational, such as detecting resource bottlenecks, unexpected crashes, or background issues that degrade the user experience.
Other times, it is security-related, such as detecting unusual activity, unauthorized access, or configuration changes that shouldn’t be occurring. Then there is the matter of regulated environments, where organizations use monitoring to ensure endpoints comply with internal policies and external regulations such as HIPAA, PCI-DSS, and GDPR.
Identify Critical Endpoints and Risk Levels
Not all endpoints carry the same risk or operational importance. Production servers, privileged user devices, CI/CD agents, and remote employee laptops often require deeper visibility than low-impact systems.
Classifying endpoints by risk and function allows teams to:
- Apply stricter monitoring controls where they matter most.
- Reduce performance overhead on low-risk devices.
- Focus alerts and response efforts on the issues that truly need attention.
Choose the Right Telemetry
Effective endpoint monitoring focuses on signal over noise. Common telemetry includes:
- System metrics (CPU, memory, disk, network)
- Process and service activities
- User login and session behavior
- Configuration state and changes
Avoid collecting data without a clear use case. Every signal should support detection, troubleshooting, or compliance goals.
Set Baselines and Thresholds
Static thresholds alone rarely work well in real environments. Endpoints exhibit distinct behaviors based on their role, workload, and user behavior. A developer’s workstation, for example, will look very different from a finance laptop or a shared kiosk.
Establishing behavioral baselines helps define what “normal” looks like for each endpoint or group of endpoints.
Design Alerting and Response Workflows
Alerts are only useful if someone knows what to do with them. Effective alerting is actionable, contextual, and well routed.
That means clearly defining:
- Which conditions actually warrant an alert?
- Who should receive it based on severity and ownership?
- How should escalation and response occur?
Linking alerts to incident management and collaboration tools makes them far more productive, particularly when endpoint monitoring is involved. This will enable teams to investigate more quickly, prepare responses, and solve problems before they escalate into larger incidents.
How Middleware Enhances Endpoint Monitoring for Organizations
Middleware monitors API endpoints, recognizing that today’s applications use many across various services. Middleware automatically finds API endpoints by tracking traffic. This saves teams from having to manually list and set up monitoring for each endpoint. It also gives instant insight into their performance and behavior.
This automatic discovery works across the entire service landscape. Endpoints from monolithic apps, microservices, containerized workloads, and cloud-native setups are monitored. This happens as services change and new endpoints are added. Monitoring adapts without manual intervention.
Our platform connects endpoint telemetry to a broader observability framework. This includes metrics, logs, and distributed traces. This helps teams see how one endpoint works. It also shows how it connects to the entire system during troubleshooting and incident analysis.
⚡Next step: Visualize endpoint performance across your services with Middleware Endpoint Monitoring → Explore Features
Endpoint Monitoring in Practice
Middleware’s Endpoints feature demonstrates how modern endpoint monitoring translates into actionable visibility. Rather than requiring manual configuration for each service endpoint, the platform uses trace traffic to automatically discover API endpoints and surface key operational signals.
Automatic Endpoint Discovery and Visibility
The Endpoints view provides real-time insight into:
- Request volume across the selected time range
- Error rates to identify problematic endpoints quickly
- P95 and P99 latency percentiles that reveal tail performance issues
- Service attribution showing where each endpoint is served from
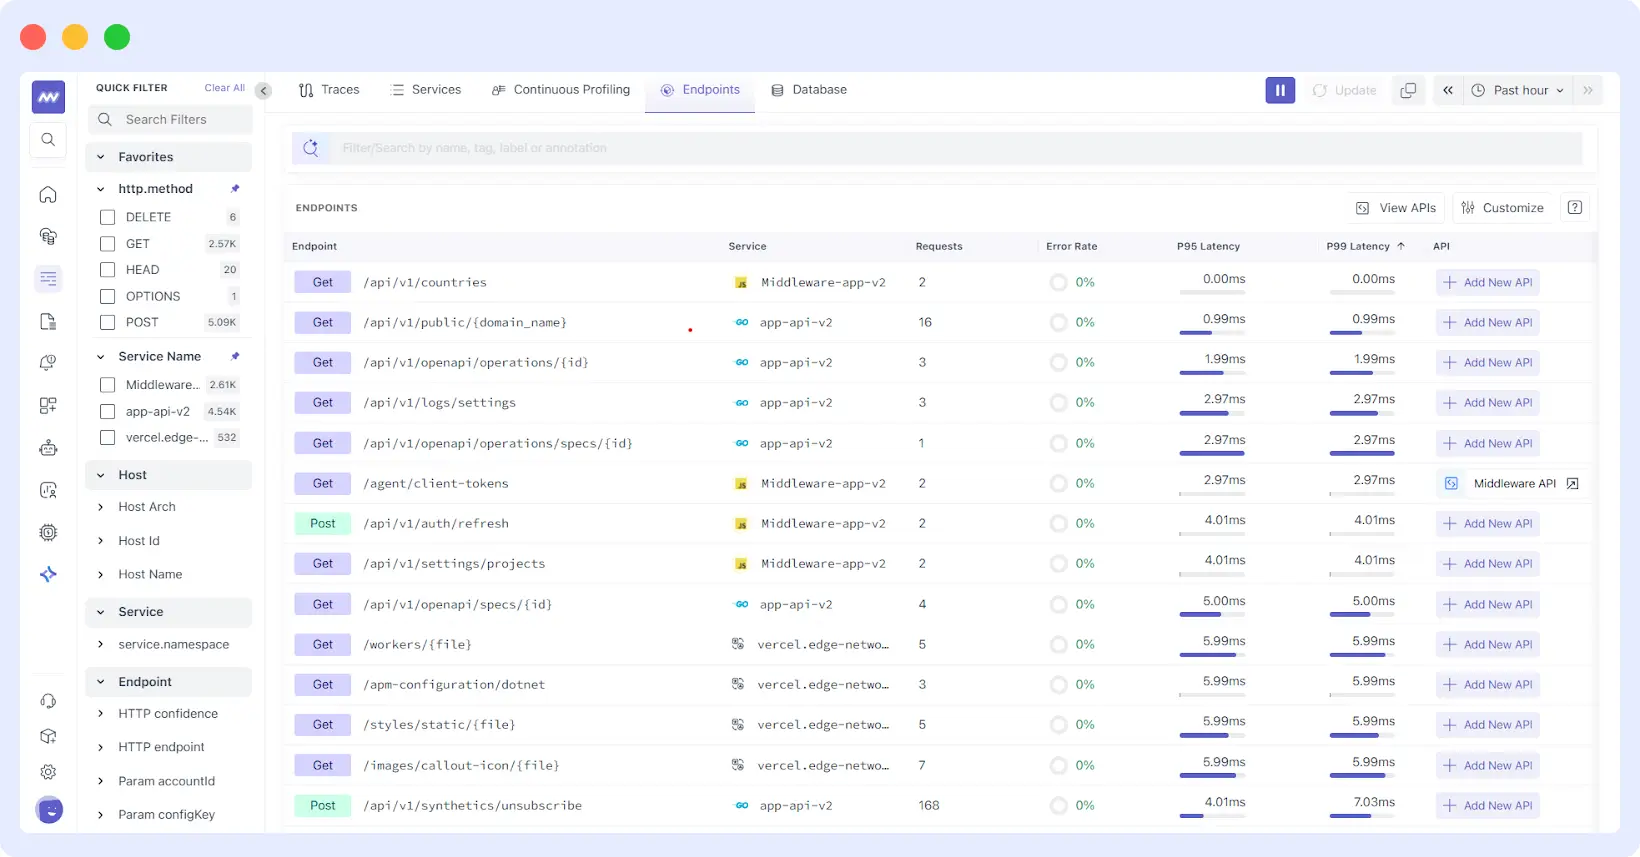
This automatic discovery means teams don’t need to maintain endpoint inventories manually. As services scale, evolve, or deploy new versions, the monitoring adapts automatically. This adjustment can be made without requiring configuration updates.
Enriching Endpoints with OpenAPI Specifications
Teams can enhance endpoint monitoring by linking OpenAPI (Swagger) specifications to their discovered endpoints. This integration bridges the gap between what the API is supposed to do (the contract) and what it actually does in runtime behavior.
By connecting an OpenAPI spec through GitHub or direct upload, Middleware enriches endpoint data with:
- Documented parameters grouped by location (path, query, header, cookie)
- Expected response definitions by HTTP status code
- Endpoint descriptions and documentation
This helps teams quickly spot when endpoints stray from expected behavior. This can occur due to unexpected parameters, undocumented response codes, or schema violations.
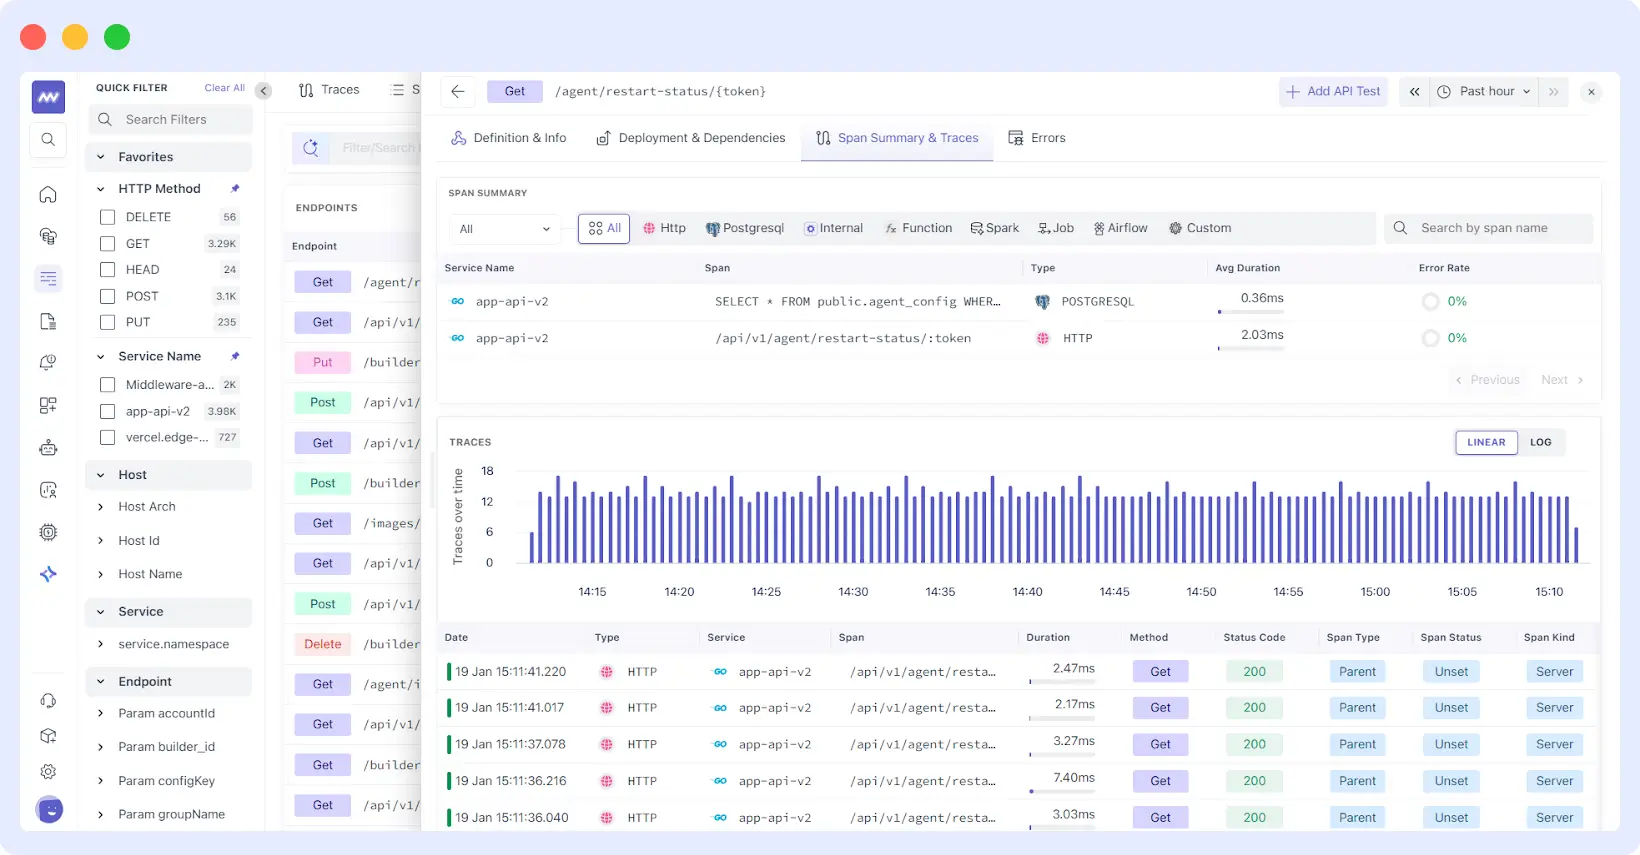
Runtime Behavior Analysis
For each endpoint, teams can drill into detailed views that combine:
Span-level performance breakdown shows where users spend time across HTTP calls, database queries, internal processing, and external dependencies. This granular view helps identify whether performance issues stem from the endpoint itself or downstream services.
👀If you’re actively troubleshooting performance degradation, this guide on fixing application performance issues walks through practical remediation steps.
Deployment comparison that tracks endpoint behavior across service versions, making it easy to spot whether a new release improved or degraded performance using metrics such as requests per second, latency percentiles, error rates, and Apdex scores.
Trace-level investigation with access to individual request traces, enabling root cause analysis when specific requests exhibit unusual behavior or errors.
Error-Focused Investigation
The dedicated Errors view consolidates failure patterns for each endpoint, helping teams answer “what’s breaking here” after identifying elevated error rates. This focused method reduces the time needed to check logs or link events across different tools.
What This Means for Your Organization
By focusing on meaningful signals such as latency, errors, and request volume, the platform reduces noise and highlights what truly matters. Context is preserved through integrated API documentation, ensuring alignment between expected and actual behavior. Clear pathways from detection to investigation enable teams to move quickly from anomaly identification to root cause analysis.
Teams can move from noticing an anomaly in the endpoint list to understanding its root cause in the span breakdown. They can do this without switching tools or losing context. This seamless process helps maintain clarity and efficiency.
Ready to see how Middleware can transform your endpoint monitoring strategy? Start your free trial or schedule a demo to explore how automatic endpoint discovery and OpenAPI integration can help your team detect and resolve issues faster.
FAQ
How does AI improve endpoint monitoring?
AI aids endpoint monitoring by detecting patterns and anomalies in vast amounts of telemetry data. These issues are often hard to spot without automation. It helps set behavior standards, spot unusual activities, reduce alert fatigue, and rank issues by impact at single threshold levels.
Can I integrate endpoint monitoring with my existing tools?
Yes. You can integrate Incident management systems (PagerDuty, Opsgenie), communication systems (Slack, Microsoft Teams), ticketing systems (Jira, ServiceNow), SIEM platforms, and CI/CD tools with modern platforms via APIs and pre-built connectors. These integrations are also natively supported by Middleware.
How does endpoint monitoring work in remote or hybrid environments?
Agents on devices and workloads enable endpoint monitoring to gather telemetry anywhere. This makes it useful in remote and hybrid environments, where endpoints can be outside normal network boundaries.
What’s the difference between endpoint monitoring and endpoint security?
Endpoint monitoring tracks the performance, availability, configuration, and operational behavior of devices and service endpoints across an environment. Endpoint security solutions (such as EDR/EPP) focus specifically on detecting threats, preventing malware, and responding to security incidents. While security tools identify and contain attacks, endpoint monitoring provides a broader operational context, helping teams distinguish between malicious activity and legitimate workload behavior.
Is endpoint monitoring useful in cloud-native environments?
Endpoints in cloud-native environments typically comprise virtual machines, containers, Kubernetes workloads, and service interfaces. Endpoint monitoring gives teams a clear view of these changing components. This helps them track performance and behavior as workloads shift.
How do organizations measure the effectiveness of endpoint monitoring?
Important indicators include the mean time to detect (MTTD) and resolve (MTTR) incidents, endpoint coverage, alert accuracy, false positives, user-reported problems, compliance audit success, and a reduction in unplanned downtime. Effective monitoring reduces MTTD and MTTR and helps detect problems before they affect users.


