



Summary: We evaluated 12 log management tools from unified observability platforms like Middleware and Datadog to open-source options like Grafana Loki and the ELK Stack across pricing, OpenTelemetry support, Kubernetes-native logging, and AI-assisted analysis. Pricing ranges from free self-hosted setups to usage-based plans running into five figures a month at scale. No single tool wins every category: the right choice depends on whether you’re optimizing for cost, existing infrastructure, team size, or log volume.
Key Takeaways
- Pricing spans a wide range from free self-hosted open-source tools to usage-based enterprise plans reaching well into five figures per month at high log volumes.
- Most modern platforms now support OpenTelemetry, though depth varies some offer full OTel-native ingestion, others need additional collectors or plugins.
- Kubernetes-native logging is increasingly standard, but implementation differs some tools auto-discover pods and containers out of the box, others require manual agent configuration.
- AI-assisted features (anomaly detection, log summarization, natural-language search) are becoming a differentiator, though maturity varies core to some platforms, early-stage add-ons in others.
- Open-source options trade lower cost for higher operational overhead self-hosting and maintaining tools like the ELK Stack or Grafana Loki requires dedicated engineering time that hosted platforms remove.
- Unified observability platforms (logs, metrics & traces in one place) reduce context-switching compared to standalone log-only tools that require stitching data together across systems.
This guide cuts through the noise with verified pricing, honest tradeoffs, and a clear recommendation for every team size, so you can make a confident platform decision that holds up for the next 3 to 5 years.
What is a log management tool?
A log management tool collects, centralizes, stores, indexes, and makes searchable the log data generated by every layer of your stack: applications, servers, Kubernetes pods, cloud services, and network devices. Without one, debugging a production incident means manually SSH-ing into individual servers or grepping through disconnected files across dozens of services.
For a deeper dive into how log management works and why it matters, see our full guide: What is log management?
When evaluating platforms, these are the six capabilities that separate good tools from great ones:
- Ingestion flexibility: can it collect logs from all your sources (Kubernetes, cloud functions, on-premise servers, third-party services)?
- Search performance: how fast are full-text and structured queries across 30-day log windows at your actual data volume?
- Cross-signal correlation: can you jump from a log event directly to the related trace or metric without switching dashboards?
- Cost predictability: is the pricing model transparent enough to model costs at 2x your current volume without surprises?
- Vendor lock-in risk: is data stored in an open format (OpenTelemetry) or a proprietary format that makes migration painful?
- AI capabilities: does the platform detect anomalies, surface patterns, and suggest or apply fixes automatically?
With that framework in place, here are the 12 best log management tools available in 2026.
2026 log management tools: comparison at a glance
| Platform | OTel support | K8s depth | AI capabilities | Deployment | Starting price | Best for |
|---|---|---|---|---|---|---|
| Middleware | Native | Deep + Auto Fix | OpsAI: RCA, auto-remediation, PR generation | SaaS | Free trial 14 days; $0.30/GB (pay as you go) | Full-stack teams, Kubernetes-heavy, cost-conscious |
| Datadog | Partial | Strong | Watchdog anomaly detection, Bits AI | SaaS | $0.10/GB ingestion + $1.70/GB indexing | Large enterprise, broadest integrations |
| Dynatrace | Partial | Strong | Davis AI: automated root-cause analysis | SaaS / Hybrid | $0.20/GiB ingestion + retention + query fees | Enterprise, complex hybrid/multi-cloud |
| New Relic | Partial | Moderate | NRAI assistant, anomaly detection | SaaS | Free 100 GB/mo; $0.35/GB after | Mid-market, APM-centric teams |
| Splunk | Limited | Moderate | ML anomaly detection, ITSI, SPL AI assist | SaaS / Self-hosted / Hybrid | ~$225/mo (100 GB/day); enterprise custom | Security/SIEM, regulated industries |
| Grafana Loki | Native | Strong | Limited (via Grafana ML plugins) | Self-hosted / SaaS | Open-source free; Grafana Cloud from $0.50/GB | Prometheus/Grafana teams, cost-sensitive |
| Elastic (ELK) | Partial | Moderate | ML anomaly detection (Platinum+) | Self-hosted / SaaS | Open-source free; Elastic Cloud ~$95/mo+ | Custom self-managed stacks, full-text search |
| SigNoz | Native | Moderate | Basic anomaly detection | Self-hosted / Cloud | Open-source free; Cloud from $199/mo | OTel-native teams, self-hosted alternative to Datadog |
| Graylog | Limited | Limited | Enterprise anomaly add-on only | Self-hosted / SaaS | Open-source free; Enterprise from $1,250/mo | Mid-market IT ops, structured logging, RBAC |
| Better Stack | Partial | Limited | Basic alerting intelligence | SaaS | $0.30/GB (pay as you go) | Startups, simple incident management |
| Sematext | Partial | Moderate | Basic anomaly detection | SaaS / Self-hosted | Logs from $50/mo | SMBs, cost-effective alternative to Datadog |
| Papertrail | Requires integration | Limited | None | SaaS | Free tier; from $7/mo | Solo devs, simple apps |
1. Middleware
Middleware is a modern, OpenTelemetry-native full-stack observability platform. It addresses the core problem most cloud-native teams face: logs, metrics, traces, and user experience data are scattered across multiple tools, making every production incident a multi-dashboard scavenger hunt.
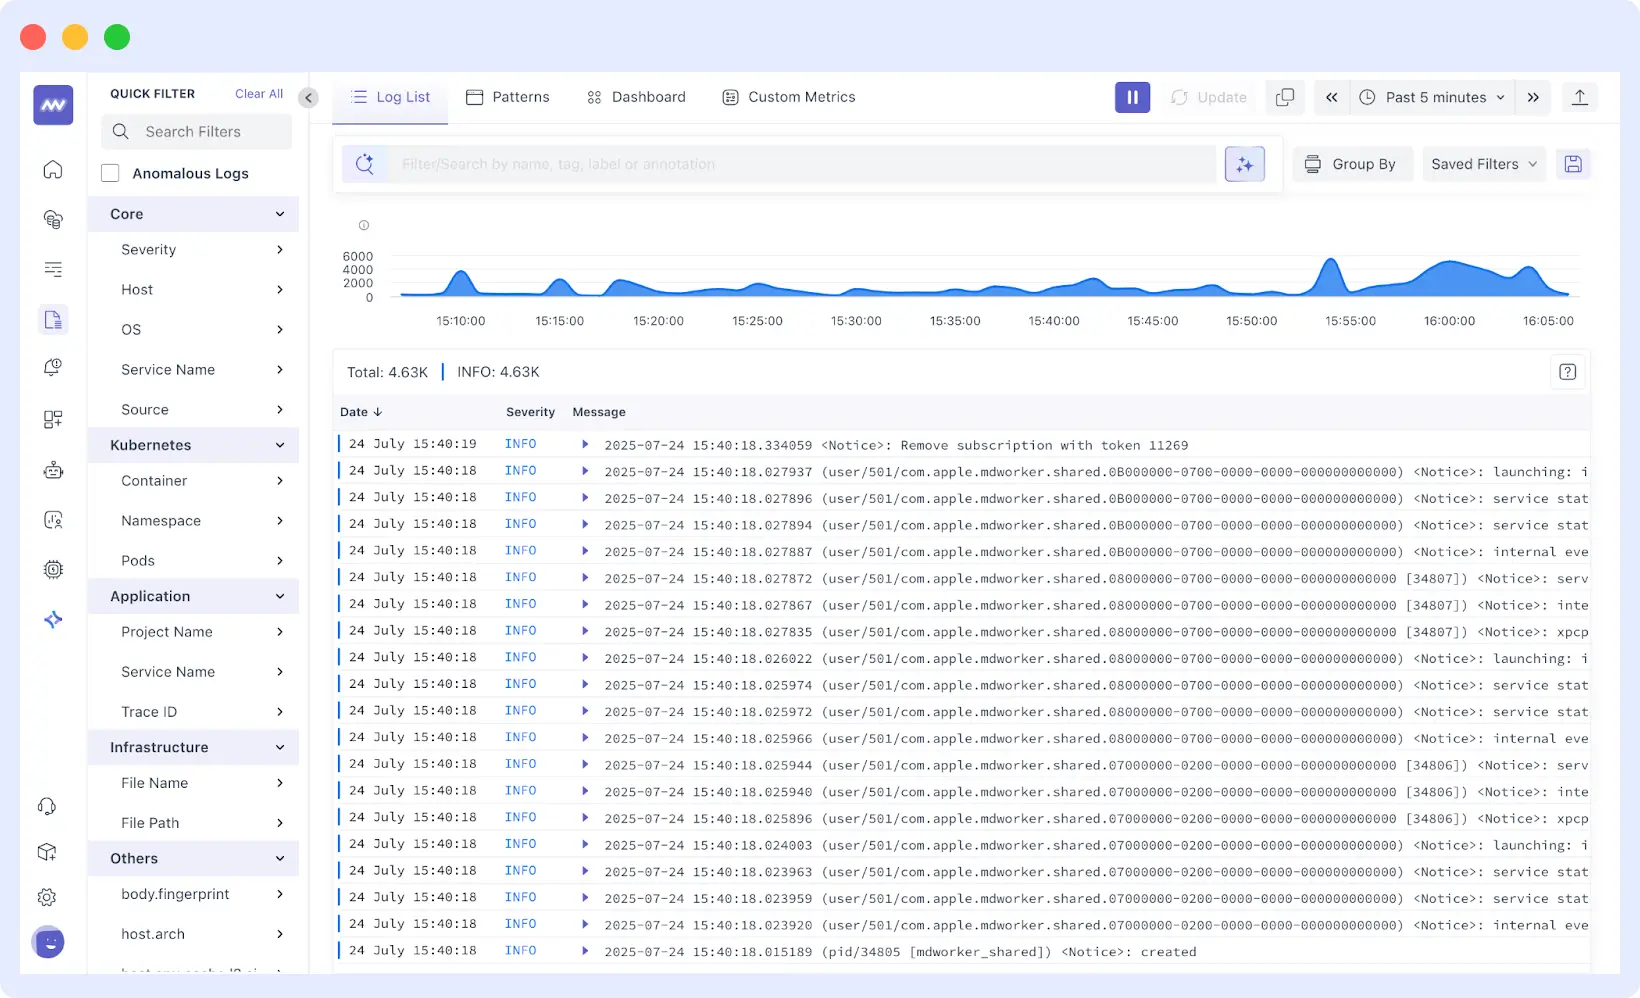
The platform unifies log monitoring, APM, infrastructure monitoring, Real User Monitoring (RUM), and synthetic monitoring into a single interface with a single agent and a single bill. Its Log Pipeline lets teams control ingestion costs before data reaches storage. The platform’s headline feature in 2026 is OpsAI, an AI-native SRE agent that auto-resolves more than 80% of production issues in customer environments.
Key features
- Centralized log collection from infrastructure, containers, Kubernetes pods, and application layers
- Real-time log tailing with fast full-text and structured search, regex and fuzzy matching
- AI-powered log anomaly detection and log pattern grouping, no manual threshold configuration required
- Deep Kubernetes support: pod, namespace, node, and label enrichment out of the box
- One-click correlation from a log event to the related trace, infrastructure metric, or user session
- Log Pipeline: filter, sample, and route logs before storage to control ingestion costs
- OpsAI: automated root-cause analysis across backend, frontend, and Kubernetes signals simultaneously
- Pull-request generation via GitHub MCP integration, zero source code retention
- Kubernetes Auto Fix: OpsAI can propose fixes via Auto RCA mode or apply them directly via Auto Fix mode for pod crashes, OOMKill events, and HPA misconfigurations
- Third-party alert ingestion from Datadog, Grafana, and PagerDuty, no forced migration required
- Role-based access controls, SSO, sensitive data masking, and custom log attribute extraction
- SOC 2 Type II, ISO 27001, HIPAA, and GDPR certified
Pros
- OpenTelemetry-native architecture, zero vendor lock-in at the collection layer
- Unified telemetry eliminates the tool-switching that slows incident resolution
- OpsAI closes the full loop from detection to root cause to Kubernetes fix or GitHub PR, not just smarter alerting
- Usage-based pricing at $0.30/GB is up to 5x lower than comparable platforms
- Single-script installation; standard environments running in under 30 minutes
- No per-host fees, no per-user fees, no plan-tier gating of features
- Free trial with unlimited data ingestion, no credit card required
Cons
- Younger platform than Datadog or Splunk, integration ecosystem is growing fast but not yet as broad
- No native SIEM capabilities; security-heavy teams with SIEM requirements will need a dedicated tool
Best for
DevOps and SRE teams running Kubernetes-heavy environments who need to correlate logs with traces and metrics instantly. Teams being priced out of Datadog or New Relic. Organizations that want genuine AI remediation, not just AI-powered summaries, to reduce on-call burden and MTTR.
Pricing
| Plan | Cost | Key inclusions |
|---|---|---|
| Free Trial | $0 for 14 days | Unlimited data ingestion, unlimited RUM sessions, unlimited synthetic checks, 10 browser test runs, unlimited users, 14-day retention |
| Usage-based | $0.30/GB (metrics, logs, traces) | OpsAI error detection, $1 per 1K RUM sessions, $1 per 5K synthetic checks, $10 per 1K browser test runs, ingestion control and data pipeline, 30-day default retention, SSO, dedicated Slack/MS Teams channel |
| Enterprise | Custom | Dedicated account team, multi-year discounts, custom data retention, Bring Your Own Cloud, 24×7 support |
OpsAI error detection is free. Root cause analysis and automated fixes are charged based on token usage. There are no per-host or per-user fees at any tier. View full pricing and use the calculator
OpenTelemetry support
Native. OTel is the architectural foundation of Middleware’s collection layer, not an integration bolted on afterward. The platform also supports Prometheus, databases, and other data origins beyond OTel.
Kubernetes support
Deep. Native pod, namespace, node, and label enrichment. OpsAI’s Kubernetes Auto Fix detects and remediates OOMKill events, pod crashes, memory leaks, and HPA misconfigurations, the most actionable Kubernetes log integration currently available in the market. See: Kubernetes monitoring with Middleware
AI capabilities
- OpsAI SRE agent: multi-signal automated root-cause analysis across traces, logs, metrics, and RUM, tracing issues to the exact line of code
- Pull-request generation via GitHub MCP with zero source code retention
- Kubernetes Auto Fix, propose or directly apply remediation
- Alert tuning recommendations backed by historical baseline data
- AI-powered log anomaly detection and log pattern grouping
- Query Genie: AI-assisted log query generation
Deployment
SaaS (primary). Bring Your Own Cloud option available on enterprise contracts.
Verdict
Middleware is the most compelling log management platform for cloud-native teams making a 3-to-5-year decision. Its OTel-native architecture eliminates vendor lock-in. Its pricing is genuinely transparent and predictable. OpsAI is the first AI remediation tool in the observability market that closes the full loop from detection to merged code fix, not just a smarter alert. The tradeoff is platform maturity relative to Datadog or Splunk, but for teams not requiring a full SIEM stack, the capabilities are solid and the value case is clear.
Start your 14-day free trial, unlimited ingestion, no credit card required
2. Datadog
Datadog is the incumbent observability market leader. Its log management product is mature, deeply integrated with the broader Datadog ecosystem (metrics, APM, synthetic monitoring, SIEM, and network monitoring), and backed by more than 1000 integrations. The Log Explorer is powerful, and log-to-APM trace correlation within the same platform is a genuine workflow improvement over disconnected tools.
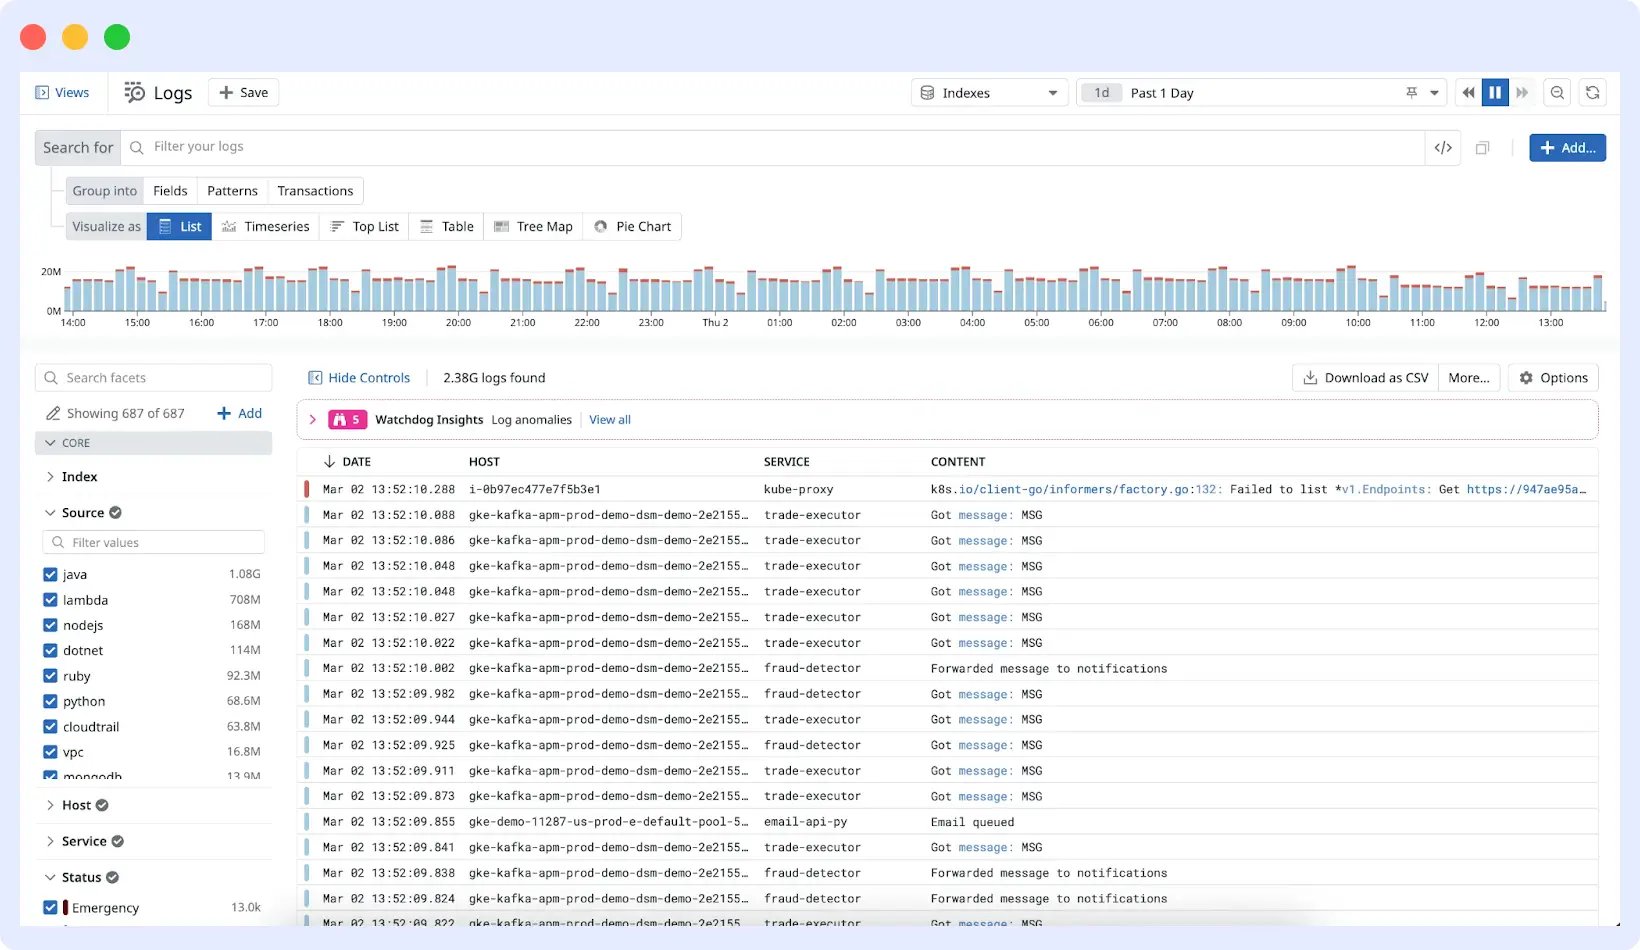
The caveat that engineering teams discover too late is that Datadog’s pricing model prices log management, infrastructure, APM, RUM, and security monitoring separately, and costs compound in ways that are difficult to forecast until the invoice arrives.
Key features
- 1000+ integrations for log collection and parsing pipelines
- Seamless log-to-trace correlation within the platform
- Powerful log processing pipelines for normalization and enrichment
- Built-in Cloud SIEM (Datadog Cloud SIEM)
- Watchdog AI for anomaly detection and ML-based pattern surfacing
- Extensive dashboarding, visualization, and alerting
Pros
- Largest integration library in the market
- Feature depth across every observability domain
- Log-to-APM trace correlation is seamless
- Strong enterprise support tiers and SLAs
Cons
- Pricing is notoriously complex, log management, APM, infrastructure, SIEM, and RUM are each billed separately
- Log indexing at $1.70/GB creates strong incentives to sample or drop logs to manage costs, the opposite of good observability practice
- High-watermark billing means short traffic spikes can cause step-ups in your monthly invoice
- Significant vendor lock-in: proprietary agent, proprietary data format, and proprietary query language
Datadog getting expensive? See how Middleware compares on cost and capabilities: Middleware vs. Datadog
Best for
Enterprise organizations that have a dedicated FinOps function, require the broadest integration library in the market, and need SIEM integrated into their observability platform alongside APM and infrastructure monitoring.
Pricing
| Component | Cost |
|---|---|
| Log ingestion | $0.10/GB |
| Log indexing (15-day retention) | $1.70/GB |
| APM | From $31/host/month (billed separately) |
| Infrastructure monitoring | From $15/host/month (billed separately) |
| Enterprise | Custom annual contracts |
OpenTelemetry support
Partial. Datadog accepts OTel data but normalizes it into its proprietary format, data is no longer portable once it enters the Datadog pipeline.
Kubernetes support
Strong. The Datadog Agent handles Kubernetes log collection, pod metadata enrichment, and namespace correlation well across multi-cluster environments.
AI capabilities
Watchdog (anomaly detection and automated surface-up alerts), Bits AI (conversational assistant), and AI Ops add-on features. Most advanced AI capabilities are separate SKUs.
Deployment
SaaS only.
Verdict
Datadog is the right choice if you need the most comprehensive integration library and have a FinOps team to manage the bill. For teams feeling the pressure of per-host plus per-GB plus per-component billing, the cost trajectory and vendor lock-in make Datadog a difficult 3-to-5-year commitment, especially as log volumes grow with your infrastructure.
3. Dynatrace
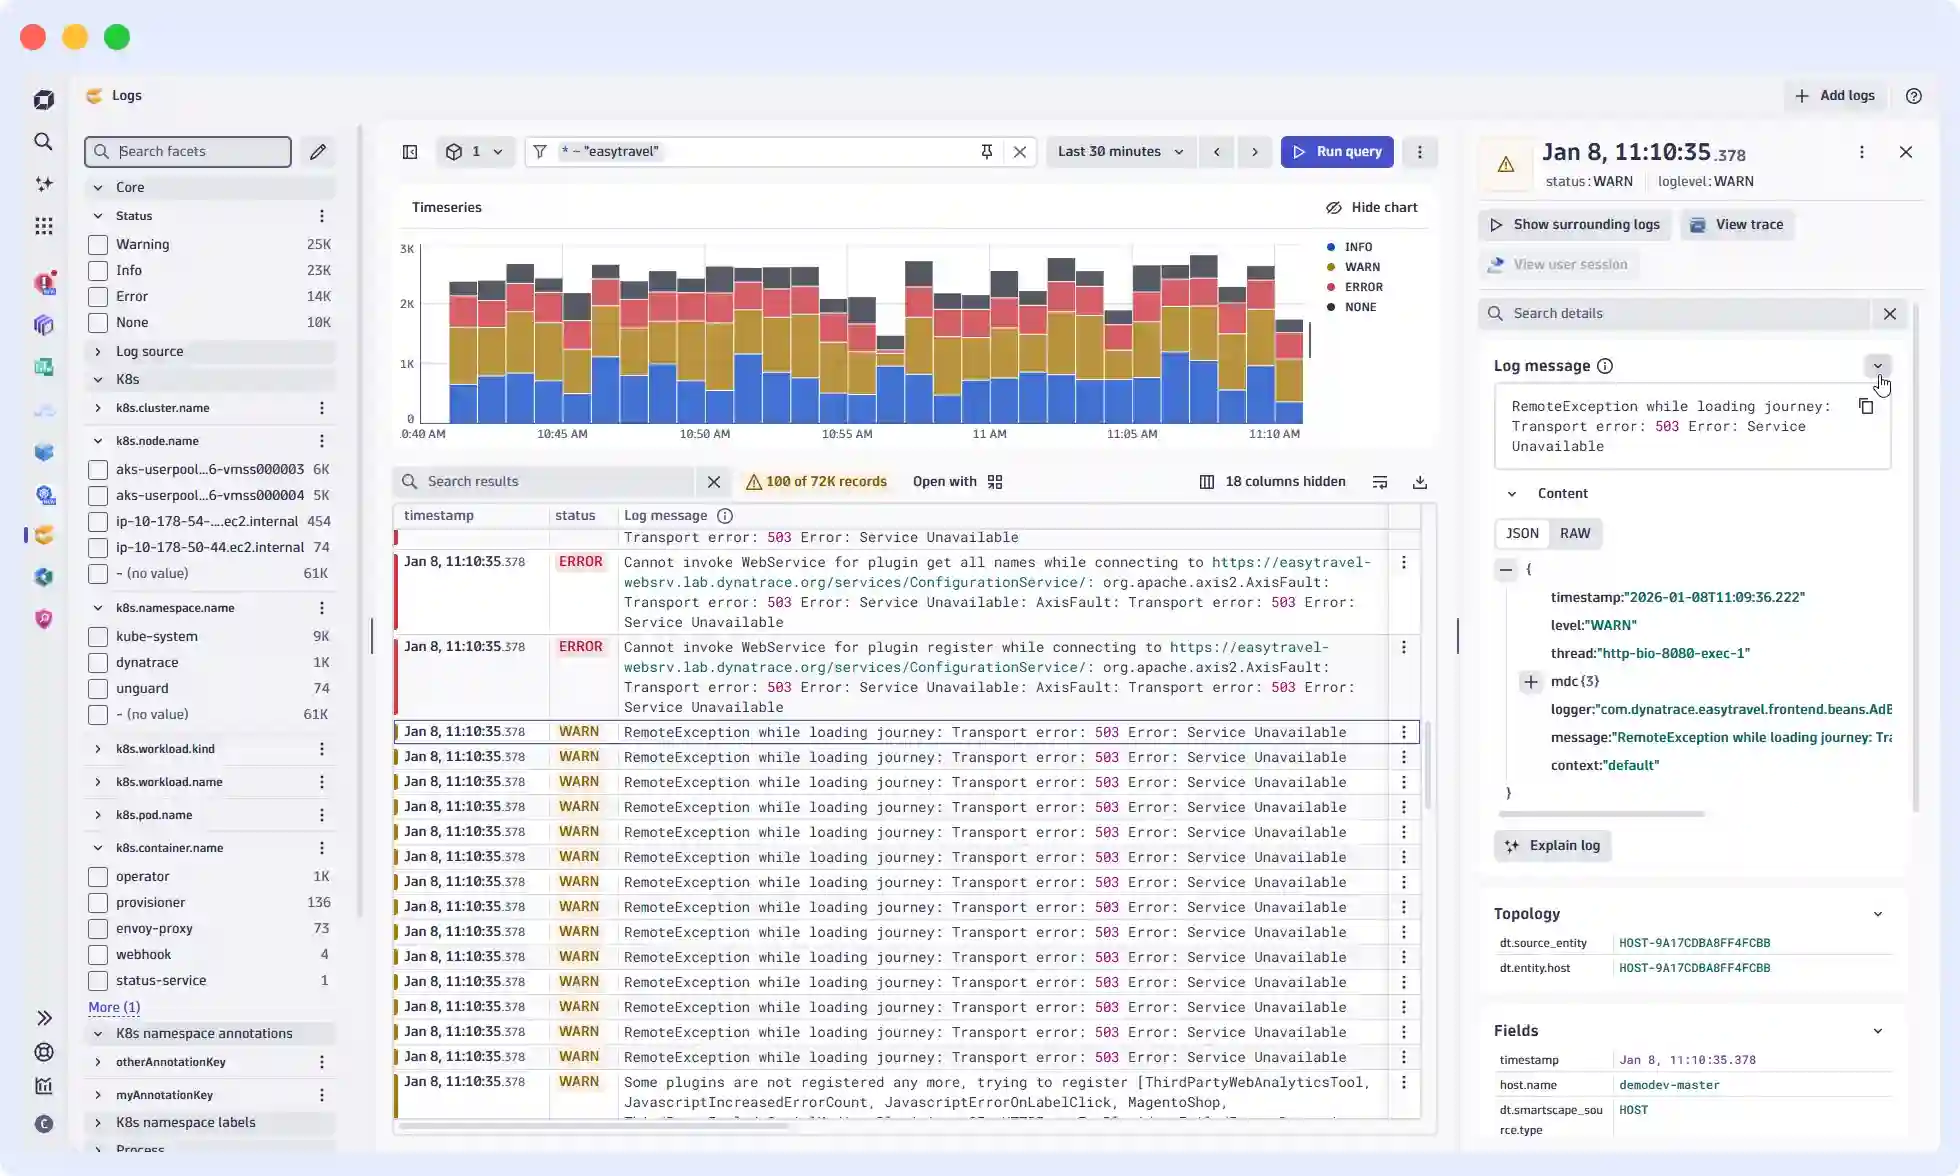
Dynatrace is the enterprise observability platform most associated with AI-powered automation. Its Davis AI engine automatically discovers, maps, and monitors every component of your stack, and when something fails, it traces root cause through the full dependency chain, presenting a single causal event rather than hundreds of correlated alerts. For organizations running thousands of microservices across AWS, Azure, GCP, and on-premise simultaneously, this automation has real operational value.
Key features
- Davis AI: dependency-chain root-cause analysis across services, infrastructure, and logs simultaneously
- OneAgent: single agent instruments the full stack without per-service configuration
- Grail data lakehouse for high-cardinality log storage and fast analytical queries
- DQL (Dynatrace Query Language) for unified log, metric, and trace querying
- Native support for AWS, Azure, GCP, Kubernetes, and Red Hat OpenShift
- Auto-discovery adapts as your environment scales
Pros
- Strongest automated root-cause analysis in the enterprise observability market
- OneAgent eliminates the per-service instrumentation overhead common in other platforms
- Best fit for massive, complex hybrid cloud environments
Cons
- DQL is proprietary, query expertise doesn’t transfer outside the Dynatrace ecosystem
- Three-component pricing (ingestion, retention, and querying) is difficult to model and manage at scale
- High cost; positioned for Fortune 500 budgets, not startup or mid-market teams
- Steep learning curve for teams new to the platform
Evaluating Dynatrace alternatives? See: Middleware vs. Dynatrace
Best for
Fortune 500 enterprises managing massive, interdependent hybrid cloud environments where automated discovery and AI-driven dependency mapping justify the premium. Not the right fit for teams that prioritize open standards, cost transparency, or portability.
Pricing
| Component | Cost |
|---|---|
| Log ingestion | $0.20/GiB |
| Log retention | $0.0007/GiB per day |
| Log querying | $0.0035/GiB |
| Full platform | Custom enterprise contract |
OpenTelemetry support
Partial. Dynatrace accepts OTel data but uses its own proprietary Grail data model and DQL query language internally.
Kubernetes support
Strong. Kubernetes-native monitoring with auto-discovery of pods, namespaces, and services. Deep integration with Red Hat OpenShift.
AI capabilities
Davis AI (automated root-cause analysis, anomaly detection, dependency mapping), Davis CoPilot (natural language query assistant), Davis predictive AI (capacity forecasting).
Deployment
SaaS (Dynatrace SaaS), self-managed (Dynatrace Managed, customer-hosted), and hybrid.
Verdict
Dynatrace is built for organizations where automated root-cause analysis is the primary requirement and budget is not the primary constraint. For cloud-native teams that prioritize open standards, cost transparency, and the ability to switch backends without re-instrumenting, the proprietary DQL lock-in and complex pricing model are significant long-term risks.
4. New Relic
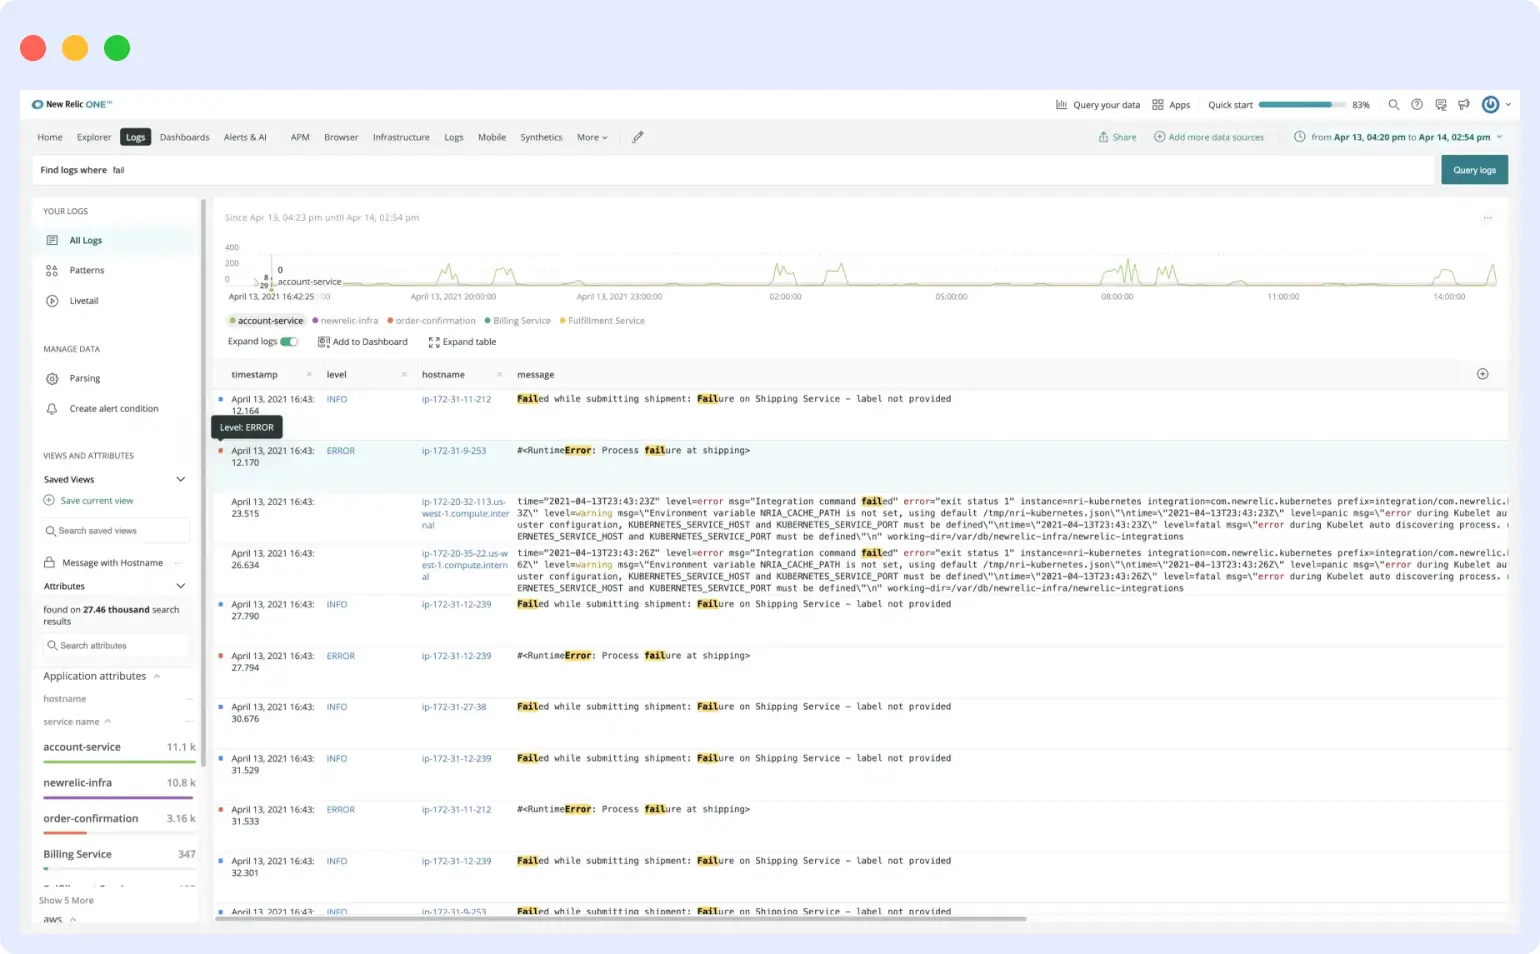
New Relic’s heritage is Application Performance Monitoring, and its log management reflects that orientation: logs are most valuable when they’re connected to traces, errors, and infrastructure events in the same view. The Telemetry Data Platform pipes all signals into one data store, queryable via NRQL (New Relic Query Language), a SQL-like interface that most engineers can learn in a day.
Key features
- Unified data model across logs, metrics, traces, and events in one data store
- NRQL: SQL-like query language that’s accessible for non-specialist engineers
- Strong live-tail functionality for real-time debugging
- Log Patterns: automatic grouping of similar log entries to reduce noise
- 100 GB/month free data ingestion, one of the most generous free tiers in the market
- NRAI: AI-powered assistant for natural language queries and investigation
Pros
- Generous free tier makes evaluation low-risk for most teams
- NRQL is approachable for engineers without deep observability backgrounds
- Strong APM-to-log correlation workflow
- Broad ecosystem of integrations and OpenTelemetry OTLP endpoint support
Cons
- Per-user pricing creates access barriers, teams end up with a few gatekeepers and many engineers locked out of the platform
- NRQL is proprietary and skills don’t transfer to other observability platforms
- Best experience still requires the New Relic agent, not pure OTel
- Costs can escalate significantly beyond the free tier for growing teams with many full-platform users
Looking for a New Relic alternative? See: Middleware vs. New Relic
Best for
Mid-to-large teams that are APM-centric and want logs, traces, and infrastructure in one platform with a relatively accessible query language. Organizations that want a low-risk evaluation path via the 100 GB/month free tier.
Pricing
| Plan | Cost |
|---|---|
| Free tier | 100 GB/month; 1 full-platform user |
| Data ingestion (after free) | $0.35/GB (Standard); $0.60/GB (Data Plus) |
| Standard user | $10/first full-platform user; $99/additional (up to 5) |
| Pro | $349/full-platform user/year; unlimited users |
| Enterprise | Custom pricing |
OpenTelemetry support
Partial. New Relic accepts OTel data through its OTLP endpoint, but the best-experience path still assumes the New Relic proprietary agent.
Kubernetes support
Moderate. The New Relic Kubernetes integration provides pod, namespace, and node metrics. Log collection requires additional configuration via Fluent Bit integration.
AI capabilities
NRAI (AI assistant for natural language queries and investigation), Lookout (proactive anomaly surfacing), and ML-based anomaly detection across metrics and logs.
Deployment
SaaS only (multi-cloud hosted).
Verdict
New Relic is a solid, established choice for teams coming from an APM-first world who want their logs in the same platform. The per-user pricing model is the biggest structural concern, it creates incentives against the broad platform access that makes observability culture valuable. For teams that can manage within those boundaries, it’s a capable and well-documented platform.
5. Splunk
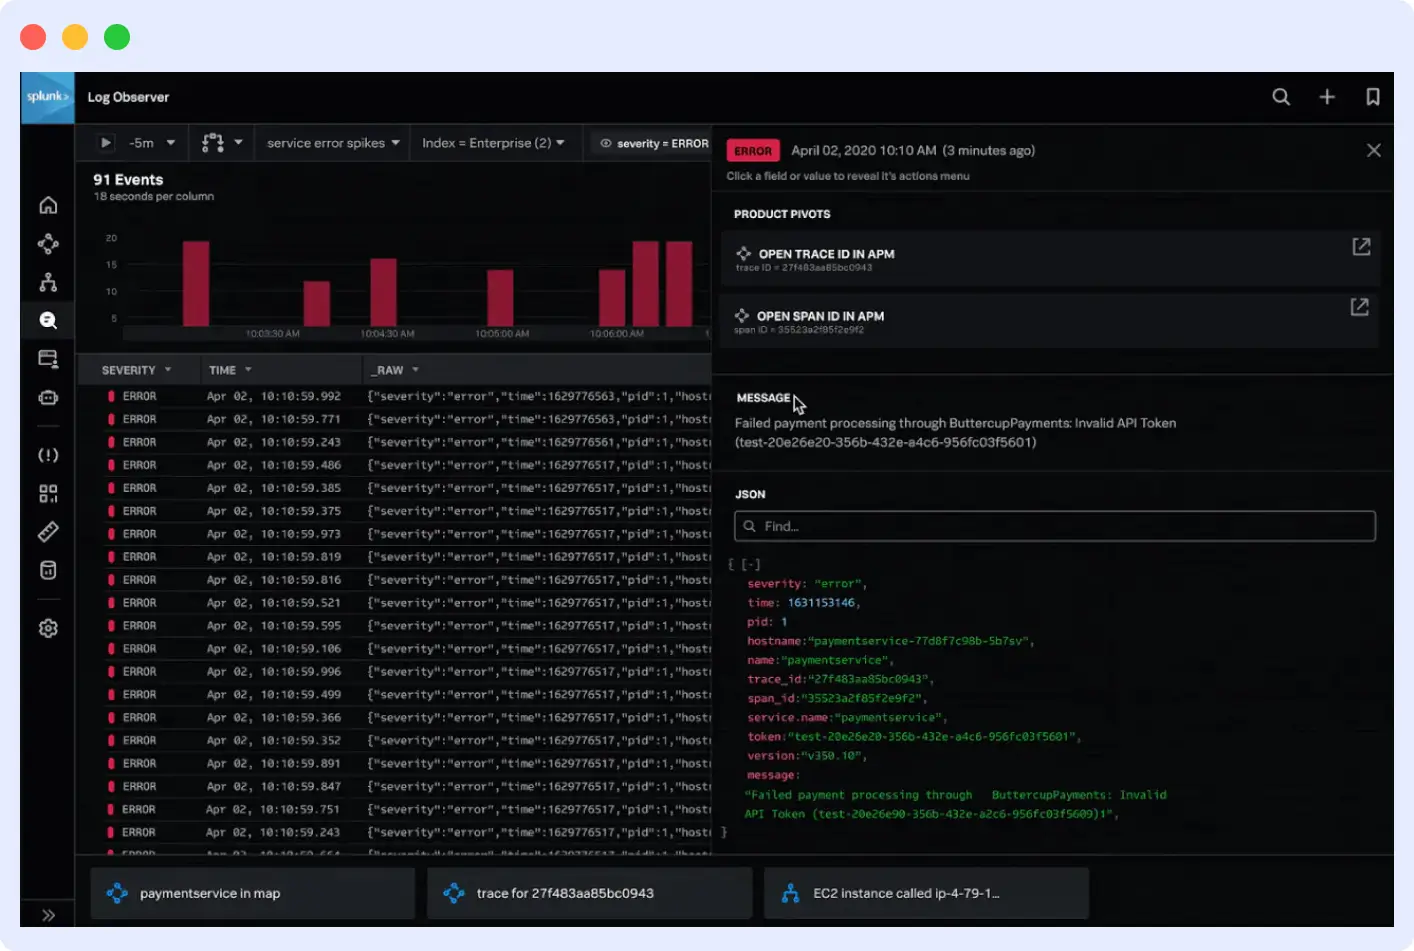
Splunk built its category on the premise that machine data (logs, events, metrics) is an underutilized asset. Its Search Processing Language (SPL) is genuinely among the most powerful query interfaces ever built for log analysis, and its SIEM capabilities have made it the default choice in security operations for over a decade. The challenge in 2026 is that Splunk’s volume-based pricing model, designed for on-premise data centers, creates serious cost pressure in cloud-native environments where log volumes scale dynamically with traffic.
Key features
- SPL: extremely capable for complex log analysis, correlation, and statistical operations
- Industry-leading SIEM and security analytics
- Handles unstructured, multi-line, and complex log formats exceptionally well
- Large ecosystem of apps, add-ons, and integrations built over a decade
- Enterprise-grade compliance, audit trails, and data governance
- Available as SaaS (Splunk Cloud) and self-hosted (Splunk Enterprise)
Pros
- Unmatched search and analytical power for complex log correlation
- Best-in-class for security operations and SIEM use cases
- Handles compliance and forensic audit requirements well
- Mature platform with extensive production hardening
Cons
- Volume-based pricing becomes prohibitively expensive at cloud-native log scales
- SPL is a significant learning investment, skills don’t transfer outside Splunk
- Metrics and tracing capabilities feel bolted on rather than natively integrated
- High operational overhead for self-hosted deployments
Best for
Security Operations Centers (SOCs), regulated industries (finance, healthcare, government), and large enterprises where log data serves compliance and forensic purposes as much as operational debugging.
Pricing
| Option | Cost |
|---|---|
| Free tier | 500 MB/day |
| Splunk Cloud | ~$225/month for 100 GB/day |
| Enterprise | Custom annual contracts (often $200K to $1M+/year at scale) |
OpenTelemetry support
Limited. Splunk supports OTel through the Splunk Distribution of the OpenTelemetry Collector, but the core platform predates OTel and is not natively aligned with its data model.
Kubernetes support
Moderate. Splunk Connect for Kubernetes collects logs and metrics from Kubernetes clusters but requires meaningful configuration to match purpose-built cloud-native platforms.
AI capabilities
ML Toolkit (anomaly detection and forecasting), ITSI (AI-driven service monitoring), and SPL AI Assistant for query generation.
Deployment
SaaS (Splunk Cloud), self-hosted (Splunk Enterprise), and hybrid.
Verdict
For security and compliance-driven log analysis, Splunk remains the industry benchmark. For operational debugging and observability in cloud-native DevOps environments, its cost model and lack of unified telemetry make it increasingly hard to justify against modern alternatives.
6. Grafana Loki
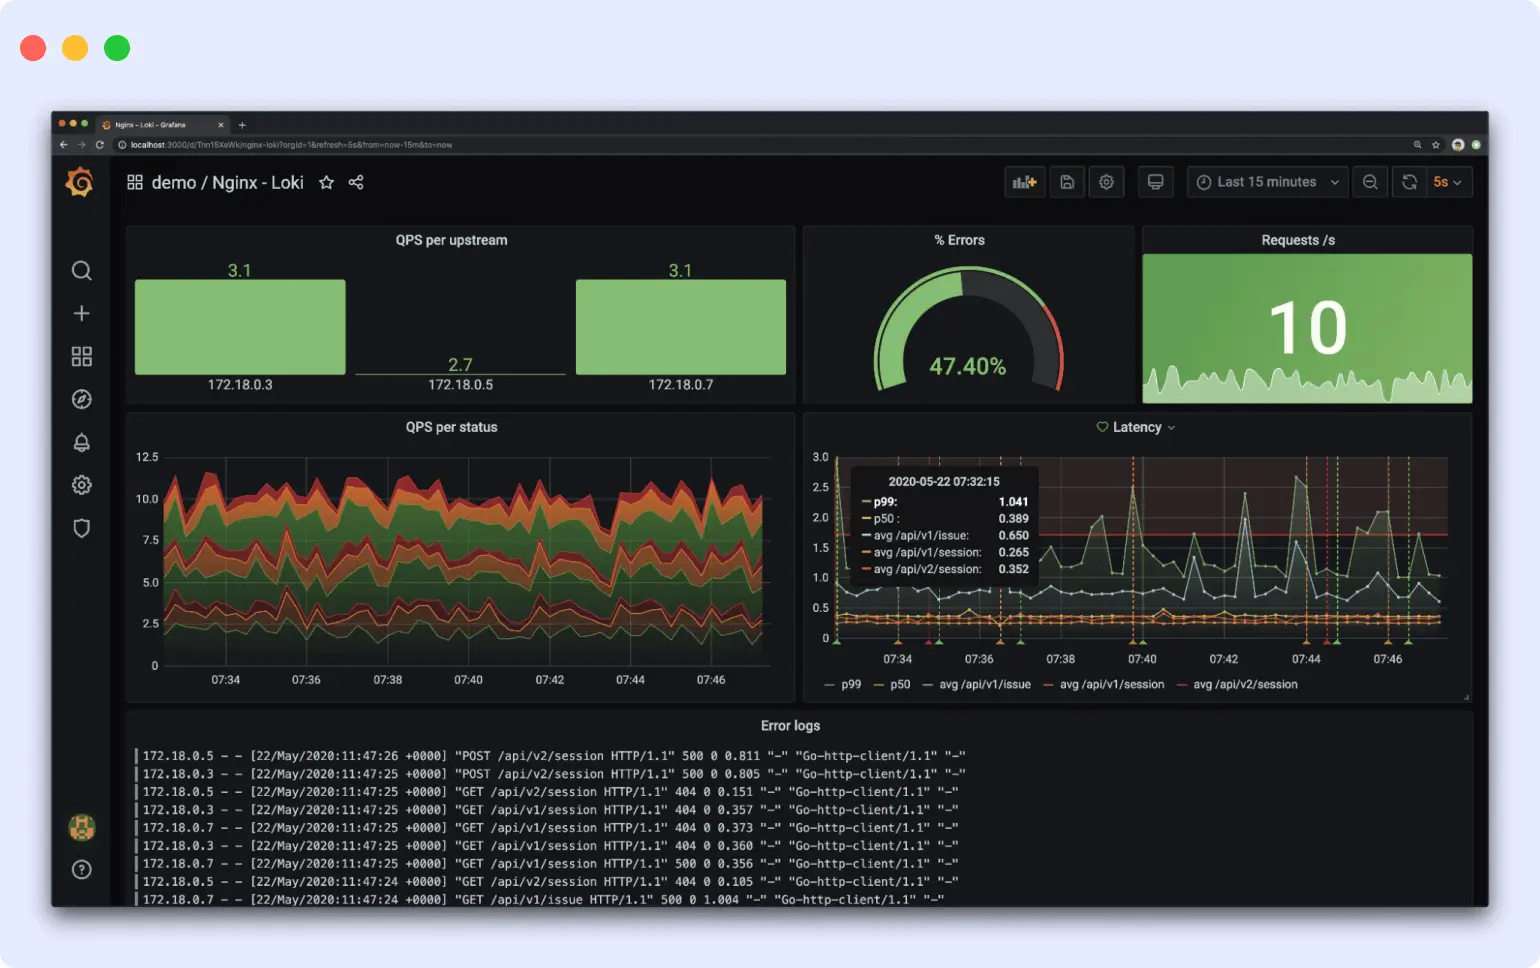
Grafana Loki takes a fundamentally different approach to log storage: it indexes only the metadata labels for each log stream, not the full log content. Log data is stored as compressed chunks in object storage (S3, GCS, Azure Blob). This makes Loki dramatically cheaper to operate at scale compared to full-index solutions like Elasticsearch, but it also means full-text search across log content is slower and more compute-intensive at query time, particularly without well-defined label discipline.
Key features
- Label-only indexing significantly reduces storage costs vs. Elasticsearch or Datadog
- LogQL: concise query language that aligns with PromQL patterns for Prometheus-native teams
- Native Grafana integration for unified log, metric, and trace dashboards
- First-class Kubernetes support via Promtail and Grafana Alloy agents with pod metadata enrichment
- Open-source (Apache 2.0) with self-hosted and Grafana Cloud managed options
- Scales to petabytes when combined with object storage backends
Pros
- Lowest per-GB storage cost of any option in this list when self-hosted
- Familiar LogQL for engineers already using PromQL
- Zero vendor lock-in, fully open-source
- Strong integration with Grafana Tempo (traces) and Grafana Mimir (metrics) for a full self-hosted observability stack
Cons
- Full-text search across large log volumes degrades quickly without careful label cardinality management
- Operating Loki at scale is complex, a distributed system with multiple microservice components requiring real infrastructure expertise
- Label cardinality mismanagement causes serious performance problems
- No built-in AI capabilities beyond Grafana’s experimental ML plugins
Best for
Platform engineering teams already running Prometheus and Grafana who have the operational maturity to run a distributed system. Teams where minimizing direct software cost is the primary priority and engineering time is available to absorb the operational overhead.
Pricing
| Option | Cost |
|---|---|
| Open-source (self-hosted) | Free |
| Grafana Cloud free tier | 50 GB logs/month included |
| Grafana Cloud paid | From $0.50/GB ingested |
OpenTelemetry support
Native. Loki accepts OTLP-formatted logs directly.
Kubernetes support
Strong. Promtail and Grafana Alloy provide first-class Kubernetes log collection with pod metadata label enrichment.
AI capabilities
Limited. Grafana has experimental ML-powered anomaly detection plugins, but Loki itself is not AI-native.
Deployment
Self-hosted (primary), Grafana Cloud (managed SaaS).
Verdict
Grafana Loki is the right choice for teams with the operational maturity to run a distributed system and the Prometheus/Grafana stack already in production. It is not the right starting point for teams new to observability, teams that need AI-driven analysis out of the box, or organizations where engineering time for infrastructure operations is scarce.
7. Elastic (ELK Stack)
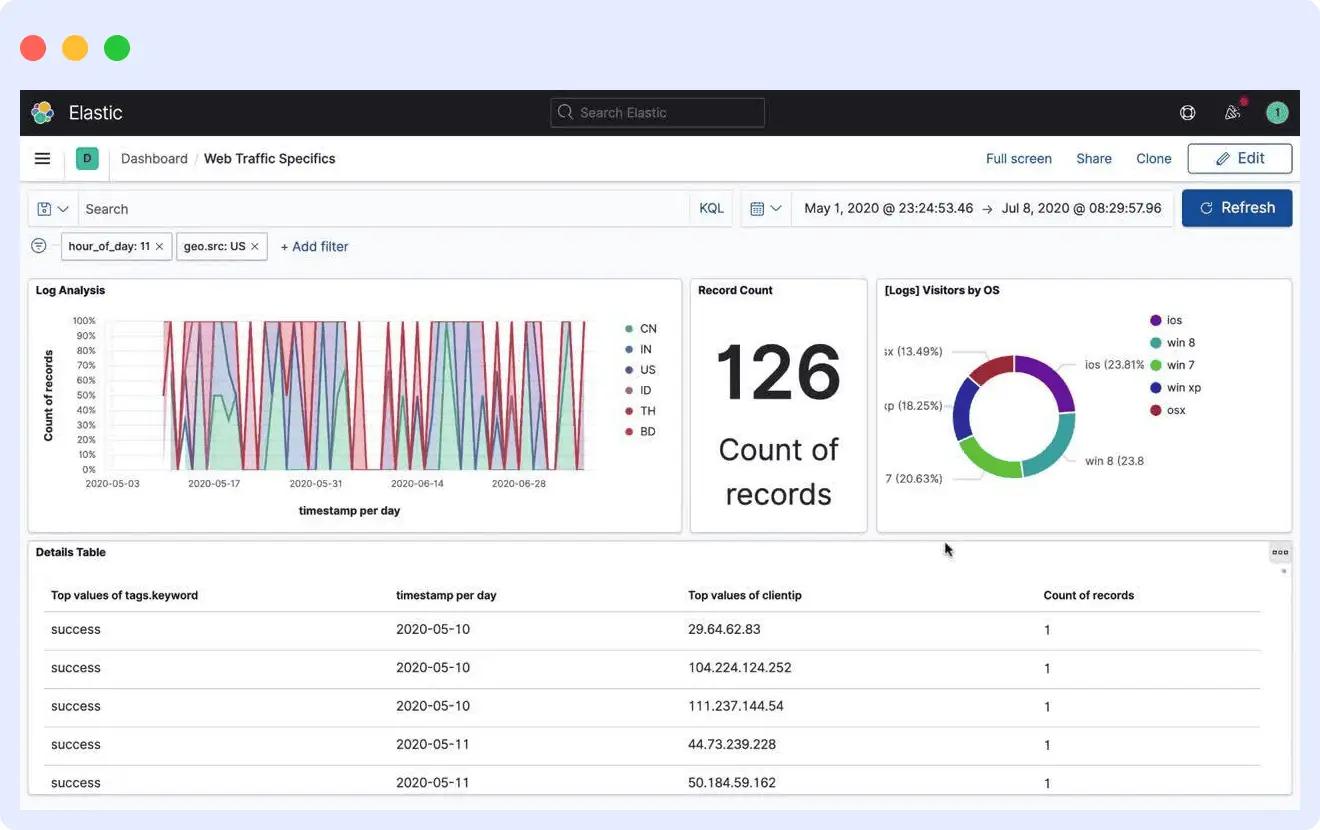
The Elastic Stack (Elasticsearch, Logstash, Kibana, and the Beats family of lightweight agents) has been the backbone of self-managed log infrastructure for over a decade. Elasticsearch’s full-text search is fast and well-understood. Kibana provides rich visualization. And Filebeat is battle-tested across millions of production deployments. The key tradeoff is operational complexity: running Elasticsearch at scale requires dedicated infrastructure expertise.
Key features
- Elasticsearch: industry-leading full-text and structured search engine
- Kibana: rich dashboarding, Discover for log exploration, Lens for visualization
- Beats agents (Filebeat, Metricbeat, Auditbeat): lightweight and widely deployed
- Logstash: powerful log transformation and routing pipeline
- Highly customizable, adaptable to virtually any logging architecture
- ML anomaly detection available at Platinum/Enterprise tier
Pros
- Best-in-class full-text search performance
- Highly configurable for custom logging and data architectures
- Large community, extensive documentation, and ecosystem
- Open-source core (Elastic License 2.0 and AGPL)
Cons
- Operating Elasticsearch at scale requires real expertise: shard sizing, index lifecycle management, cluster tuning
- Elastic Cloud costs can be high once compute, storage, and data tiers are added
- Licensing change to Elastic License 2.0 in 2021 created community fragmentation (OpenSearch fork emerged)
- Limited AI capabilities without a Platinum or Enterprise subscription
Best for
Engineering-heavy teams who need complete control over their stack and have the headcount to run distributed infrastructure. Organizations building custom internal search and analytics platforms on top of log data.
Pricing
| Option | Cost |
|---|---|
| Open-source (self-hosted) | Free |
| Elastic Cloud | From ~$95/month; scales with storage and compute |
| Enterprise features (ML, advanced security) | Higher-tier subscriptions required |
OpenTelemetry support
Partial. Elasticsearch supports OTLP ingest through the Elastic Distribution for OpenTelemetry (EDOT). Full-fidelity OTel support is improving but is not yet native-first.
Kubernetes support
Moderate. ECK (Elastic Cloud on Kubernetes) enables Kubernetes-native deployment. Filebeat handles Kubernetes log collection with metadata enrichment.
AI capabilities
ML-based anomaly detection and forecasting (Platinum+ tier). Elastic AI Assistant for natural language query generation (technical preview in current releases).
Deployment
Self-hosted, Elastic Cloud (SaaS), and hybrid.
Verdict
The ELK Stack is the right choice for teams building custom search infrastructure with full control requirements. For most cloud-native teams evaluating a log management platform for operational observability, the operational overhead of Elasticsearch at scale makes fully managed alternatives more cost-effective when total engineering time is factored in honestly.
8. SigNoz
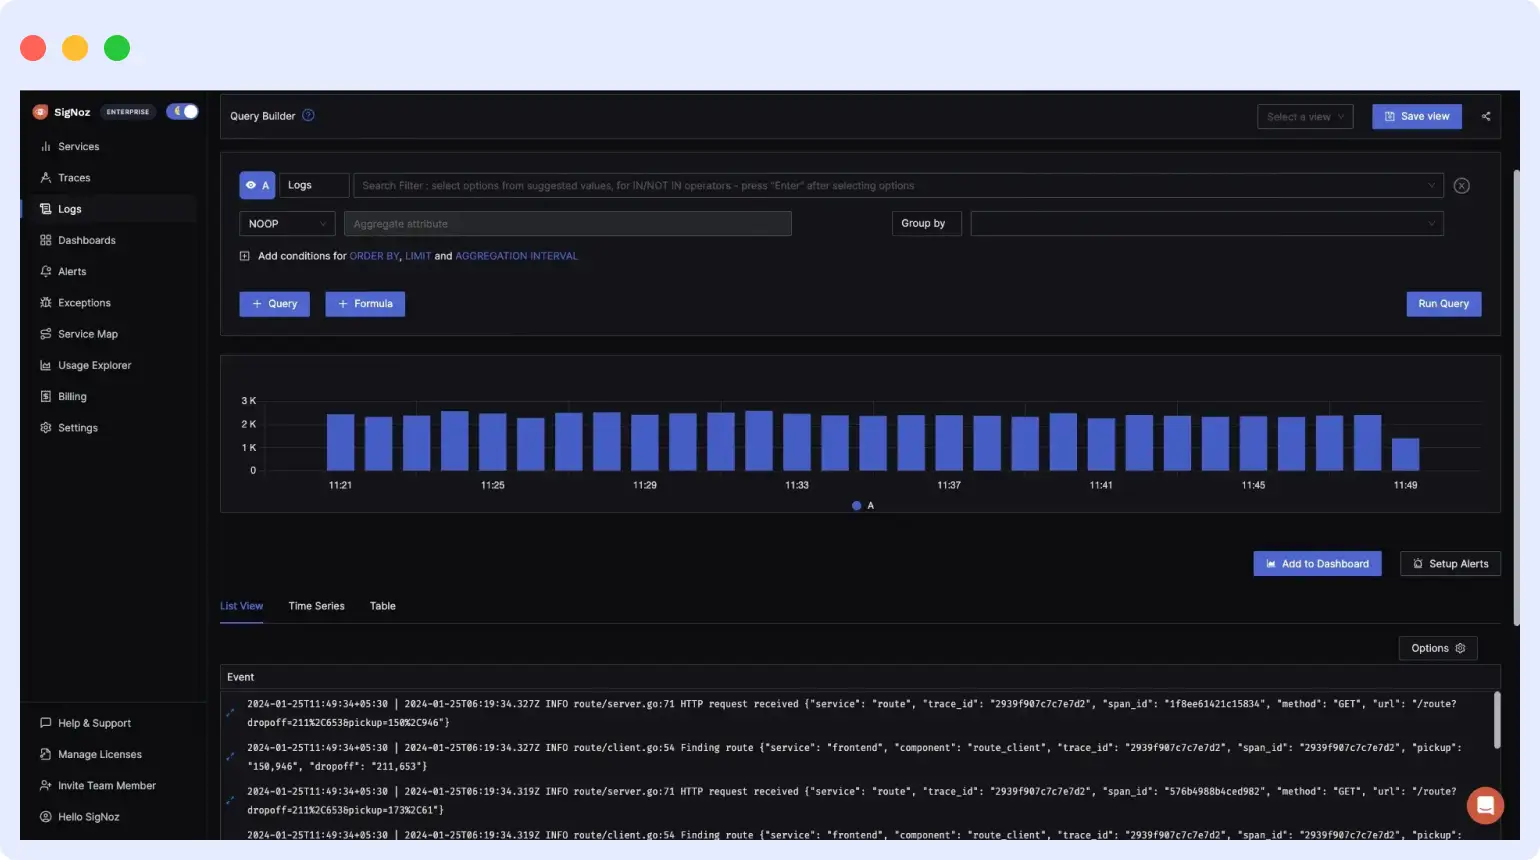
SigNoz is an open-source, all-in-one observability platform built from the ground up on OpenTelemetry and ClickHouse. It provides logs, metrics, and traces in a single application, a direct architecture competitor to Datadog and New Relic, without vendor lock-in or proprietary agents. It’s one of the most actively developed open-source observability projects in the CNCF ecosystem in 2026.
Key features
- Full OpenTelemetry-native architecture: no proprietary agents, no proprietary data formats
- ClickHouse backend delivers fast analytical query performance on log data
- Unified logs, metrics, and traces in one application
- Self-hostable on Kubernetes or VMs; SigNoz Cloud managed option available
- Open-source under Apache 2.0 license
- Active CNCF community with regular releases
Pros
- True OTel-native: no vendor lock-in at any layer of the stack
- ClickHouse enables fast queries on high-cardinality log data
- Unified signals without stitching together multiple tools
- Transparent open-source codebase
Cons
- Self-hosted deployments carry significant operational overhead
- Still maturing compared to established commercial platforms, some enterprise features are in active development
- Smaller integration ecosystem than commercial alternatives
- AI capabilities limited relative to purpose-built AI observability platforms
Best for
Engineering-forward teams that want OTel-native observability without commercial lock-in and have the operational capacity to manage self-hosted infrastructure. Organizations with data sovereignty requirements that prevent SaaS adoption.
Pricing
| Option | Cost |
|---|---|
| Open-source (self-hosted) | Free |
| SigNoz Cloud | From $199/month (managed) |
OpenTelemetry support
Native. SigNoz is one of the purest OTel-native platforms in the 2026 market.
Kubernetes support
Moderate. Kubernetes-native deployment via Helm charts. Log collection via OpenTelemetry Collector with Kubernetes metadata enrichment.
AI capabilities
Basic anomaly detection. Advanced AI features are on the roadmap but not yet at the maturity level of commercial AI observability platforms.
Deployment
Self-hosted (primary), SigNoz Cloud (managed SaaS).
Verdict
SigNoz is the best self-hosted, open-source choice for OTel-native observability in 2026. If you want the architectural benefits of OpenTelemetry without any commercial dependency and have the engineering capacity to operate it reliably, SigNoz is the strongest option in this category. For teams that want those same OTel-native benefits without the operational overhead, Middleware’s managed platform is the more practical path.
9. Better Stack
Better Stack combines log management, uptime monitoring, incident management, and status pages into a single product with a notably polished UI. Its SQL-based query interface (ClickHouse SQL under the hood) is accessible for developers who aren’t observability specialists, and its integrated on-call scheduling closes the loop from detection to response without requiring a separate incident management tool.
Key features
- Modern, fast UI with intuitive log search and visualization
- SQL-based log query language, familiar for most developers
- Integrated uptime monitoring, alerting, and on-call scheduling
- Status page creation built into the platform
- OpenTelemetry support via OTLP endpoint
Pros
- Best UI/UX experience in this list for non-specialist users
- SQL is a lower barrier to entry than PromQL or SPL for most developers
- Incident management and status pages in one platform reduces tool sprawl for small teams
Cons
- Not an OTel-native platform, OTel is supported but not the architectural foundation
- Metrics and trace correlation is significantly less mature than unified observability platforms
- SQL is familiar but not the cloud-native standard for time-series data, PromQL has become the dominant standard
- Grows limiting quickly for teams debugging complex distributed systems
Best for
Early-stage startups and small teams that need clean logging, basic uptime monitoring, and incident management in one place without the complexity or cost of a full observability platform.
Pricing
Pay-as-you-go at $0.30/GB for logs, metrics, and traces. Bundled plan tiers also available for logs, uptime, and on-call scheduling combined.
OpenTelemetry support
Partial. OTel OTLP ingest is supported. Not an OTel-native platform.
Kubernetes support
Limited. Basic Kubernetes log collection supported; lacks the depth of purpose-built cloud-native platforms.
AI capabilities
Basic alerting intelligence. No advanced AI anomaly detection or remediation capabilities.
Deployment
SaaS only.
Verdict
Better Stack is a genuine option for startups that need a polished, easy-to-use logging and incident management tool without a steep learning curve. Teams debugging complex distributed systems at scale will find its observability depth insufficient for a long-term platform commitment.
10. Sematext
Sematext is often positioned as a pragmatic middle ground: a SaaS observability platform that provides log management, infrastructure monitoring, and synthetic monitoring together at pricing that smaller teams can actually sustain long-term. Less feature-rich than the enterprise platforms but it covers the core needs of most DevOps teams without the complexity or cost of the major players.
Key features
- Unified log, metric, and trace management in one SaaS platform
- Log parsing, alerting, and anomaly detection
- Infrastructure monitoring with agent-based collection
- Customizable alerting and notification pipelines
- Transparent, usage-based pricing model
Pros
- More transparent pricing than Datadog or New Relic for comparable features
- Reasonable feature set covering most SMB observability needs
- Unified platform reduces multi-tool sprawl
- Self-hosted option (Sematext Enterprise) for teams with data sovereignty needs
Cons
- Not built on an open-source core, vendor-specific UI and workflows create moderate lock-in
- OTel ingestion supported but data is normalized into Sematext’s internal format
- UI is less polished than market leaders
- Smaller integration ecosystem and community than top-tier platforms
Best for
SMBs and mid-market teams that need a cost-effective alternative to the expensive enterprise platforms and aren’t ready for the operational burden of self-hosted tools like Grafana Loki or Elastic.
Pricing
Logs plan starts at $50/month. Infrastructure monitoring from $3.6/host/month. Enterprise pricing available on request.
OpenTelemetry support
Partial. OTel data ingestion supported but not natively integrated at the architectural level.
Kubernetes support
Moderate. Kubernetes log collection and infrastructure metrics supported via Sematext Agent.
AI capabilities
Basic anomaly detection. No advanced AI remediation capabilities.
Deployment
SaaS (primary), Sematext Enterprise (self-hosted).
Verdict
A practical choice for cost-sensitive teams that need a unified observability platform without enterprise-tier complexity or pricing. Not the right fit for organizations prioritizing OTel-native portability, advanced AI capabilities, or deep Kubernetes automation.
11. Graylog
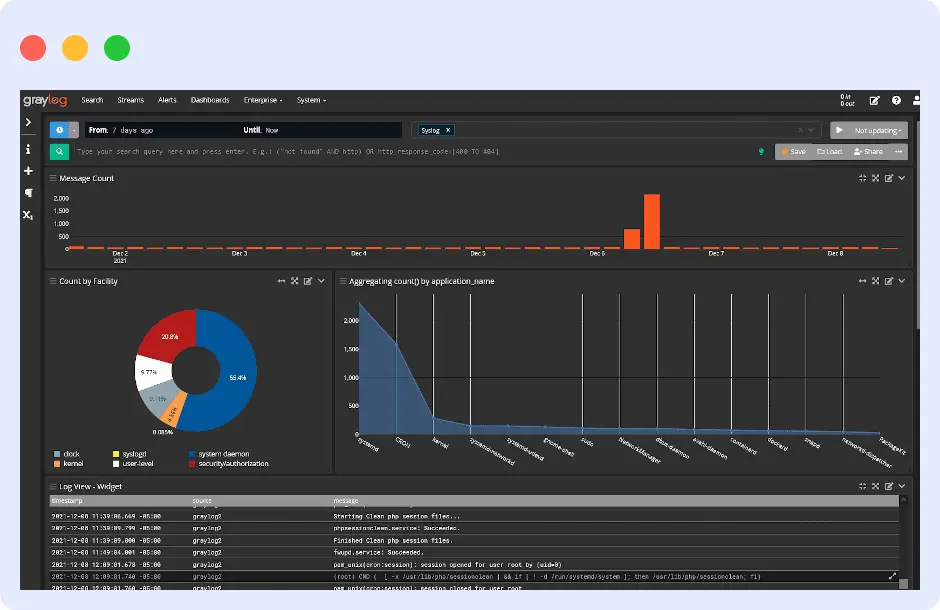
Graylog occupies a useful middle ground between the complexity of the ELK Stack and the simplicity of hosted SaaS tools. It wraps Elasticsearch or OpenSearch in a more opinionated, operator-focused interface with well-developed alerting, role-based access control, and compliance features. Its GELF (Graylog Extended Log Format) supports rich structured log data with arbitrary custom fields.
Key features
- Cleaner operator interface than raw Kibana for log management workflows
- Strong alerting, notification pipelines, and RBAC
- GELF: rich structured log format supporting arbitrary custom fields
- Compliance and audit trail features well-suited to corporate IT environments
- Open-source community with active development
- Log pipeline processing for parsing and enrichment at ingest time
Pros
- Easier to operate than a raw ELK Stack for log-centric use cases
- Strong RBAC, alerting, and compliance feature set
- Open-source core gives control over data and deployment location
Cons
- Still requires Elasticsearch/OpenSearch as a backend, the operational complexity doesn’t fully disappear
- Limited native metrics and traces integration, primarily a log management tool, not a full observability platform
- Enterprise tier pricing ($1,250/month) is high relative to capabilities versus modern alternatives
- No AI capabilities in the open-source version
Best for
Mid-size corporate IT teams that need structured log management with strong RBAC and simplified alerting on top of an OpenSearch backend, and are not yet ready to adopt a full SaaS observability platform.
Pricing
| Option | Cost |
|---|---|
| Open-source (self-hosted) | Free |
| Graylog Cloud / Enterprise | From $1,250/month |
OpenTelemetry support
Limited. OTel input support is available but not a core architectural focus for the platform.
Kubernetes support
Limited. Basic log collection from Kubernetes is possible but without the native enrichment and integration depth of purpose-built cloud-native platforms.
AI capabilities
Anomaly detection available in Enterprise tier as an add-on. No native AI remediation in any tier.
Deployment
Self-hosted (primary), Graylog Cloud (SaaS), hybrid.
Verdict
Graylog is the right choice for mid-size IT teams that want a structured, operator-focused log management interface without the raw complexity of Kibana, and are comfortable managing Elasticsearch underneath. Teams that need cross-signal observability, AI-driven analysis, or deep Kubernetes automation will find its capabilities limited.
12. SolarWinds Papertrail
Papertrail’s core value proposition is radical simplicity: a hosted log aggregation service with excellent real-time log tailing, a clean search interface, and minimal setup friction. It’s the “tail -f across all your systems” experience, hosted. For individual developers and small teams running simple applications, this is often exactly what they need.
Key features
- Fast real-time log tailing across multiple sources simultaneously
- Simple full-text search with date-range filtering
- Support for syslog, Heroku drains, and log file shipping
- Basic alerting on log pattern matches via email or webhooks
- Affordable volume-based pricing tiers
Pros
- Extremely low setup friction, logs flowing in minutes from most sources
- Fast, responsive live-tail interface
- Affordable for low log volumes
- Clean, uncluttered interface suited for developer use
Cons
- No metrics, traces, or cross-signal correlation, log viewing only
- Basic search language; no structured query support for complex analysis
- Performance degrades at high log volumes
- Not suitable as the observability foundation for distributed microservice systems
Best for
Solo developers, small teams, and simple applications that need centralized log viewing without infrastructure complexity. Teams that need a quick “is it working?” check, not a full incident investigation platform.
Pricing
| Plan | Cost |
|---|---|
| Free tier | Limited volume and retention |
| Paid plans | From $7/month; scale by volume and retention period |
OpenTelemetry support
Requires integration. No native OTel support.
Kubernetes support
Limited. Basic Kubernetes log shipping is possible but without native enrichment or deep integration.
AI capabilities
None.
Deployment
SaaS only.
Verdict
Papertrail is the right tool for its specific, narrow use case: simple, fast, hosted log viewing for small projects. It is not the right platform for evaluating a production observability strategy for distributed systems.
How to choose the right log management tool for your team
The right platform is almost never the one with the most features, it’s the one your engineers will actually use consistently under incident pressure, at 3 AM, when every second of extended MTTR has a real business cost.
Step 1: Define your telemetry scope
If you only need log search and aggregation for a handful of services, self-hosted Loki or Graylog can be cost-effective. If you need logs correlated with metrics, traces, and user sessions, the reality for most cloud-native teams running microservices, a unified platform like Middleware eliminates the multi-tool overhead that slows incident resolution.
Step 2: Run the math at your actual log volume
Ingest a week of real production logs into any candidate platform’s free tier. Measure the cost. Project forward at 2x current growth. Factor in retention requirements. Most teams underestimate how quickly Datadog’s $1.70/GB indexing rate compounds at scale, a 50 GB/day environment costs $3,000+ per month on indexing alone before any other Datadog products are added.
Step 3: Test query performance under realistic conditions
The best UI doesn’t matter if queries on 30-day log windows time out during incidents. Test with the volume and time ranges your team actually uses when debugging, not demo data.
Step 4: Factor in operational overhead honestly
Self-hosted tools (Loki, Elastic, Graylog, SigNoz) trade subscription cost for engineering time. For a three-person platform team with strong infrastructure skills, that trade may make sense. For a team where every engineer-hour competes with feature development, a managed SaaS platform’s cost is often justified by the operational load it removes.
Step 5: Assess AI maturity honestly
AI anomaly detection and AI summarization exist in most platforms in 2026. True AI remediation, where the system closes the loop from detection to root cause to applied fix, currently exists only in a small number of platforms. Evaluate whether the AI capabilities you’re being sold are operational features or marketing claims by testing them with real incidents.
Step 6: Evaluate vendor lock-in risk
Every hour your team spends learning a proprietary query language (SPL, DQL, NRQL) is an investment that doesn’t transfer if you change platforms. OpenTelemetry-native platforms (Middleware, SigNoz, Grafana Loki) keep your instrumentation portable regardless of which backend you choose. Proprietary platforms (Datadog, Dynatrace, Splunk) make migration progressively more painful as your usage deepens.
Buyer’s guide: final recommendations by team type
Best for startups
Middleware. The 14-day free trial with unlimited ingestion and no credit card required means a startup can run full-stack observability, logs, traces, metrics, RUM, and OpsAI, with zero upfront commitment. The $0.30/GB usage-based model scales predictably as the business grows, with no per-user or per-host fees that penalize headcount growth.
Best for mid-market teams
Middleware for teams that want the broadest capability set at the most predictable cost. New Relic for teams that are APM-centric and can work within the per-user pricing model. Sematext for teams prioritizing cost over AI and Kubernetes depth.
Best for enterprise organizations
Dynatrace for Fortune 500 environments managing complex hybrid cloud stacks where automated discovery and AI-driven dependency analysis justify the premium. Datadog for enterprises that need the broadest integration library and have a FinOps function to manage the billing complexity. Splunk for enterprises where security, SIEM, and compliance are the primary log management use cases.
Best open-source option
SigNoz for OTel-native all-in-one observability (logs, metrics, and traces) on a self-managed stack. Grafana Loki for cost-efficient self-hosted log storage as part of a Prometheus/Grafana ecosystem.
Best overall
Middleware. Across the criteria that matter for a 3-to-5-year platform decision, OpenTelemetry-native architecture (no vendor lock-in), transparent usage-based pricing (cost predictability), unified telemetry (one platform, not three), deep Kubernetes support with automated remediation, and genuine AI-driven root cause analysis and fix generation (OpsAI), Middleware delivers the strongest combination available in 2026. Its platform maturity relative to Datadog or Splunk is a real tradeoff, but for cloud-native teams not requiring a full SIEM stack, the capabilities are solid and the value case is clear.
Ready to evaluate Middleware for your team?
The fastest way to assess any log management platform is with your real production data. Middleware’s 14-day free trial gives you unlimited data ingestion, no credit card required. Most teams have logs, traces, and metrics flowing in under 30 minutes.
Start your 14-day free trial, unlimited ingestion, no credit card
FAQs
What is a log management tool?
A log management tool collects, centralizes, stores, indexes, and makes searchable the log data generated by applications, servers, containers, and infrastructure. It lets engineering teams search logs in real time, detect anomalies, correlate log events with traces and metrics, set alerts on patterns, and investigate production incidents faster. Modern platforms like Middleware extend this with AI-driven root-cause analysis and automated remediation built directly into the log investigation workflow.
What is the difference between log management and log monitoring?
Log monitoring refers specifically to real-time observation and alerting on log streams, detecting anomalies, threshold breaches, or specific patterns as they appear. Log management is the broader discipline: collection, storage, retention, search, analysis, and reporting across both historical and real-time data. Most modern platforms handle both. If your priority is real-time alerting specifically, see our guide to the best log monitoring tools.
What is the best log management tool in 2026?
For most cloud-native engineering teams, Middleware is the best overall log management platform in 2026. It combines OpenTelemetry-native architecture, usage-based pricing at $0.30/GB with a 14-day free trial (no credit card), unified logs, metrics, traces, and RUM in one platform, deep Kubernetes support, and OpsAI, an AI SRE agent that auto-resolves more than 80% of production issues in customer environments. For security-heavy enterprise use cases, Splunk remains the market leader. For teams on a budget with existing Prometheus/Grafana investment, Grafana Loki is the strongest open-source option.
How much does log management software cost?
Middleware charges $0.30/GB with a 14-day unlimited free trial (no credit card). New Relic provides 100 GB/month free, then $0.35 to $0.60/GB. Datadog charges $0.10/GB ingestion plus $1.70/GB for 15-day indexing. Grafana Loki is free when self-hosted. Splunk Cloud starts around $225/month for 100 GB/day. Enterprise platforms like Dynatrace and Splunk typically involve custom contracts that can reach $500,000+ annually at scale.
What is OpenTelemetry and why does it matter for log management?
OpenTelemetry (OTel) is a CNCF open-source standard for collecting and exporting observability data (logs, metrics, and traces) in a vendor-neutral format. It matters because platforms built natively on OTel (like Middleware and SigNoz) allow you to switch backends without re-instrumenting your services. Platforms that bolt OTel on as an integration (like Datadog) normalize your data into a proprietary format, making migration significantly more difficult and expensive over time.
What is the best log management tool for Kubernetes?
Middleware and Grafana Loki are the strongest choices for Kubernetes log management. Middleware provides the deepest operational automation: OpsAI can detect and auto-remediate pod crashes, OOMKill events, and HPA misconfigurations directly without human intervention. Grafana Loki is the best cost-efficient option for teams already running Prometheus and Grafana.
What is the best free log management tool?
For a free managed SaaS option, Middleware’s 14-day unlimited free trial and New Relic’s perpetual 100 GB/month free tier offer the most complete platforms at no cost. For open-source self-hosted tools, Grafana Loki and SigNoz are the strongest free options, Loki if you prioritize cost efficiency in a Prometheus environment, SigNoz if you want a unified logs, metrics, and traces experience.
What is the difference between centralized logging and log aggregation?
Log aggregation is the process of collecting log data from multiple distributed sources and combining it into a single stream or storage location. Centralized logging is the broader practice: aggregation plus storage, indexing, search, analysis, alerting, and retention management in one place. All modern log management platforms handle both. See: 10 best log aggregation tools in 2026

