Infrastructure monitoring tools are actively monitor the performance, availability, and overall health of your IT infrastructure. They identify anomalies with your systems before they become whole outages. They collect data from your systems, store and visualize on dashboards to track performance and detect issues. These tools also send alerts when something goes wrong, helping teams respond quickly and keep systems running smoothly.
Why do we need infrastructure monitoring tools?
Every organization needs infrastructure monitoring tools to keep critical systems such as servers, networks, and applications healthy and efficient by detecting problems early and maintaining high performance.
Benefits of infrastructure monitoring tools?
Having a good infrastructure monitoring tool makes it easier to manage and maintain your systems. Here are some key benefits:
- Early detection of issues
- Reduced system downtime
- Improved performance and reliability
- Better resource planning and cost management
- Enhanced security through anomaly detection
- Faster troubleshooting and root cause analysis
Want to understand the core of infrastructure monitoring before choosing a tool?
👉 Read our full guide on what is infrastructure monitoring and why it matters.
10 best infrastructure monitoring tools
We’ve compiled a list of top infrastructure monitoring tools to help you pick the right solution for your team.
1. Middleware
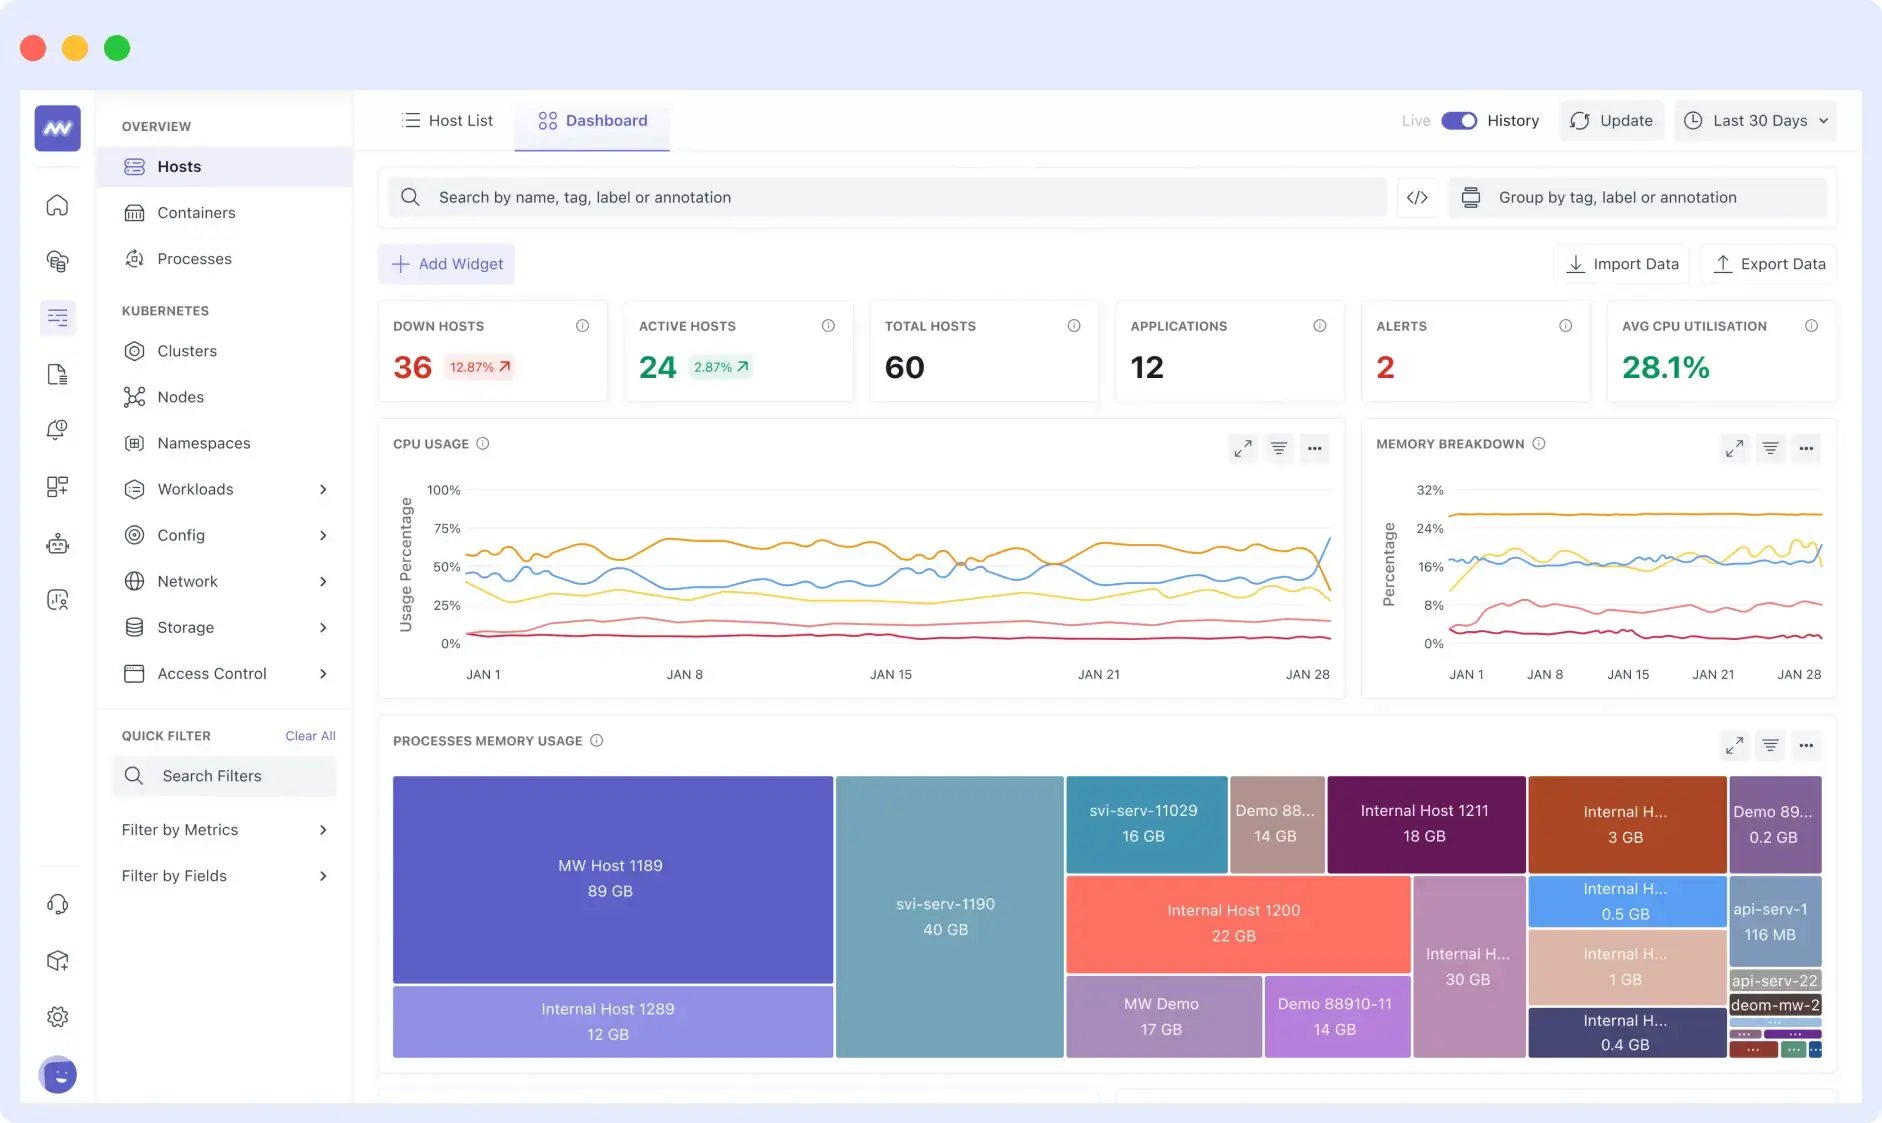
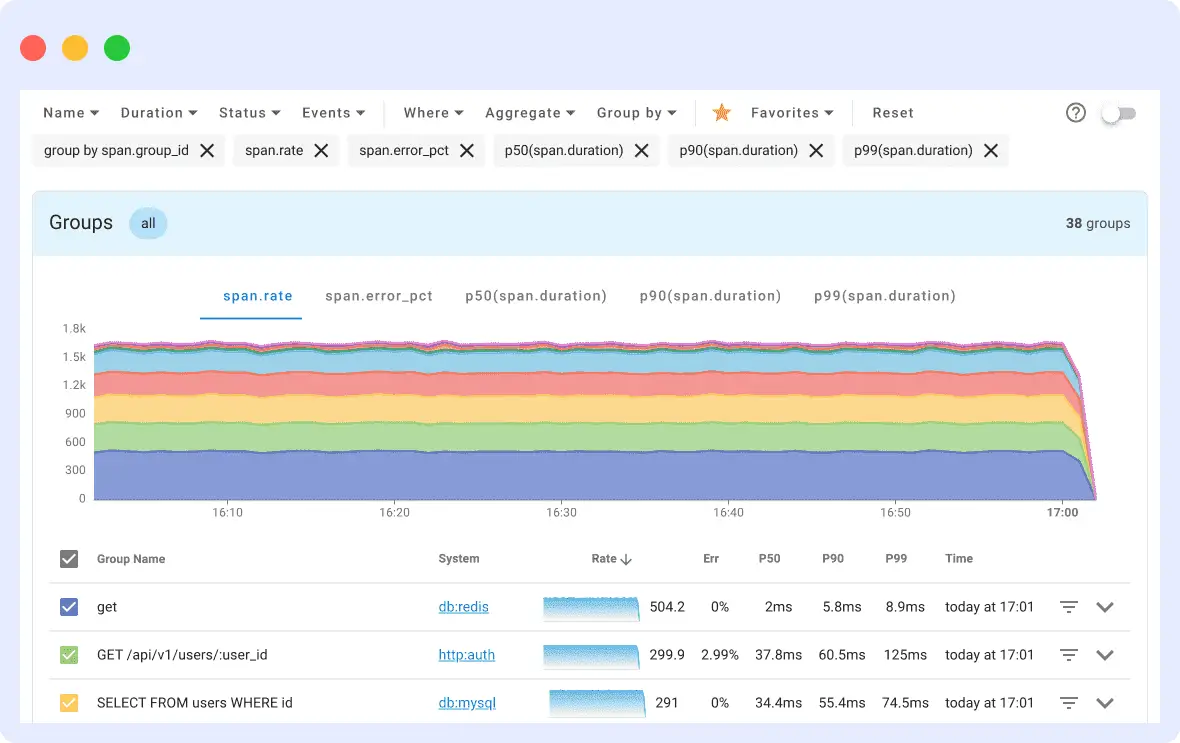
Middleware infrastructure monitoring tool is a unified observability solution that gives you real-time insights into your entire IT environment’s performance. It is the one platform that integrates metrics, logs, and traces, allowing teams to quickly discover and eliminate problems with just one click correlation.
The platform is equipped with customizable dashboards and flexible alerting to assist you in maintaining the system’s health. With manageable data ingestion and usage-based pricing, it is made to be both scalable and cost-effective.
Features:
- Monitors applications and infrastructure, including servers, VMs, containers, and cloud services
- Real-time visibility into thousands of metrics such as CPU usage, memory, and resource status
- One-click correlation of metrics, logs, and traces for faster troubleshooting
- Customizable alerts with thresholds to reduce mean time to detect (MTTD)
- Controllable data ingestion by toggling metrics on and off using tags, reducing observability costs and noise
- Monitor Kubernetes clusters, nodes, and pods with default dashboards.
- Lightweight agent and easy setup process
Pros:
- Unified observability across metrics, logs, and traces in one platform
- Highly scalable and designed to support growing infrastructure
- Supports on-premises, cloud, and hybrid environments
- Competitive pricing with a free tier available
- Specialized monitoring for Kubernetes environments
- Customizable dashboards tailored to specific monitoring needs
Cons:
- Still relatively new in the market.
- Limited community support compared to open-source alternatives
Pricing:
- Free Forever: Up to 100GB data, 1,000 RUM sessions, and 20,000 synthetic checks per month.
- Pay As You Go: $0.30 per GB for metrics, logs, and traces; $1 per 1,000 RUM sessions; $1 per 5,000 synthetic checks.
- Enterprise: Custom pricing with volume discounts, extended data retention, and dedicated support.
2. DataDog
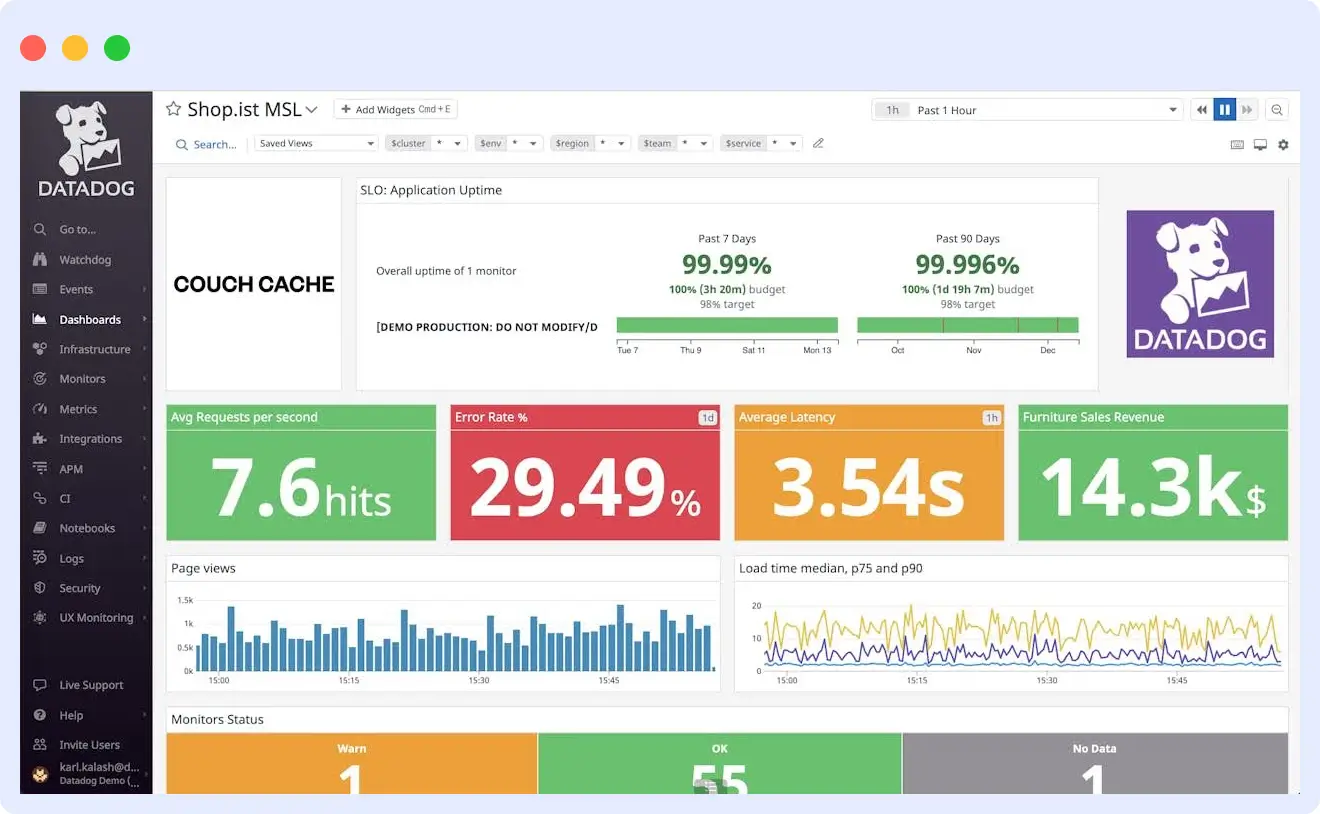
Datadog is a cloud-based infrastructure monitoring tool and analytics platform that provides complete visibility across your entire technology stack. It combines metrics, traces, and logs in one unified solution, allowing teams to monitor applications, infrastructure, and services in real-time.
Features:
- Unified monitoring across servers, containers, databases, and cloud services
- Combines infrastructure monitoring, APM, log management, and user experience monitoring in a single platform
- Offers 850+ built-in integrations with popular services and technologies.
- Customizable dashboards and visualization tools
- Intelligent alerting based on thresholds or anomalies
👉 Before you commit to Datadog, compare it side-by-side with Middleware.
Read: Middleware vs Datadog – Features, Performance & Pricing.
Pros:
- Support for on-premises, cloud, and hybrid environments
- Highly customizable dashboards for different teams and use cases
- Real-time monitoring with immediate visibility into issues
- Powerful analytics, including anomaly detection and forecasting
- Strong API support for automation and custom integrations
Cons:
- DataDog Pricing can get expensive as you scale
- It may be overwhelming for organizations with simple monitoring needs
- Some features are only available in higher-tier plans
- The initial setup and learning curve can be steep for beginners
Pricing:
Datadog offers a free tier for up to 5 hosts with limited features and 1-day metric retention.
- Pro plan: Starts at $15 per host
- Enterprise plan: Starts at $23 per host.
- DevSecOps Pro: Starts at $22 per host.
- DevSecOps Enterprise: Starts at $34 per host.
💰 “Concerned about Datadog’s costs?”
See our breakdown: Datadog Pricing – Is It Worth It in 2026?
3. Prometheus
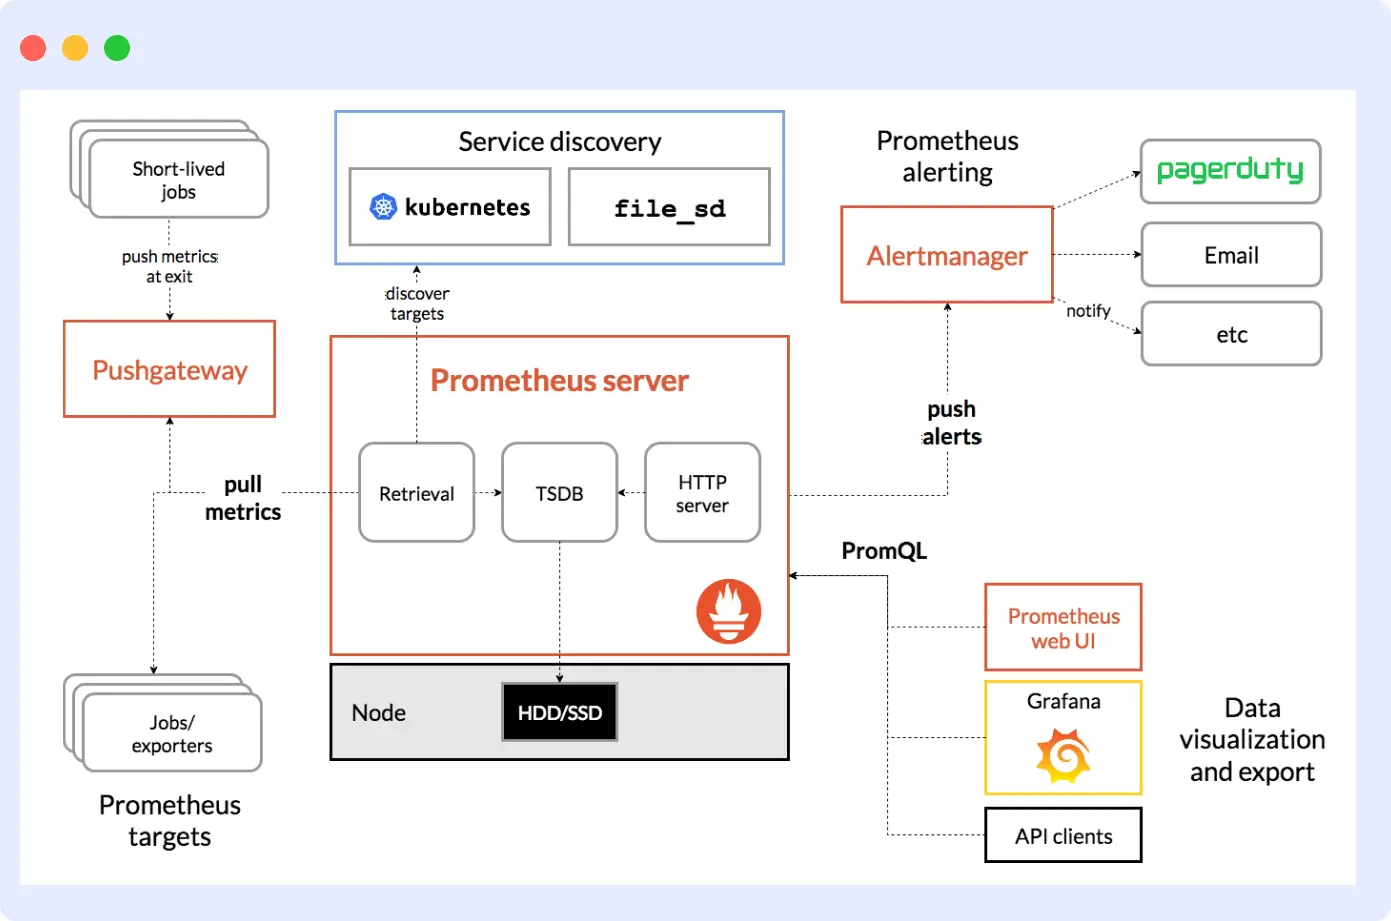
Prometheus is one of the most widely used open source infrastructure monitoring tools, and alerting system designed to be reliable in dynamic environments like microservices and Kubernetes on the cloud, compared to other systems. It collects metrics as time series data and lets you run powerful queries with its custom language, PromQL.
Prometheus comprises several components within the ecosystem, including Prometheus server, client libraries, and push gateways, which are mostly written in Go, therefore, they can be easily generated and deployed as static binaries.
Features:
- Time-series data collection with a powerful query language (PromQL)
- Pull-based model for metrics collection
- Multi-dimensional data model using key-value pairs
- Built-in alert manager for notifications
- Easy integration with Grafana for advanced visualizations
- Native support for Kubernetes monitoring
Pros:
- Free and open-source under Apache 2.0
- No external dependencies
- Scales well for cloud-native environments
- Strong support and adoption in the Kubernetes ecosystem
- Actively maintained by a large open-source community
Cons:
- No built-in long-term storage, as external Prometheus integrations are required.
- PromQL can be hard to learn
- Less user-friendly than commercial alternatives
- Lacks built-in support for logs and traces, as it is primarily focused on metrics
👉 “Not sure if Prometheus fits your scaling needs?”
Discover top Prometheus alternatives that offer modern observability.
Pricing:
- Prometheus is open-source and free to use. There are no licensing fees. However, using it in production may require investing in infrastructure, storage extensions, and ongoing maintenance.
- AWS Managed Prometheus: ~$0.90 per 10M samples ingested + storage & query costs.
- Google Cloud Managed Prometheus: ~$0.06 per million samples ingested + query costs.
- Azure Monitor: ~$0.16 per 10M samples ingested, includes storage.
- Grafana Cloud: Free for first 20,000 time series, then $8 per 1,000 time series.
4. Dynatrace
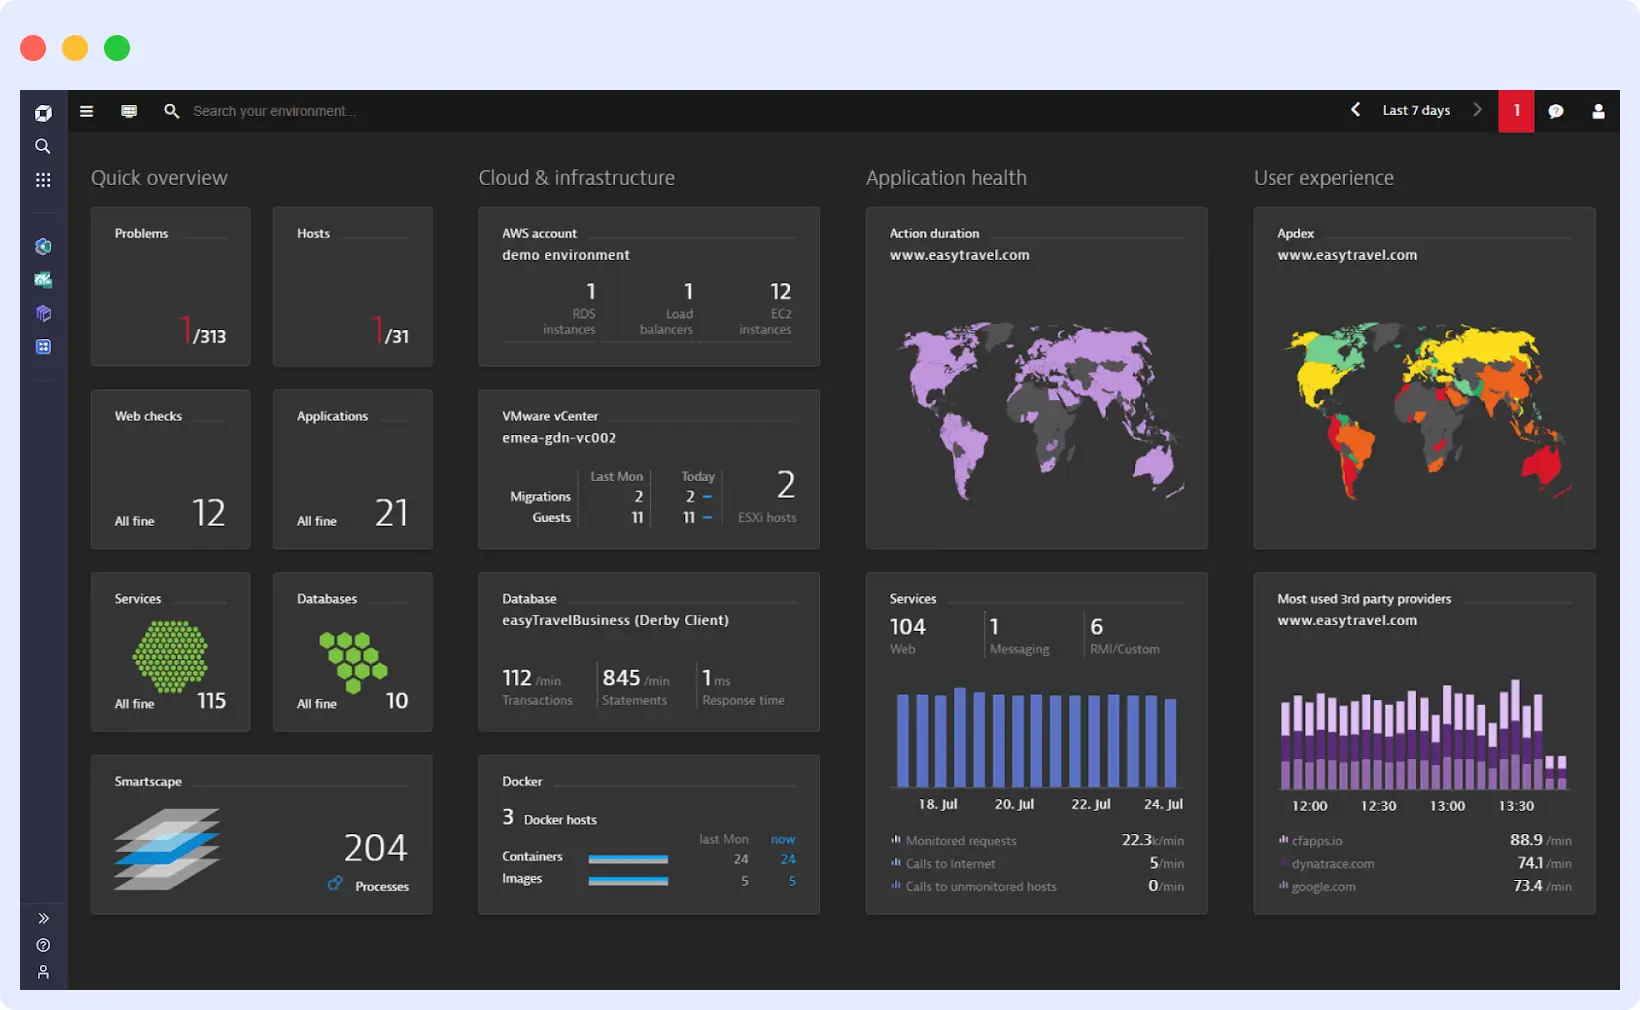
Dynatrace is an AI-powered, full-stack monitoring solution that delivers intelligent observability across applications, infrastructure, and user experience. The solution operates on complex, large-scale systems through automated processes that minimize manual tasks. The built-in Davis AI engine helps detect anomalies and identify their root causes.
Features:
- Davis AI engine for automated anomaly detection and root cause analysis
- Full-stack observability for infrastructure, applications, network, and user sessions
- Cloud and container native monitoring for Kubernetes, AWS, Azure, and GCP
- Real user and synthetic monitoring to assess user experience
- Automatic discovery and monitoring of hosts, VMs, containers, and cloud services
Pros:
- Scalable architecture that can handle large enterprise deployments
- Support for on-premises, cloud, and hybrid environments
- Integrates well with cloud platforms and third-party tools
- Built-in security monitoring and vulnerability detection
- OneAgent technology for automatic full-stack discovery and monitoring
Cons:
- Pricing may be high for smaller teams or organizations
- Complex interface can have a learning curve for new users
- Advanced features might require additional training or support
Pricing:
- Dynatrace pricing starts at $0.04 per hour for infrastructure monitoring and $0.08 per hour for full-stack monitoring on an 8 GiB host.
5. Zabbix
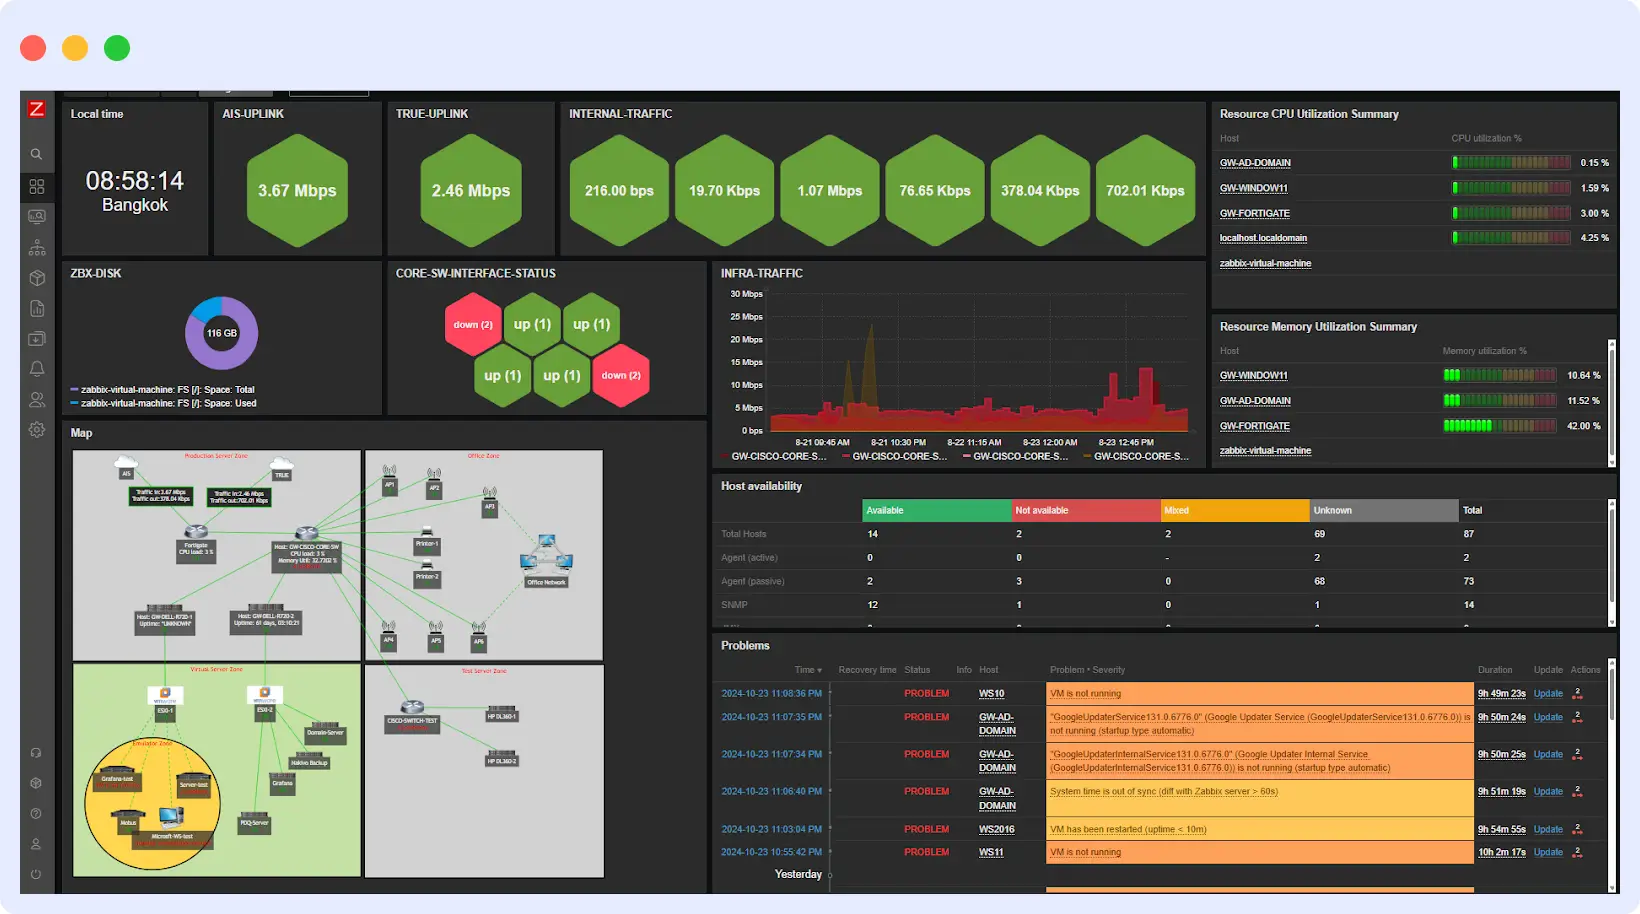
Zabbix is a full-stack open source infrastructure monitoring tool that allows you to monitor everything in your IT infrastructure. It can run either on-premise or on one of the many supported cloud platforms. It allows you to collect metrics from multiple sources like Network devices, Cloud, containers and virtual machines, Databases, Applications, HTTP(s) endpoints, and many more. Zabbix offers unlimited scalability for any infrastructure, flexible monitoring and visualization tools.
Features:
- Monitors networks, servers, cloud services, containers, VMs, and IoT devices
- Supports both agent-based and agentless monitoring
- Works with multiple protocols: SNMP, IPMI, JMX, HTTP, SSH, and more
- An extensive library of official templates and integrations for various platforms and services
- Trigger-based alerting with flexible thresholds and escalation rules
- Auto-discovery of devices and services
Pros:
- Completely free and open-source with no licensing costs
- Support for on-premises, cloud, and hybrid environments
- Active community support and regular updates
- Deploy Zabbix in as little as 5 minutes, either on-premises or in the cloud.
- Comprehensive documentation and knowledge base available in multiple languages
Cons:
- Initial setup and configuration may be complex for beginners, despite fast deployment options.
- Scaling to very large environments might require additional tuning and resources.
- Enterprise-level support requires a paid subscription.
Pricing:
- Open-Source Version: Free forever, self-hosted, community support.
- Zabbix Cloud (Managed SaaS): Starts at $50/month, includes 24/7 uptime and automatic upgrades.
- Technical Support: Paid plans available with 24/7 support and consulting; pricing varies by needs.
6. Nagios
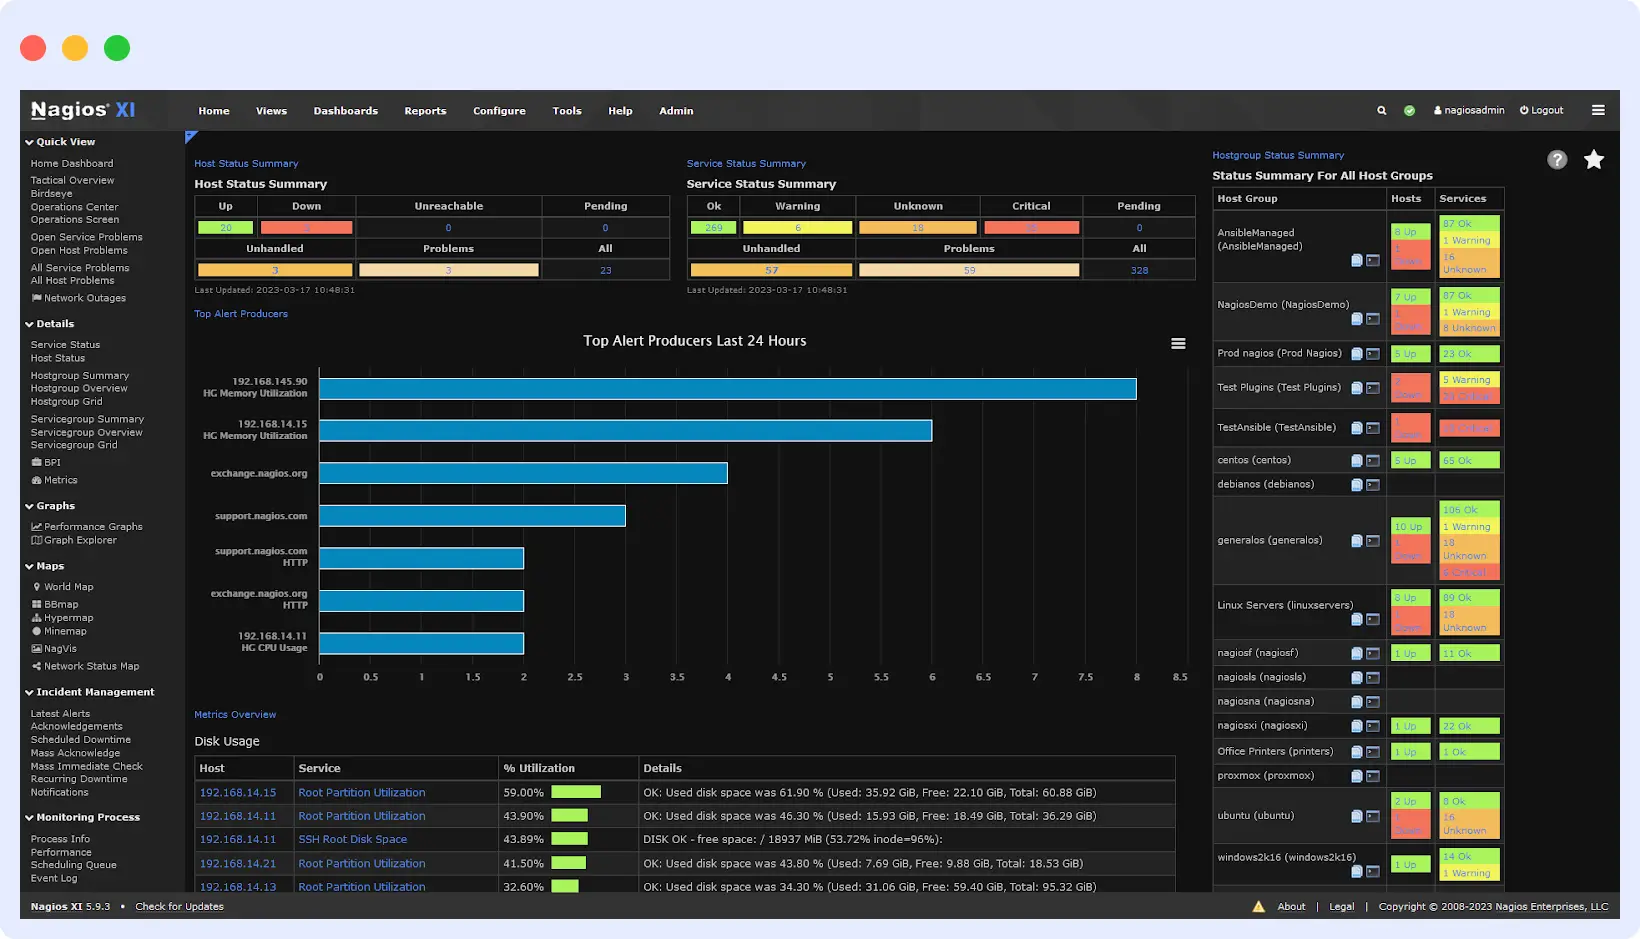
Nagios is one of the oldest and most widely used open source infrastructure monitoring tools available today. The system maintains a reputation for delivering dependable operations together with adaptable functionality. It allows users to monitor essential components of their IT infrastructure, which include applications, operating systems, websites, databases, and log files.
Features:
- Monitors applications, servers, operating systems, and network protocols
- Sends alerts via email, SMS, and other methods when issues occur. Offers customizable notifications and escalation capabilities.
- Two monitoring software variants: Nagios Core (free) and Nagios XI (commercial)
Pros:
- Easy to integrate with other IT management tools through APIs and plugins.
- Strong alerting and notification system
- Capable of monitoring any device or service
Cons:
- Setup can be complex for beginners
- Some users find the interface visually less modern compared to newer tools
- Some features require paid versions or extra setup
Pricing:
- Nagios Core is free and open-source.
- Nagios XI offers a free plan, but for advanced features and official support, the standard prices start at $2,495, and enterprise prices from $4,490.
7. Uptrace
Uptrace is an open source observability tool that brings distributed tracing, metrics, and logs to one platform. Created with OpenTelemetry, Uptrace is aimed at providing scalable and affordable monitoring tools for infrastructure monitoring and optimizations for complex distributed systems.
Features:
- Integrations with OpenTelemetry, Prometheus, Vector, FluentBit, and CloudWatch
- Root cause analysis through trace visualization
- Alert management with customizable thresholds
- Real-time monitoring dashboards
- Multiple notification channels via Slack, Telegram, Microsoft Teams, PagerDuty, OpsGenie, AlertManager, and more.
Pros:
- Combines traces, metrics, and logs in one platform.
- Predictable pricing based on ingested data and active timeseries.
- Active community and regular updates
- Open source and cost-effective
Cons:
- Smaller ecosystem of plugins and extensions
- Requires OpenTelemetry knowledge for optimal use
- Fewer integrations than more mature monitoring solutions
Pricing:
- Uptrace offers a free Community Edition for self-hosted use.
- For the paid plans, pricing is monthly and depends on how much data you ingest, with a minimum budget of $30.
- Spans and logs are billed per gigabyte ingested, while metrics are charged based on the number of active timeseries.
- You can also set custom budgets for your entire organization or individual projects to control costs.
8. App Dynamic
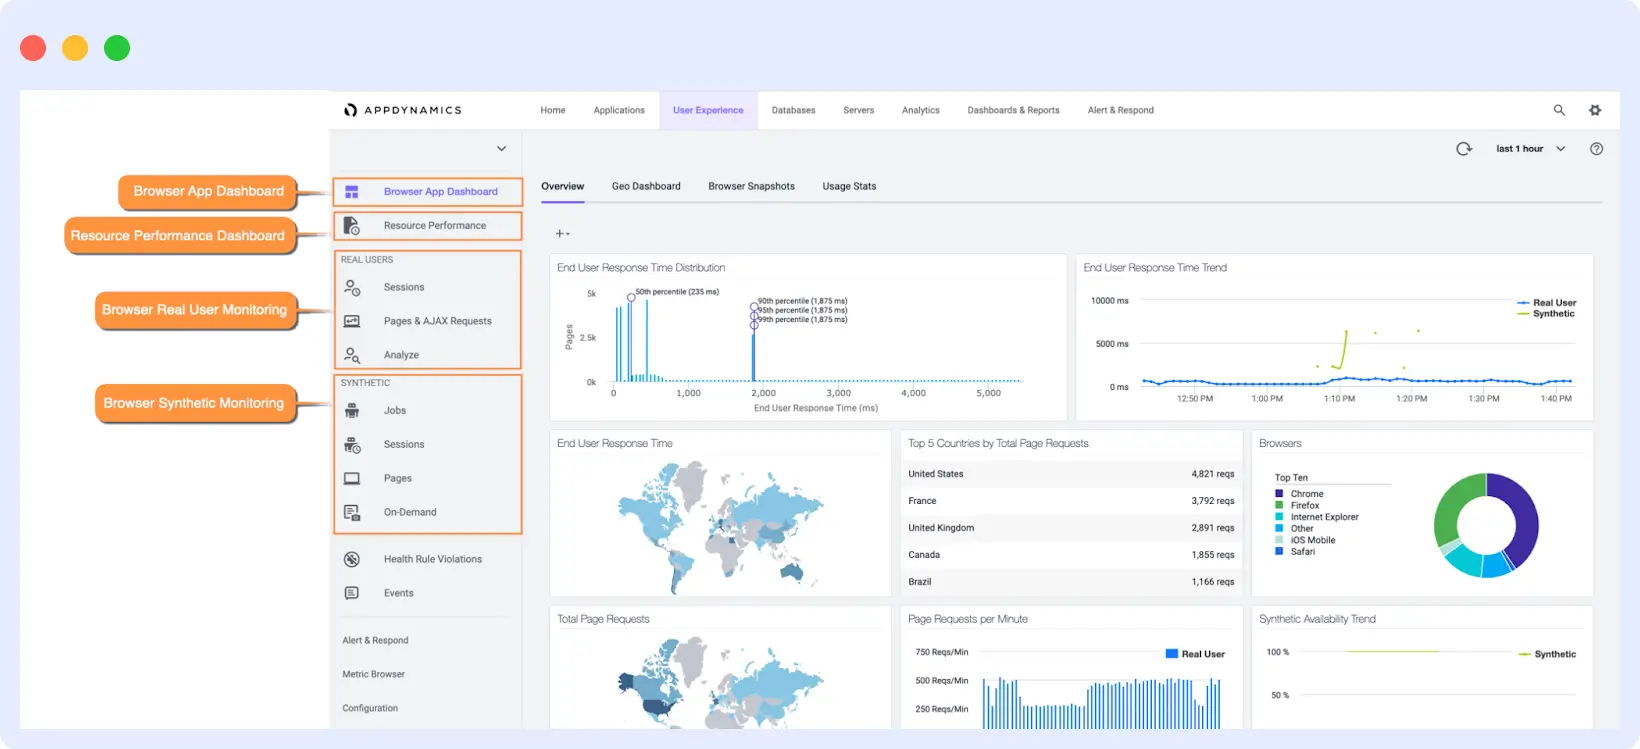
AppDynamics is a comprehensive application performance monitoring tool that provides deep visibility into your applications and infrastructure. The system tracks essential metrics, which include response times, error rate, and system resource usage throughout distributed environments. AppDynamics enables real-time performance bottleneck detection and service dependency mapping, which helps teams identify problems that stem from code or network, or infrastructure issues, making it one of the best monitoring tools for infrastructure in enterprise settings.
Features:
- The platform tracks infrastructures such as servers and networks, containers, and cloud environments while linking their performance data together.
- Organizations can select between self-hosted and SaaS deployments of the platform because it supports both deployment models.
- The platform provides end-user interaction visibility through Real User Monitoring (RUM) and synthetic monitoring capabilities.
- Business transaction monitoring with automatic correlation.
- Uses AI and machine learning to baseline normal behavior and detect anomalies.
Pros:
- Integration with Cisco Secure Application for built-in application security
- Support for on-premises, cloud, and hybrid environments
- Provides code-level diagnostics for deep insights into bottlenecks
- AI-powered root cause analysis helps detect and fix problems faster
Cons:
- Pricing can be higher compared to some other tools, especially for large and complex environments.
- Learning curve for beginners due to the range of features and dashboards
- Setup and customization may require time and expertise
Pricing:
- AppDynamics uses a flexible pricing model based on vCPU and features. Infrastructure monitoring starts at $6 per vCPU per month, with more advanced plans starting at $33 and $50.
- Add-ons like Real User Monitoring and database visibility are priced separately.
9. Paessler PRTG
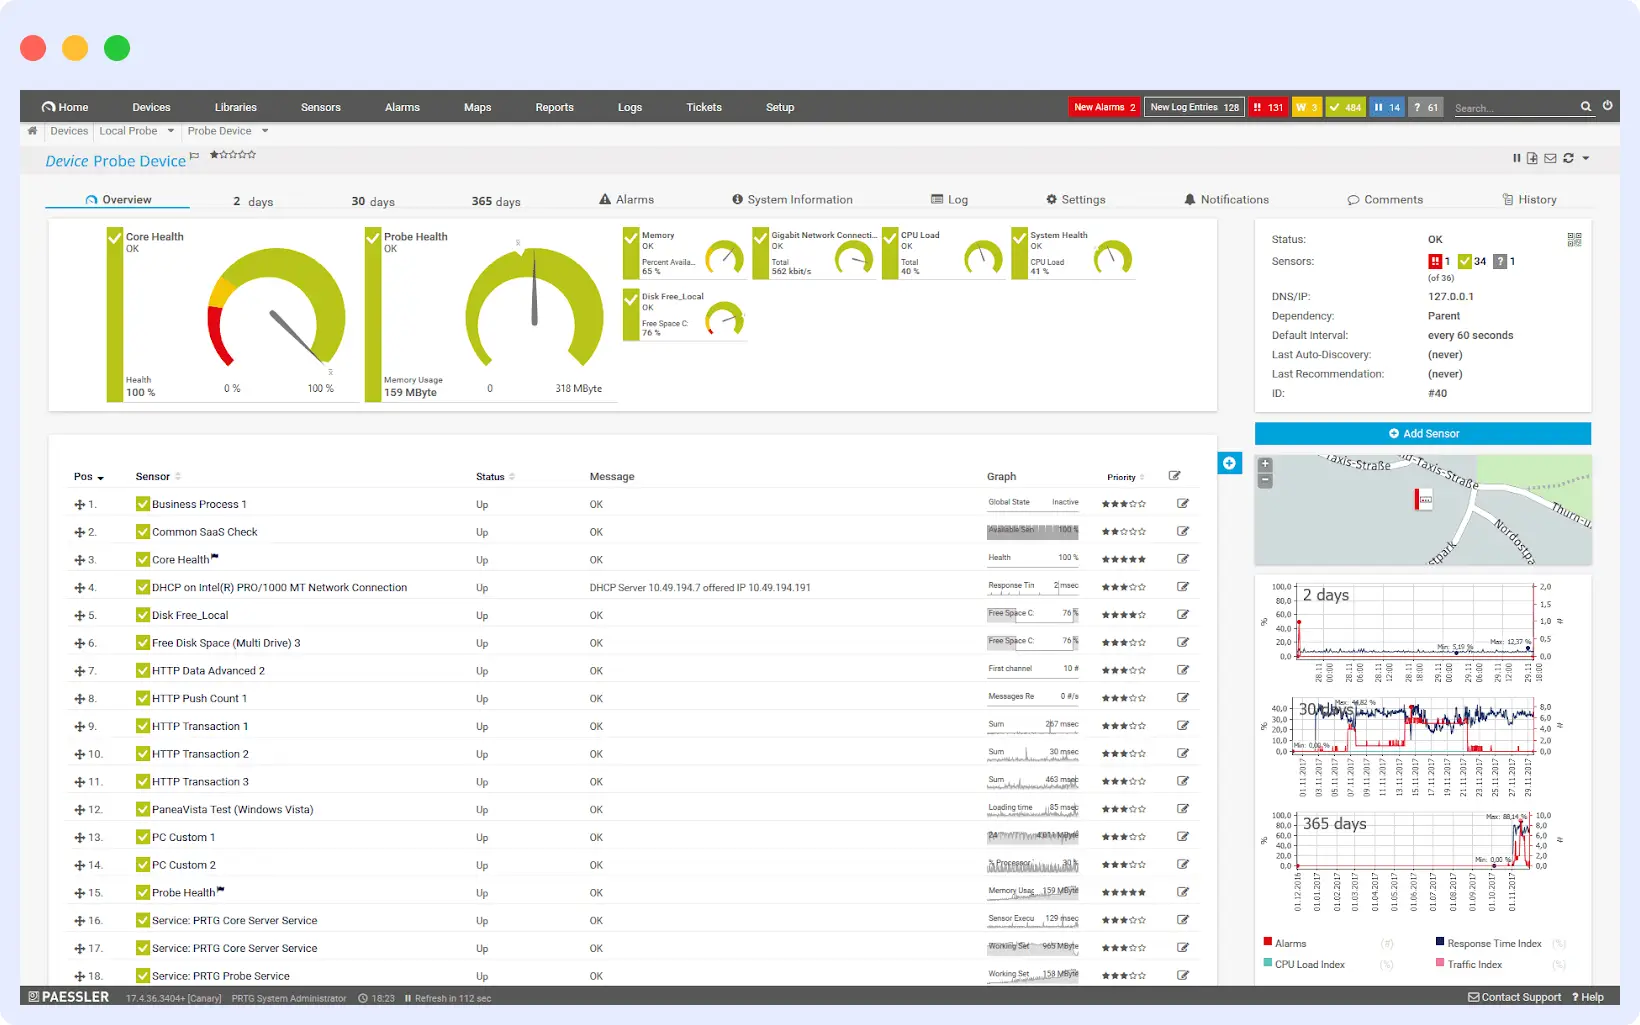
Paessler PRTG is a unified infrastructure monitoring tool which delivers complete visibility into your entire IT infrastructure. The system uses sensors to monitor devices, servers, traffic, databases, and applications. Real-time monitoring and visualization can also be done with customizable dashboards and alert systems, and reporting functions.
Features:
- Built-in map editor to create customized visualizations of your IT infrastructure via drag-and-drop widgets.
- Sensor-based monitoring for network devices, servers, applications, and more
- Real-time alerts via email, SMS, or push notifications
- Generates detailed and customizable reports (on-demand or scheduled) for performance analysis and capacity planning.
- Provides iOS and Android apps for monitoring
Pros:
- Easy to set up and configure
- Highly customizable sensor system
- Comprehensive coverage of network and infrastructure
- Good alerting and reporting capabilities
Cons:
- Sensor-based licensing can become expensive as your monitoring needs grow.
- The learning curve can be steep for advanced features.
Pricing:
PRTG offers a free trial, and paid licenses are billed annually.
- PRTG 500 – $179/month
- PRTG 1000 – $325/month
- PRTG 2500 – $675/month
- PRTG 5000 – $1,183/month
- PRTG 10000 – $1,492/month
10. Solarwinds AppOptics
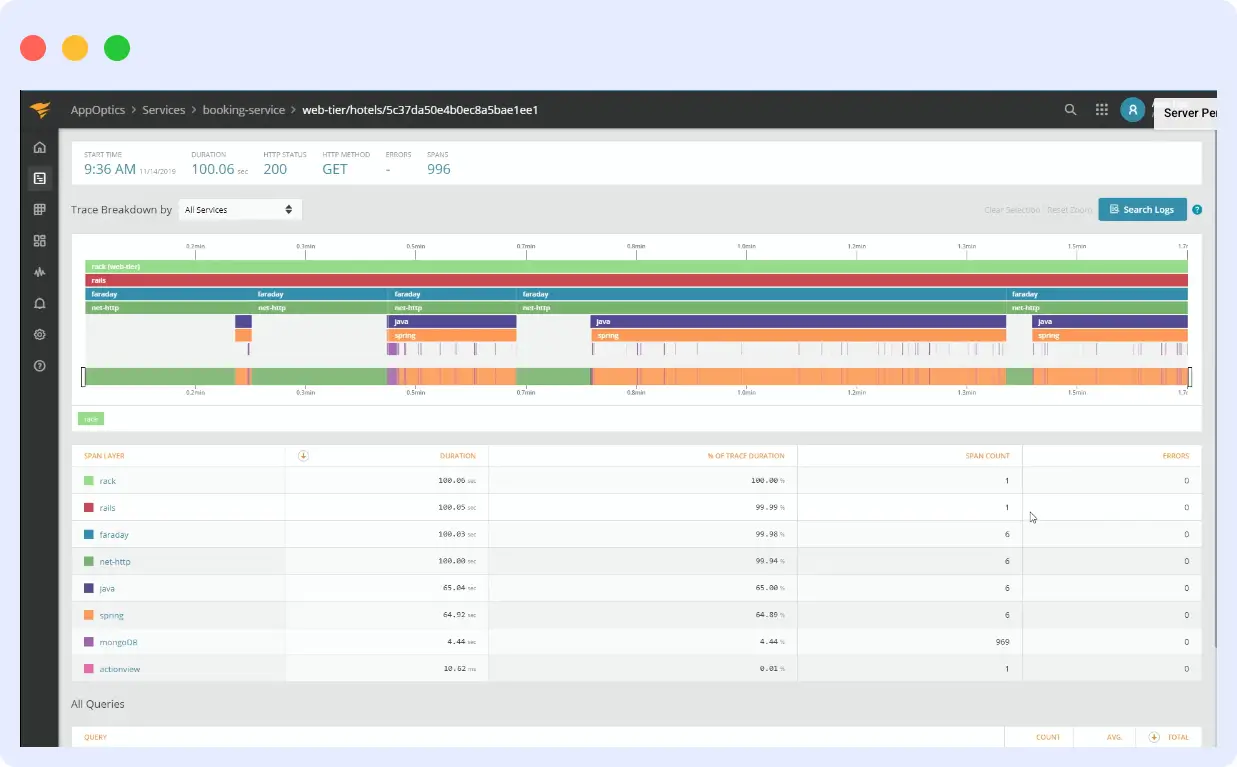
SolarWinds AppOptics is a comprehensive infrastructure and application performance monitoring solution that combines infrastructure metrics, distributed tracing, and custom metrics in a single, SaaS-based platform. It’s designed to provide full-stack visibility for hybrid and cloud-native environments.
Features:
- Combined infrastructure and application performance monitoring
- Host and server monitoring with detailed system metrics
- Custom metrics collection and visualization
- Distributed tracing for end-to-end transactions to pinpoint performance bottlenecks.
- Alerting with multiple notification channels
Pros:
- Easy to set up and use (low-code approach)
- Offers features like distributed tracing and code profiling to quickly pinpoint root causes.
- Affordable compared to competitors like Datadog, New Relic
- Strong infrastructure monitoring capabilities
Cons:
- AppOptics is scheduled to reach its End of Service Life on September 30, 2026. Users are encouraged to migrate to the next-generation APM solution before this date.
- The UI isn’t as modern or intuitive as some newer competitors.
- May lack some advanced analytics and AI-driven insights found in tools.
Pricing:
- Infrastructure Monitoring: $9.99 per host/month
- Full-Stack APM: $24.99 per host/month
- 30-day free trial available
- Also offers Heroku add-ons starting around $29/month
Criteria to choose infrastructure monitoring tools
When selecting an infrastructure monitoring tool for your organization, consider the following key criteria to ensure you choose a solution that meets your specific needs:
- Ease of Use and Setup: Look for a solution with a user-friendly interface, low setup complexity, and minimal learning curve.
- Scalability: Choose a tool that can grow with your infrastructure without performance or cost issues. Consider the number of devices, metrics, and data volume it can manage effectively.
- Integration Capabilities: Check if the tool integrates well with your existing systems, such as ticketing systems, communication platforms, automation tools, and other monitoring or analytics platforms.
- Coverage and Compatibility: Ensure the solution supports your entire technology stack, including operating systems, cloud platforms, containers, and specialized infrastructure components.
- Real-Time Monitoring and Alerting: The tool should provide real-time data collection with customizable alerts to help detect and resolve issues quickly.
- Cost and Licensing Model: Analyze the total cost of ownership, including licensing fees, maintenance, and any add-on modules. Understand the licensing model (e.g., per device, per sensor, per CPU, subscription-based) and how it will scale with your infrastructure.
Conclusion
The right infrastructure monitoring tool is a critical decision that directly impacts your organization’s operational efficiency, system reliability, and team’s productivity. Focus on solutions that align with your specific infrastructure needs, team capabilities, and business objectives rather than simply offering the most features.
We’ve highlighted some of the best infrastructure monitoring tools, and evaluating each tool can help identify a monitoring solution that provides complete visibility into your infrastructure, helps prevent costly downtime, and scales with your organization’s growth.
Middleware stands out by providing unified observability across metrics, logs, and traces in one scalable platform, making it easier to troubleshoot complex environments. You can get started for free here.