Modern applications don’t run in one place. A single user request can pass through multiple services, APIs, and databases before returning a response. When something slows down or breaks, it’s not enough to know that there’s an issue; you need to know where it started.
This is where distributed tracing tools help. They track requests across services, showing how each component performs and where delays or failures occur.
In this guide, we compare the best distributed tracing tools in 2026, from open-source backends to full observability platforms, so you can choose the right fit for your stack, team size, and operational needs.
If you’re new to the concept, you can learn more about what is distributed tracing and how it works in detail in our complete guide.
Quick Comparison Tool
| Tools | Best fit | Pricing | OTel Native? | Self-Hosted or Cloud? |
| Middleware | Full-stack observabilitywith minimal setup | Usage-based with free tier | Native | Both Cloud (SaaS) or self-hosted |
| Jaeger | Teams want open-source all-in-one observability | Free (infra costs only) | Native | Self-hosted only |
| Signoz | Teams using the Grafana stack for observability | Free (self-hosted), paid cloud option | Native | Self-hosted (open source) or managed cloud |
| Dynatrace | Large teams with complex, distributed systems | Usage-based | Compatible | Cloud (SaaS) only |
| Grafana Tempo | Teams using Grafana stack for observability | Free (infra costs only) | Compatible | Self-hosted or Grafana Cloud |
| Datadog | Teams needing flexibility and strong integrations | Usage-based | Compatible | Cloud (SaaS) only |
| Zipkin | Smaller systems or teams starting with tracing | Free (infra costs only) | Compatible | Self-hosted only |
| New Relic | Teams that want a unified and easy-to-use platform | Usage-based with free tier | Compatible | Cloud (SaaS) only |
We’ll take a closer look at each tool, what it offers, and where it fits depending on your setup and requirements.
1. Middleware
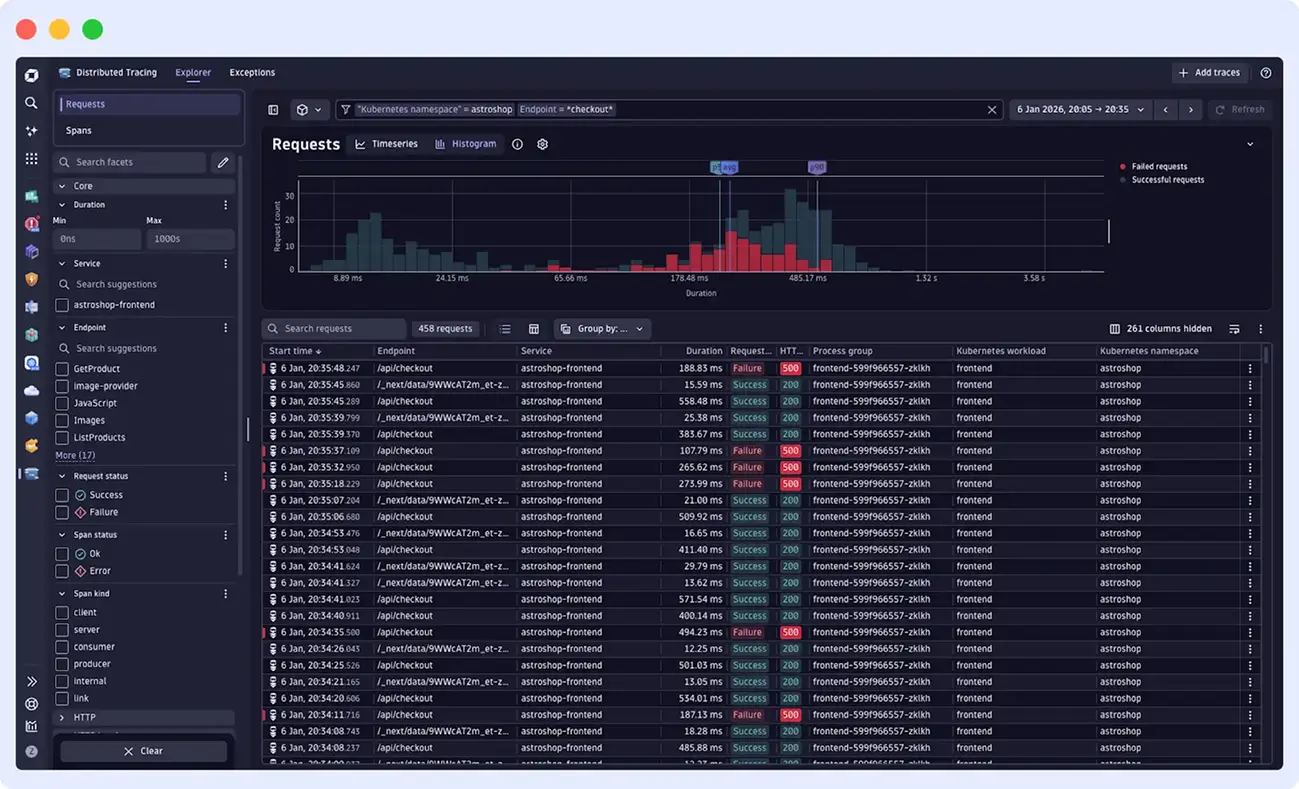
Middleware is a full-stack observability platform that provides distributed tracing, metrics, logs, and infrastructure monitoring in a single system. It is built for cloud-native environments and gives engineering teams end-to-end visibility across their stack, from frontend interactions to backend services.
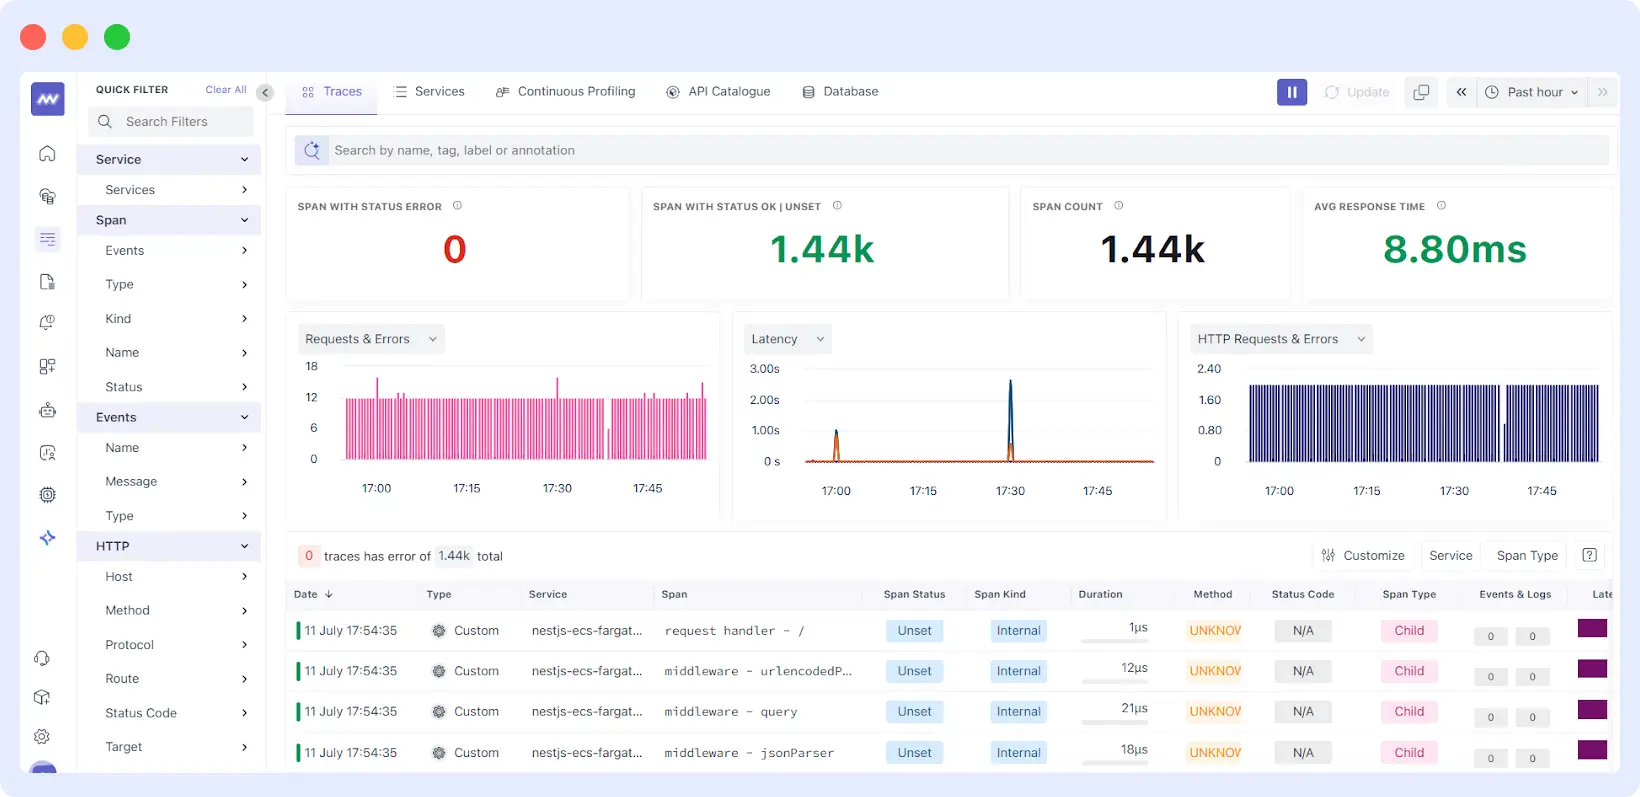
Middleware uses an eBPF-based approach to collect trace data. By operating at the kernel level, it observes system and service interactions with minimal manual instrumentation, reducing the effort required to get started. It automatically begins collecting and correlating trace data from the first user interaction, providing visibility across both frontend and backend services.
Key Features and Strengths
- End-to-end tracing across both frontend and backend, giving a complete view of how requests flow through the system
- Correlates traces with logs and metrics in a single platform, making it faster to move from detecting an issue to identifying its root cause
- AI-powered insights (OpsAI) that surface anomalies, performance bottlenecks, and unusual patterns without requiring constant manual analysis
- eBPF-based data collection that captures system-level interactions with minimal manual instrumentation
- Supports cloud-native environments, including Kubernetes, Docker, and major cloud providers
- The pricing model scales more predictably compared to platforms with complex or usage-heavy cost structures.
Tradeoffs
Middleware is a relatively new platform compared to more established observability tools. While its core capabilities are solid, some advanced enterprise features and integrations are still evolving. The platform has grown quickly and is already seeing adoption across a range of production environments.
When not to use
If you need a tool with 1000+ pre-built integrations from day one. Middleware’s integration ecosystem is still growing, so if your stack relies on niche or legacy systems, verify coverage before committing.
Best fit
Engineering teams that want unified, full-stack observability with minimal instrumentation overhead and predictable pricing, particularly those running cloud-native or Kubernetes-based infrastructure.
Pricing
Middleware pricing offers a free-forever tier. The pay-as-you-go plan charges $0.30 per GB of metrics, logs, and traces, with 30 days of retention. Enterprise pricing is custom and available on request.
2. Jaeger
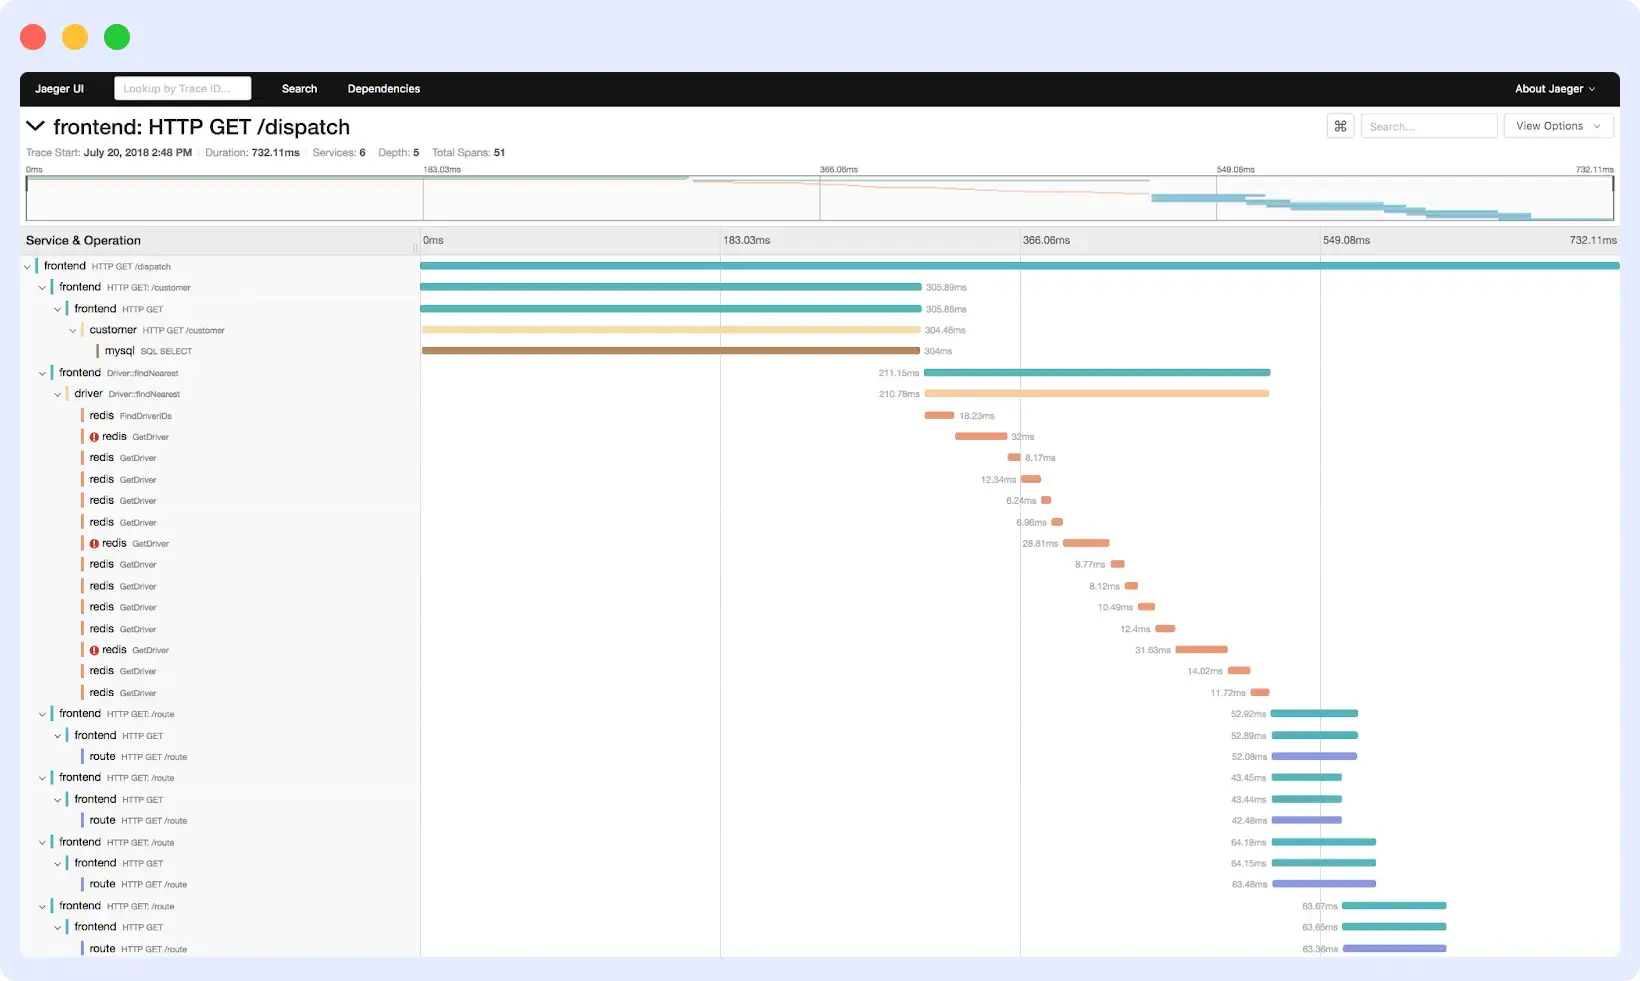
Jaeger is an open-source distributed tracing platform originally built at Uber and now part of the Cloud Native Computing Foundation (CNCF). It helps teams monitor and troubleshoot requests in microservices-based architecture and remains one of the most widely adopted tracing backends in the cloud-native ecosystem.
Key Features and Strengths
- Native support for OpenTelemetry, making it easy to instrument services using standard libraries without vendor lock-in
- Teams can deploy it across Kubernetes, Docker, or self-managed environments, giving them full control over how and where traces are collected and stored.
- Scales well for high-throughput systems, with support for distributed storage backends like Cassandra for high write throughput and Elasticsearch for advanced trace search and filtering
- Strong ecosystem and community support within the CNCF landscape, making it easier to find integrations, documentation, and production-tested patterns
- Core tracing capabilities such as trace visualization, service dependency mapping, and latency analysis
Tradeoffs
Jaeger focuses specifically on tracing and does not natively cover metrics or logs, meaning you will need additional tools to build a complete observability setup. The UI, while functional, is relatively basic compared to commercial platforms.
When not to use
If you need logs and metrics alongside traces. Jaeger is trace-only; you’ll end up running and maintaining two or three separate tools to achieve full observability coverage, which quickly adds operational overhead.
Best fit
Teams running Kubernetes-native or cloud-native infrastructure who want a reliable, open-source tracing backend with strong community support.
Pricing
Jaeger is fully open-source and free to use. Costs are limited to the infrastructure required to run and maintain it.
3. Signoz
SigNoz is an open-source observability platform that integrates distributed traces, metrics, and logs into a single system. It is created as a self-hosted alternative to commercial observability tools.
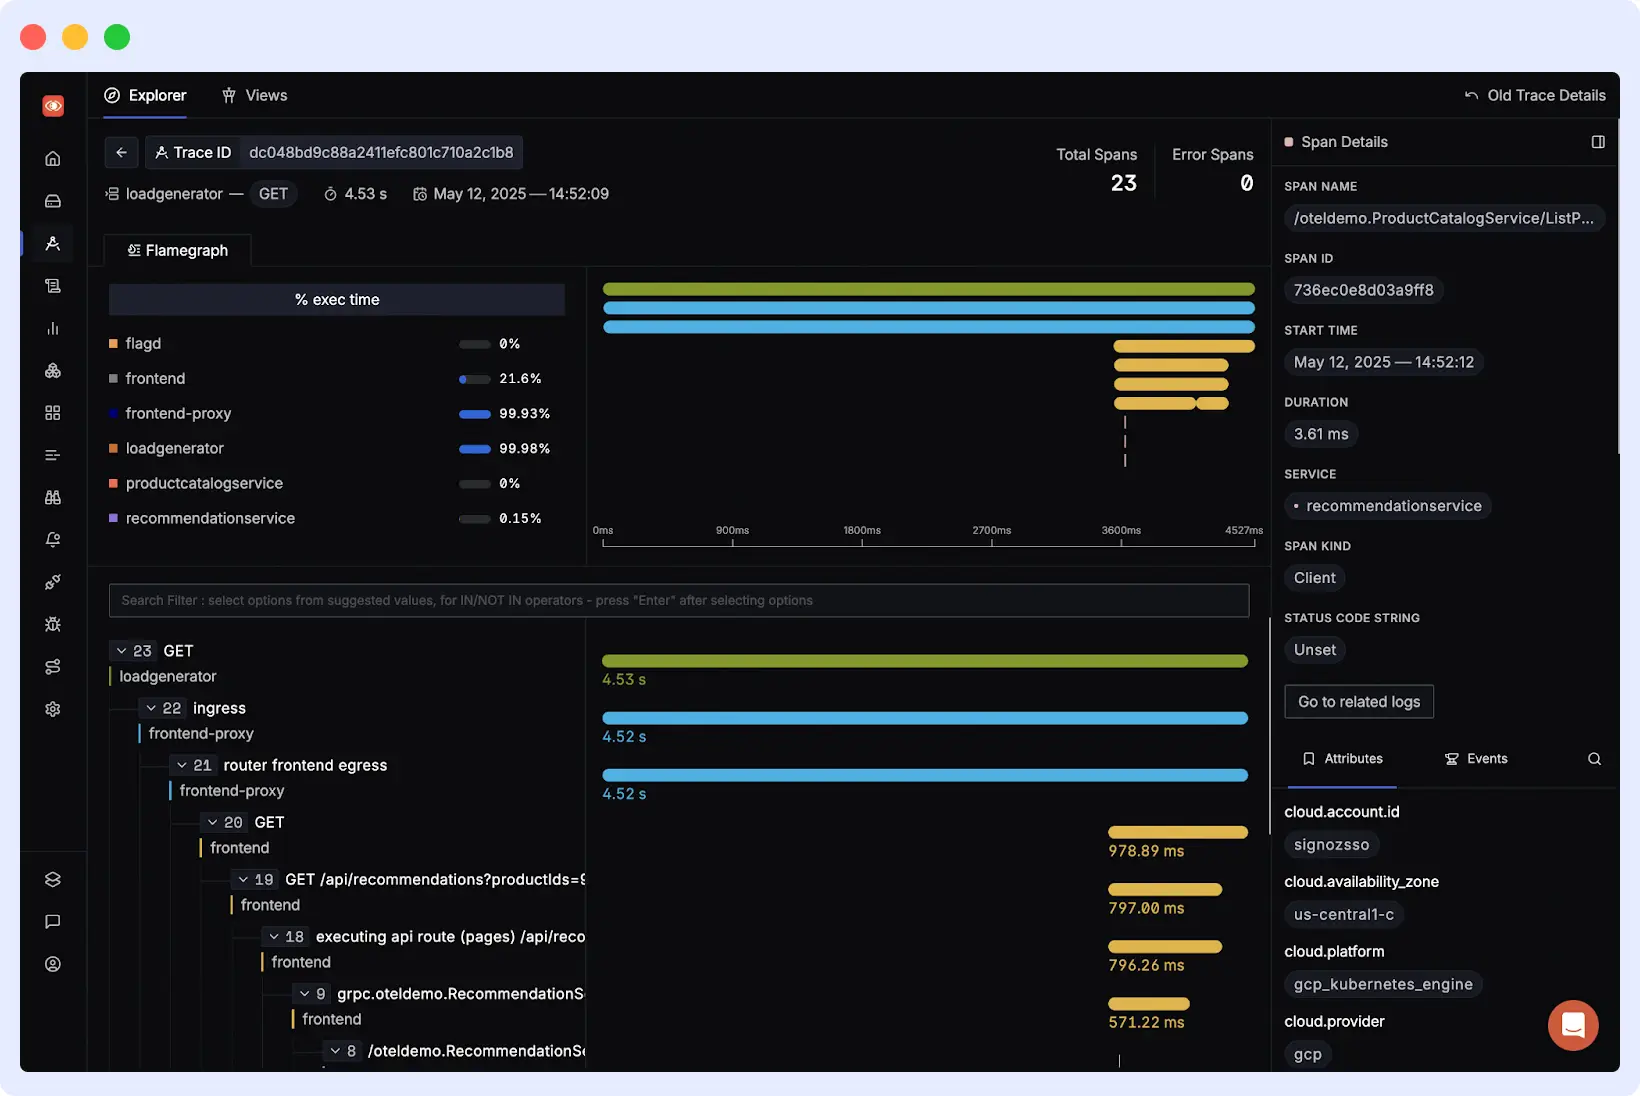
SigNoz uses OpenTelemetry for instrumentation and ClickHouse as a storage layer. Trace data is gathered by the OpenTelemetry Collector and saved in ClickHouse created to handle the large amounts of data and allows quick querying to analyze them.
Key Features and Strengths
- Built on OpenTelemetry, making it easy to instrument services using standard libraries while keeping flexibility across different backends
- Combining Traces, Metrics, and Logs in one platform to minimize the need to operate multiple observability tools
- Uses ClickHouse as its storage backend, enabling fast query performance even at high data volumes
- Includes pre-built dashboards for popular frameworks and infrastructure components to minimize time to setup
- Fully self-hosted, giving teams complete control over their observability data
- There’s also an active open-source community behind it, and if you don’t want to manage it yourself, there’s a cloud option available too.
Tradeoffs
SigNoz requires self-hosting. It adds operational complexity as the data grows. The team needs to operate and scale the underlying ClickHouse stack. While SigNoz aims to consolidate the need for many different tools, it may not yet match other tools’ level of sophistication in some areas. There may also be limitations in the open-source version.
When not to use
If your team has no capacity to manage infrastructure. Self-hosting SigNoz means you own the ClickHouse backend, scaling, and uptime. If no one on your team wants to do that, the cloud option removes that burden but adds cost.
Best fit
Teams looking for an open-source, all-in-one alternative to a commercial observability platform without relying on multiple separate tools.
Pricing
SigNoz is open-source and free to self-host. A cloud-hosted version is available with a free tier; the team plan starts at $49/month, and the enterprise plan starts at $4000/month.
4. Dynatrace
Dynatrace is a full-stack observability platform that provides distributed traces, metrics, logs, and real-user monitoring in a single system. It offers distributed traces, metrics, logs, and real-user monitoring in one system using its proprietary technology, PurePath. It can automatically capture end-to-end request flows across distributed systems.
Dynatrace uses its proprietary OneAgent to instrument systems. It deploys across hosts, containers, and Kubernetes nodes, automatically discovering services and capturing traces, metrics, and logs. It also builds a real-time system model to visualize dependencies between components.
Key Features and Strengths
- OneAgent auto-instrumentation that automatically discovers and instruments services across your environment with minimal manual setup
- PurePath technology captures end-to-end transactions across the full stack without sampling, ensuring complete visibility into every request
- Analysis capabilities with AI technology, also known as Davis AI, which helps identify issues and root causes, and reduces noise in alerts and issues
- Full-stack monitoring with end-to-end transaction tracing, metrics, logs, and user experience data in a single product
- Strong support for cloud-native environments, including Kubernetes and all major cloud providers, including AWS, Azure, and Google Cloud
- OpenTelemetry support for users wanting to extend or customize beyond auto-instrumentation with auto-discovery
Tradeoffs
Dynatrace is an expensive tracing platform, which can be a hurdle for some smaller companies or startups. There is also a higher learning curve with the product, and some organizations may feel that they are paying more than they need.
When not to use
If you’re a startup, small team, or cost-sensitive organization. Full-Stack Monitoring starts at $58/month per host and scales up quickly. Smaller teams often end up paying for automation and AI capabilities they don’t fully use.
Best fit
Large engineering teams and enterprises running complex, distributed systems that need deep visibility across their stack and prefer automated instrumentation and analysis.
Pricing
Dynatrace uses a usage-based pricing model, and Full-Stack Monitoring, which includes APM, starts at $58 per month per 8 GiB host. A 15-day free trial is available.
5. Grafana Tempo
Grafana Tempo is an open-source, highly scalable distributed tracing backend designed for cost-effective storage of trace data. It focuses specifically on storing and querying traces and does not provide a full observability platform on its own.
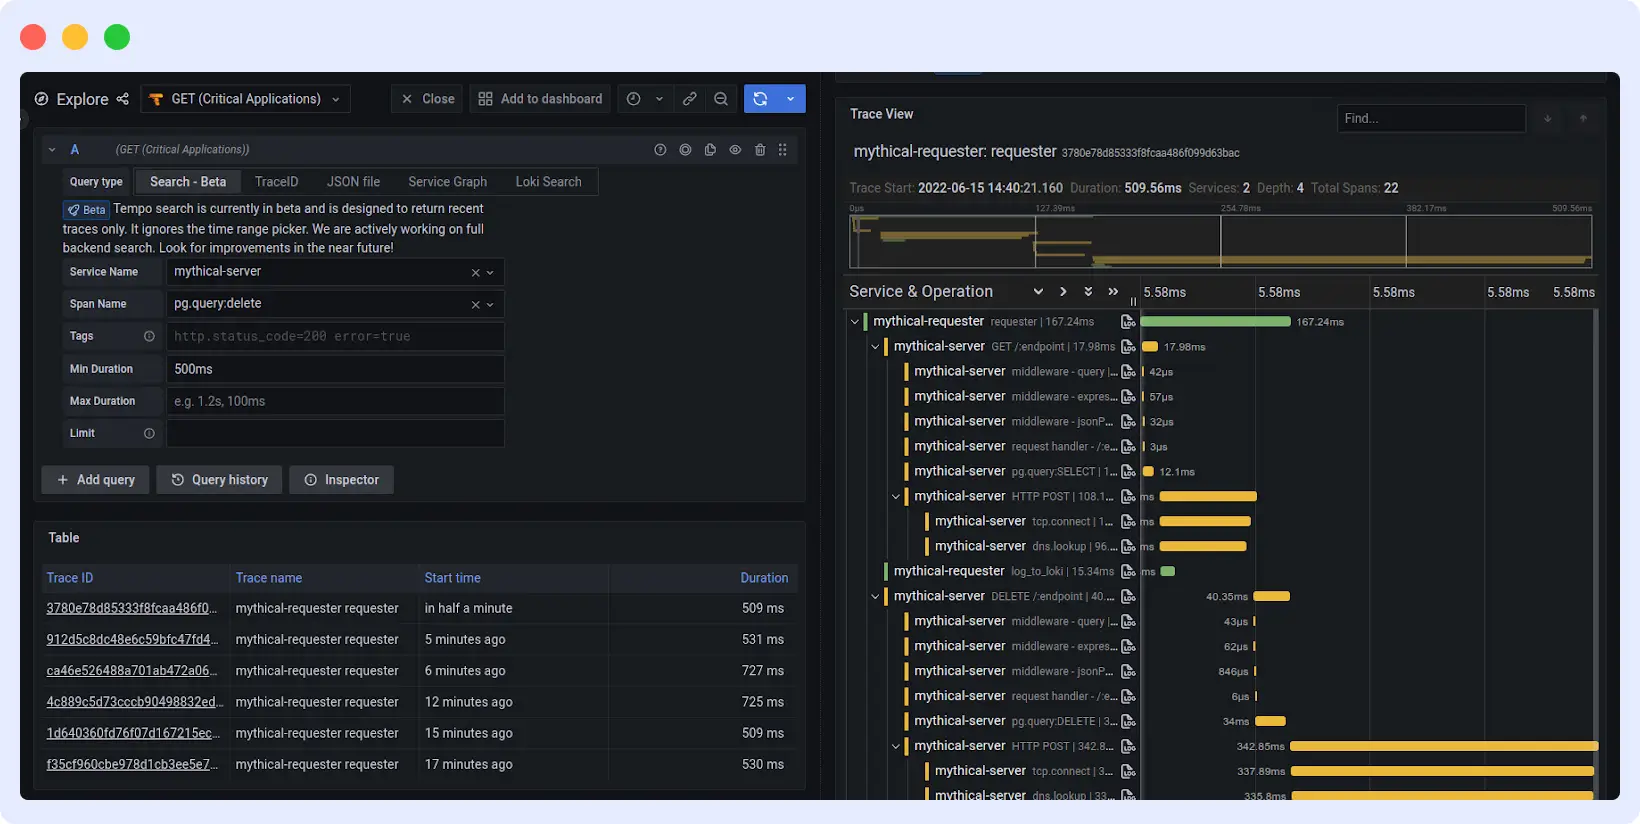
Tempo integrates with Grafana to visualize tracing data alongside metrics and logs. Teams can pair it with Grafana Loki for logs and Grafana Mimir or Prometheus for metrics to build a complete observability setup.
Key Features and Strengths
- Object storage backend significantly reduces the cost of storing large volumes of trace data compared to search-index-based backends
- Native integration with Grafana, Loki, and Prometheus, allowing teams to correlate traces, logs, and metrics within a single Grafana dashboard
- Support for multiple protocols for ingesting trace data, including OpenTelemetry, Jaeger, and Zipkin, makes it easier to adopt and does not require changing existing instrumentation
- TraceQL, Tempo’s proprietary query language, allows users to search and filter trace data based on trace attributes, trace duration, and service names
- Simple architecture that only deals with trace data storage and retrieval makes it easier to understand and implement
Tradeoffs
Tempo does not provide its own UI and relies on Grafana for trace visualization, making it less suitable for teams not already using Grafana.
Also, trace discovery is possible only if users can correlate their trace IDs with their respective log and metric data.
When not to use
If you’re not already on the Grafana stack. Tempo has no standalone UI; it only makes sense when paired with Grafana, Loki, and Mimir. Starting from scratch with Tempo means setting up four separate systems before you see a single trace.
Best fit
Teams already using the Grafana observability stack who want a cost-efficient tracing backend that integrates natively with their existing logs and metrics setup.
Pricing
Tempo is fully open-source and free to use. Grafana Cloud offers a managed version with a free tier, and Pro starts at $19 per month.
6. Datadog
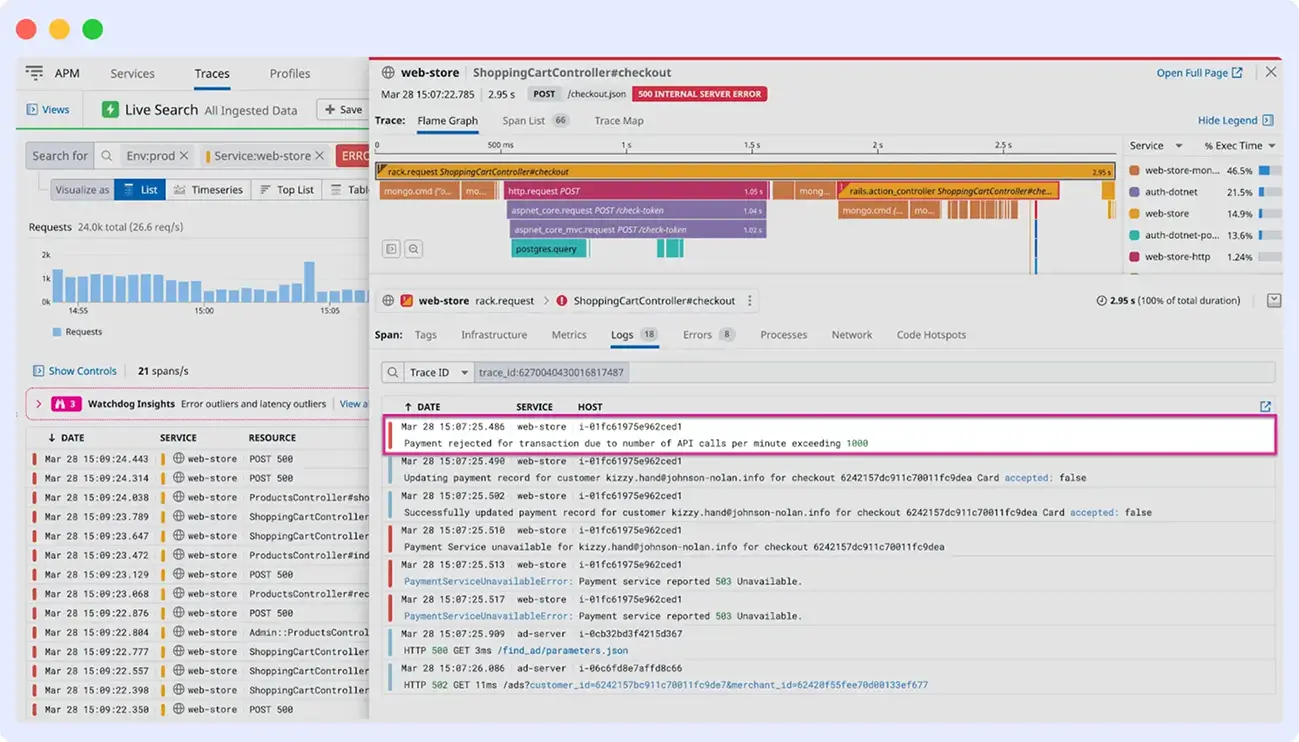
Datadog is a cloud-based observability platform that combines infrastructure monitoring, log management, real user monitoring, security, and application performance monitoring in a single managed solution. Its APM module supports distributed tracing, giving teams request-level visibility into service performance and how requests flow across systems.
Key Features and Strengths
- Automatic instrumentation across a wide range of languages and frameworks, reducing the time required to get tracing up and running
- Seamless correlation between traces, logs, metrics, and infrastructure data within a single platform, making it faster to move from an alert to a root cause
- Intuitive and polished UI for exploring traces, service maps, and performance bottlenecks
- Supports tail-based sampling with the Intelligent Retention Filter of Datadog, which ensures traces of slow or erroneous requests are retained.
- Integrations with cloud providers, Kubernetes, serverless environments, and a wide range of third-party tools
- OTel-compatible and teams can instrument and send data to Datadog without vendor-specific SDKs.
Tradeoffs
Datadog can become expensive as data volume grows, especially with high trace ingestion and longer retention periods. Managing costs often requires careful configuration of sampling and data controls. Some teams also find the breadth of the platform overwhelming, particularly during first-time onboarding.
When not to use
If your traffic is unpredictable or you rely on OTel, this can become costly. High-watermark billing means a single spike can inflate your entire month’s bill, and OTel metrics are billed as custom metrics at a higher rate directly penalizing teams that choose open standards.
Best fit
Teams that want a fully managed, all-in-one observability platform with minimal operational overhead and strong out-of-the-box integrations across their entire stack.
Pricing
Datadog bills APM based on the number of hosts and indexed spans. Prices start at $36 per host per month. APM Pro is $42 per host per month, and APM Enterprise is $48 per host per month. A 14-day free trial is available.
7. Zipkin
Zipkin is an open-source distributed tracing system originally developed at Twitter. It collects, stores, and visualizes traces in microservices-based systems and remains one of the earliest tracing tools in use today.
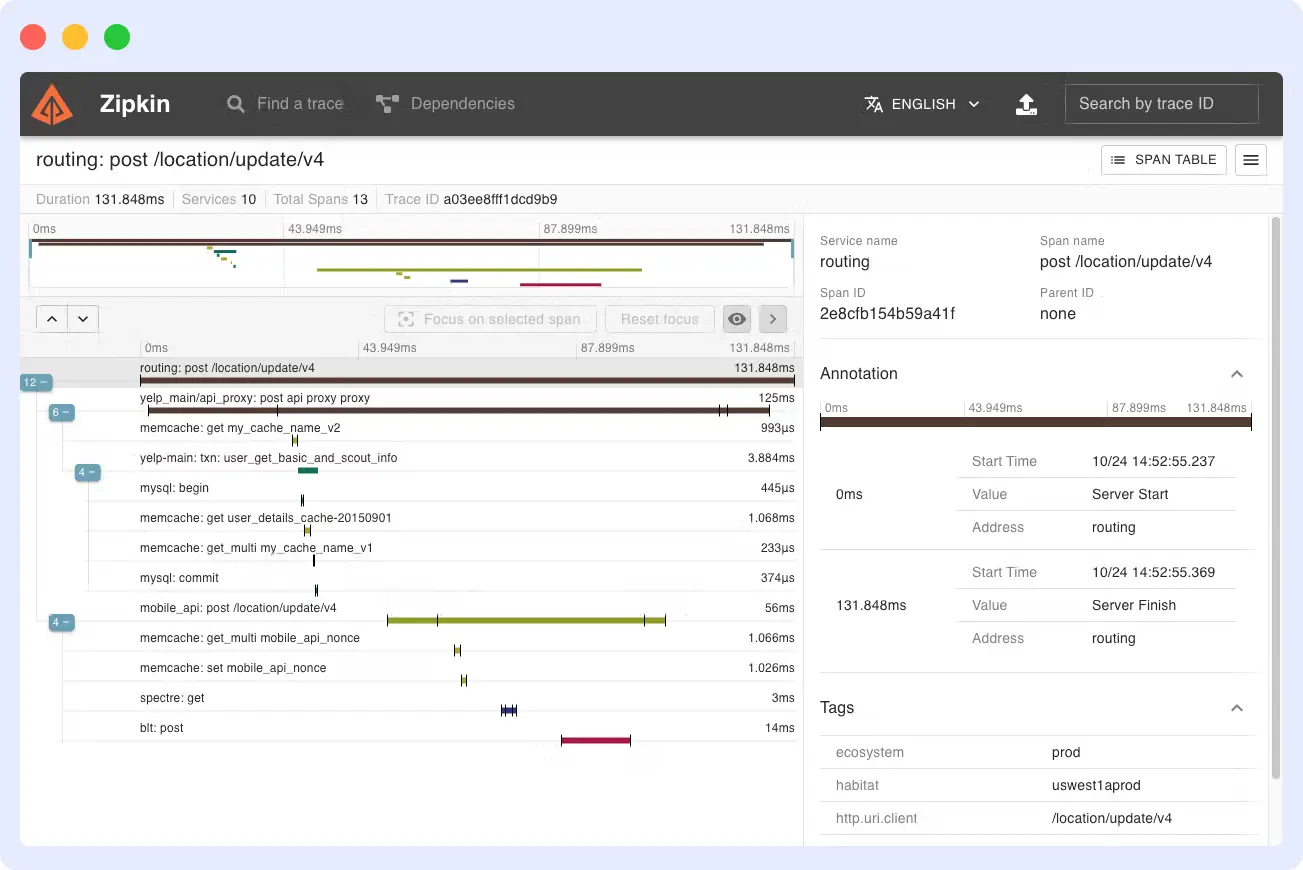
Zipkin instruments services using libraries or the OpenTelemetry Collector to capture trace data as requests move across services. The collected data is then stored and visualized through its built-in UI, allowing teams to analyze request paths and latency.
Key Features and Strengths
- Simple architecture that is easy to deploy and get running quickly, making it a good option for teams new to distributed tracing
- Supports multiple storage backends, including Elasticsearch and Cassandra, giving teams flexibility based on their existing infrastructure
- OpenTelemetry compatible, allowing teams to instrument with OTel and export trace data to Zipkin
- Large community and broad framework support across many languages, including Java, Go, Python, Ruby, and JavaScript
- Lightweight footprint with low operational overhead compared to more feature-rich platforms
Tradeoffs
Zipkin covers tracing only and does not provide native metrics or log management, so it needs to be paired with other tools for a complete observability setup. Its UI is functional but basic, and it lacks some of the more advanced querying and analysis capabilities found in newer tools. Development activity has also slowed compared to more actively maintained projects.
Best fit
Teams that need a simple, lightweight tracing backend and do not require a full observability platform. Also a good fit for teams already familiar with the Zipkin ecosystem or running legacy systems built around it.
When not to use
If you’re starting a new project. Jaeger has superseded Zipkin as the recommended open-source starting point; it has more active development, better OTel support, and a wider ecosystem. Zipkin is best left for teams maintaining systems already built around it.
Pricing
Zipkin is fully open-source and free to use. Costs are limited to the infrastructure required to run and maintain it.
8. New Relic
New Relic is a full-stack observability platform that provides distributed tracing, metrics, logs, and user monitoring in a single system. Its APM product enables distributed tracing, helping teams understand how requests flow across services and where performance issues occur.
New Relic uses agents and OpenTelemetry-based instrumentation to collect trace data from applications. Traces are analyzed and correlated with platform metrics and logs, allowing teams to move from high-level performance signals to detailed request-level insights.
Key Features and Strengths
- End-to-end distributed tracing with request-level visibility, including latency breakdowns across services and dependencies
- Unified platform that combines traces, metrics, logs, and user data in a single interface
- Strong support for OpenTelemetry, allowing flexible and standardized instrumentation across services
- Clean and approachable UI that makes it easy to explore traces and identify performance issues
- Built-in correlation across telemetry data, helping teams move quickly from alerts to root cause
- Flexible query capabilities using NRQL for deeper analysis of trace and performance data
Tradeoffs
Costs can grow significantly as data ingestion volumes increase, which can make New Relic expensive for high-traffic systems. While the platform is easy to get started with, managing data usage and pricing can require careful configuration. Some advanced features and configurations may also require a learning curve.
When not to use
If your data volume is high and unpredictable. New Relic’s usage-based pricing scales quickly with high ingest volumes. Also, skip it if you need your OTel semantic conventions preserved exactly. New Relic converts OTel data into its internal format, which can drop context in translation.
Best fit
Teams that want an easy-to-use, full-stack observability platform with strong OpenTelemetry support and a unified view of their telemetry data.
Pricing
New Relic uses a usage-based pricing model based on data ingested. A free tier is available with 100GB of data ingest per month and access to most platform features. Full platform pricing is not publicly listed and requires contacting the sales team.
What to Look For in a Distributed Tracing Tool
There are a number of alternatives, and the correct distributed tracing tool is not solely based on features. The following are the major considerations to be made when making a decision.
Ease of setup and instrumentation
How quickly can you get meaningful traces into the system? Some tools support auto-instrumentation for common frameworks, while others require more manual work to add tracing to each service.
Language, framework, and ecosystem support
Make sure the tool supports the languages and frameworks your system depends on. It should also integrate well with your existing stack, including your cloud provider, Kubernetes setup, and alerting tools.
Storage and scalability
Consider how the tool handles trace storage as your system grows. Some tools manage this for you, while others require you to handle storage and scaling yourself.
UI and query capabilities
The UI must be designed in such a way that searching, filtering, and analyzing traces are easy. The more quickly your team can convert an alert to the root cause, the more the tool becomes useful.
Pricing and operational trade-offs
Open source reduces licensing costs but increases operational burden. Managed platforms reduce maintenance but can become expensive at scale. The best decision usually balances both budget and engineering time.
Open Source vs Managed
Choose open-source tools (like Jaeger, Tempo, SigNoz) if you have DevOps capacity, specific data residency requirements, or want minimal licensing costs. Opt for managed platforms (like Middleware, Datadog, New Relic) if you prefer minimal operational overhead, SLA-backed support, or are a smaller team without dedicated platform engineers.
FAQs
Which distributed tracing tool is best for microservices?
For most microservices teams, the answer depends on how much you want to operate yourself. Middleware and SigNoz give you unified traces, logs, and metrics in one platform, which matters in microservices because a single request touches many services, and you need all three signals to debug it. Jaeger is the best pure open-source option if you only need tracing. Datadog works well if you need 800+ integrations and have the budget for it.
What is the best free distributed tracing tool?
Jaeger and Zipkin are completely free; you only pay for infrastructure. SigNoz is free to self-host with a generous open-source edition. For managed platforms, both Middleware and New Relic offer free tiers with 100 GB/month of data ingestion, making them the lowest-cost entry points if you don’t want to manage your own backend.
Which distributed tracing tools work with OpenTelemetry?
All tools on this list accept OpenTelemetry data, but there is an important difference. Jaeger, SigNoz, Grafana Tempo, and Middleware are OTel-native meaning they were built around OpenTelemetry from the ground up and your spans, semantic conventions, and trace context arrive exactly as sent. Datadog, Dynatrace, and New Relic are OTel-compatible they accept OTel data but convert it internally, which can drop semantic conventions in translation.
Can I do distributed tracing without changing my code?
Yes, with the right tool. Middleware uses eBPF-based instrumentation that captures trace data at the kernel level, requiring no SDK changes to individual services. Dynatrace’s OneAgent also automatically discovers and instruments services at the host level. For most open-source tools like Jaeger or Grafana Tempo, you still need to add OTel instrumentation libraries to your code though OpenTelemetry’s auto-instrumentation libraries reduce that effort significantly for common frameworks.
How does distributed tracing work with Kubernetes?
In Kubernetes, each pod or service generates spans as it processes requests. These spans are collected by an OpenTelemetry Collector running as a DaemonSet or sidecar, then forwarded to your tracing backend. Jaeger, SigNoz, and Middleware all have native Kubernetes support with pod, namespace, and label enrichment built in. Middleware goes further with eBPF-based collection that instruments services at the node level without requiring changes to individual pod configurations.