
Whether you’re powering a Black Friday sale on an e-commerce platform, handling real-time dashboards in a SaaS app, or running a mobile app with thousands of daily active users performance issues can surface anytime and for anyone.
From slow API responses during peak traffic, to laggy frontend interactions on older mobile devices, or database queries timing out under load there’s a wide range of reasons why your app might slow down, crash, or frustrate users.
We’ll learn how to detect these issues in real-time and also discover strategies you can implement to troubleshoot them.
Application Performance Matters More Than You Think
Your users expect applications to be lightning-fast. Slow queries during peak usage can cause frustration amongst your users, leading to lost revenue and customers.
Here are some harsh facts:
A mere 1s delay in page load can reduce your conversions by 7%.
Moreover, if your app takes longer than 3 seconds to load, a lot of users on their mobiles will not think twice before abandoning your app. On the bright side, these annoying performance issues or application performance issues follow a predictable pattern, so once you know what to look for, it’s easier to narrow them down, detect them, troubleshoot them and make them go away.
Categorizing Performance Issues
We can broadly categorize these application performance issues into 3 buckets:
Frontend Issues: User-facing issues such as slow page loads to unresponsive user interfaces, data rendering issues, etc., constitute frontend issues.
Backend Issues: Server-side issues include delayed data fetching on the server, data querying delays, API timeouts, etc.
Infrastructure Issues: The third bucket involves issues such as network latency, misconfigured servers, and the classic “it works on my machine” syndrome.
How to Fix Slow Applications: Your Step-by-Step Troubleshooting Guide.
Common Application Performance Issues
We’ll now discuss 14 common application performance issues and understand why they happen and how you can prevent them.
1. Network Latency
What is Network Latency?
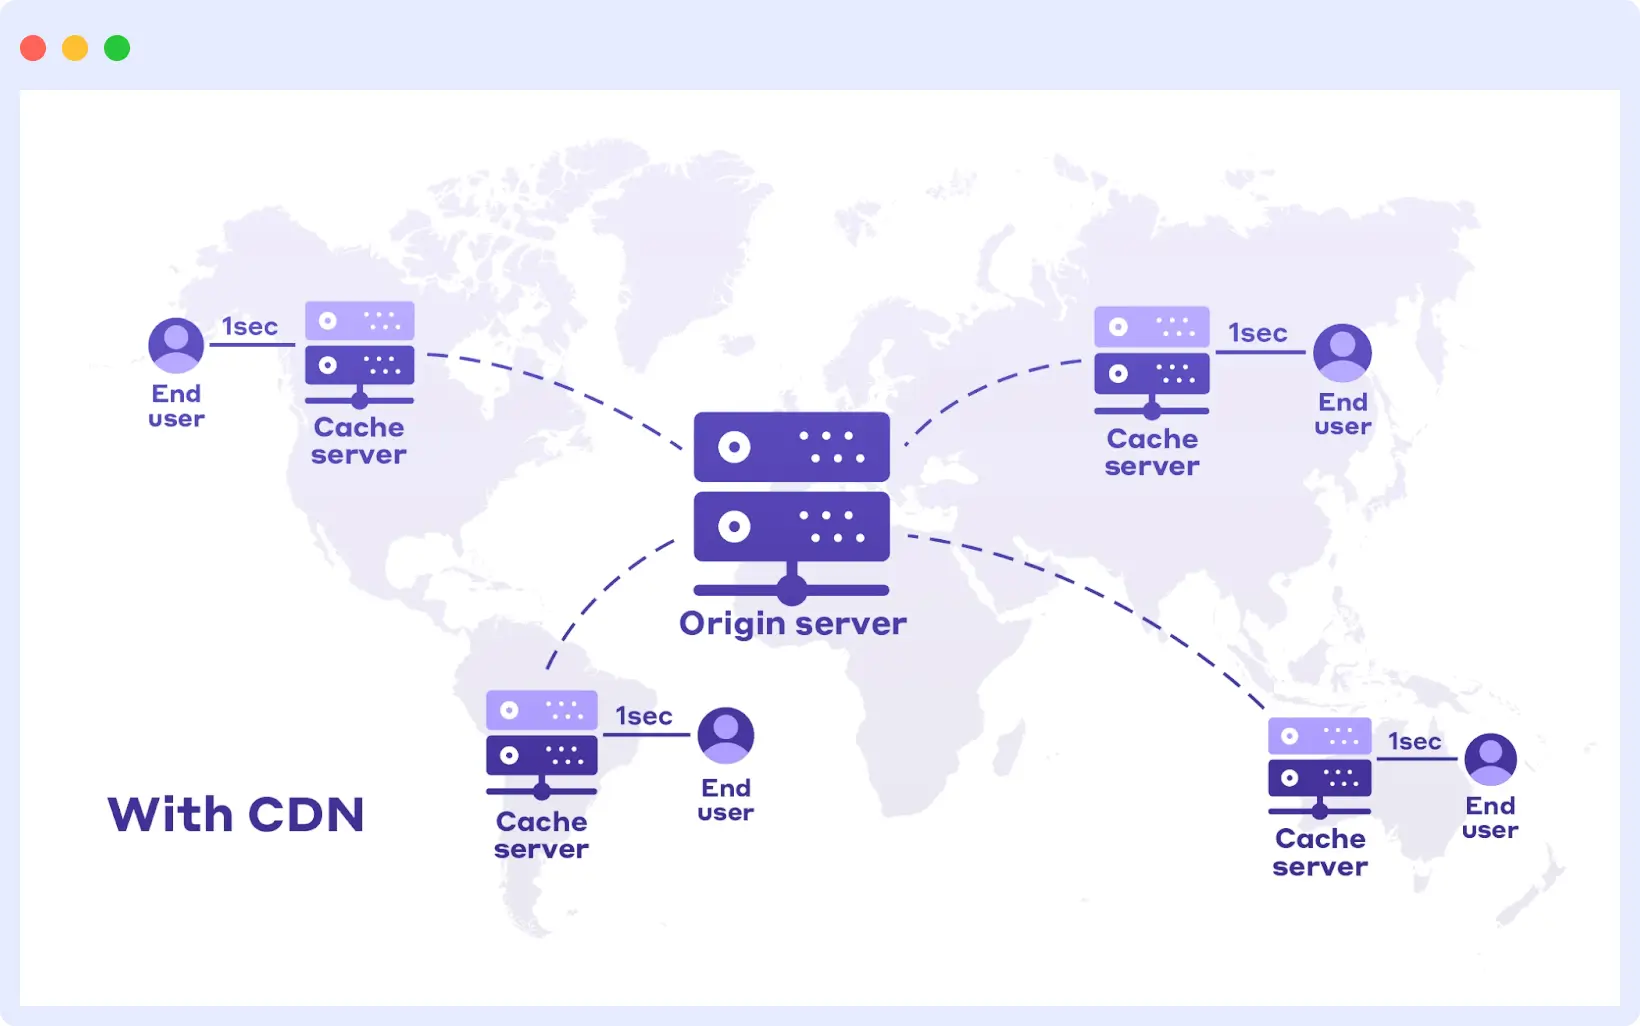
Network latency is the delay that occurs when data travels between a client and a server. It’s a key factor affecting how fast your app feels to users, especially over long distances.
What You’ll Notice
Users experience slow-loading applications, especially when waiting for server data to load.
What’s Actually Causing It
- Serving users from a single server region, which increases data travel time.
- Poor routing and lack of caching infrastructure.
- Global users connecting to a far-off server (e.g., users in Australia accessing a server in Virginia can face 200–300ms delays).
Here’s an actual example of a user struggling with serving international users without a CDN that impacted their user experience:
“The issue we’re fighting is the high latency and slowness they deal with when using our RMM and PSA tools,”
Remote workers (from another country) facing high latency/slowness issues. Any tips/advice?
byu/ChromeVandium11 inmsp
How to reduce network latency in your application?
- Use a Content Delivery Network (CDN) to serve static assets from the nearest location.
- Optimize routing and reduce the number of network hops.
- Load-balance traffic across geographically distributed regions.
How Middleware Helps
Middleware tracks latency by geography, providing real-time network monitoring and route optimization insights. It flags performance drops across regions and suggests routing or CDN optimizations, helping you deliver faster experiences globally.
Get actionable insights and improve global user experience instantly. Start your free trial – no credit card required.
2. Slow Servers
There may be times when your application experiences more demand or usage than usual, and that’s a good thing unless your servers are unable to handle it. Slow servers can be a common reason why you may experience application performance issues.
What You’ll Notice
If users are experiencing painfully long response times, frequent timeouts, or even complete downtime, your slow servers may be the culprit. This is especially common for E-commerce websites or marketplaces when they’re expecting traffic beyond their usual numbers.
What’s Actually Causing It
- Resource exhaustion: CPU, memory, or disk bottlenecks
- Inefficient backend tasks: Heavy processing, unoptimized code
- Traffic overload on a single server instance without auto-scaling
How to troubleshoot slow server issues?
An effective way to tackle this problem is to distribute the load using load balancing across multiple servers. You can update your server’s configuration and enable to utilize more resources during peak times. Also, when the traffic spikes are unusually high, you can consider scaling your resources horizontally.
How Middleware helps
Middleware alerts you when server CPU or memory utilization breaches thresholds. It identifies slow microservices or endpoints, helping you scale only the bottlenecked areas. You can configure auto-scaling triggers based on Middleware’s insights for peak hours or geographic spikes in traffic.
Middleware’s APM helps you improve server response time by identifying overloaded services, memory spikes, or traffic bursts in real time. Try Middleware Free
3. Database Bottlenecks
Slow-running database queries are often a tough nut to track, since databases lie at the bottom-most layer of your backend processing. By the time you figure out a query is taking longer than expected, you may have cost your company a fortune in revenue.
To avoid this, consider optimizing database performance with monitoring tools that help you catch slow queries early.
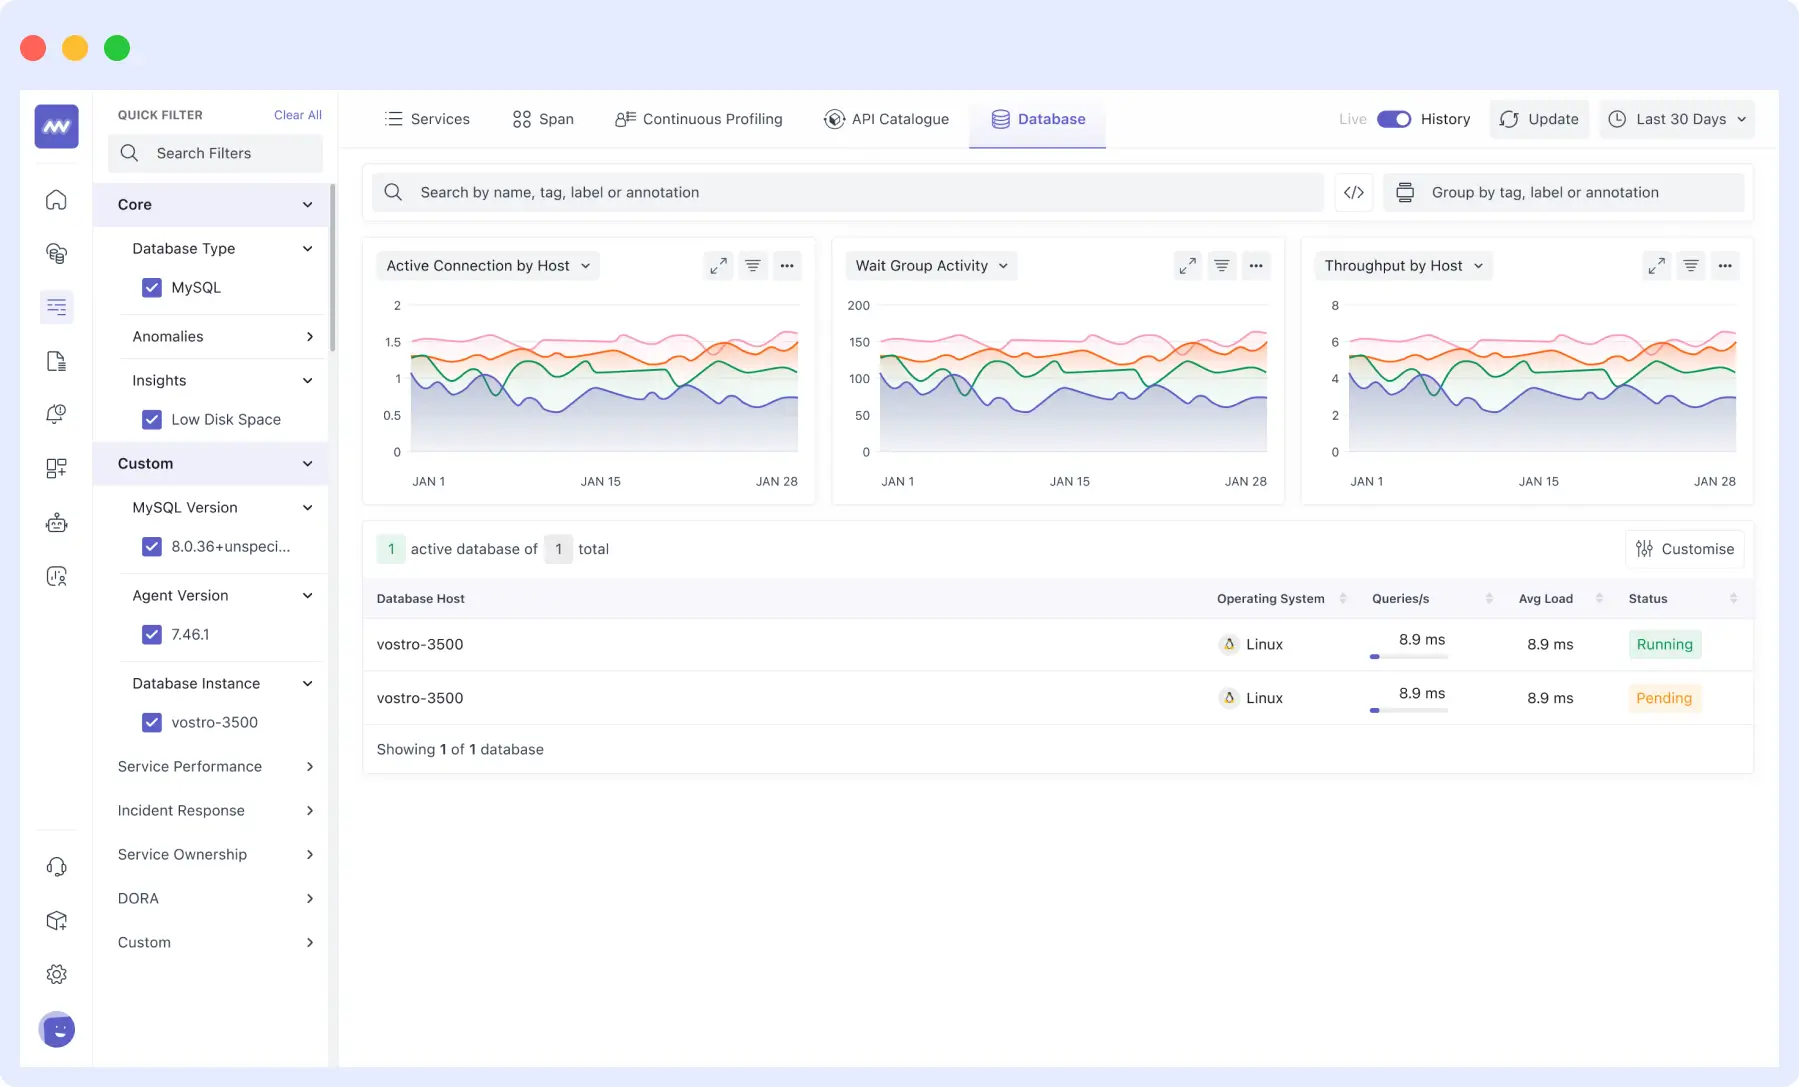
What You’ll Notice
Certain queries or a group of specific queries can take longer to execute, which may cause your application to almost seem like it’s freezing when accessing data.
What’s Actually Causing It
- Poorly written or unoptimized SQL queries
- Missing indexes on frequently queried fields
- Lack of pagination or filtering
- Expensive joins or full table scans
Example: A query that scans an entire table without indexing or filters can easily delay performance and lock up resources.
How to Fix It
- Add proper indexes to critical fields
- Implement pagination and WHERE clauses to limit data scanned
- Use query profiling and optimization tools
- Avoid unnecessary joins or nested queries
How Middleware helps
Middleware offers database-specific monitoring, letting you view slow queries, lock waits, or unindexed queries in real-time. It supports MySQL, PostgreSQL, and other major databases and helps you benchmark performance across staging and production.
4. Inefficient Code
Inefficient code refers to poorly optimized logic that consumes excessive CPU or memory, slows down application response times, and degrades user experience.
What You’ll Notice
A high CPU usage, slow application responses, and slow features that aren’t exciting to use anymore are the most common ways to suspect inefficient code as the culprit behind application performance issues.
What’s Actually Causing It
- Redundant operations or logic
- Use of high-complexity algorithms (e.g.,
O(n²)loops) - Unnecessary computations or poor coding practices
Some common examples of inefficient code include nested loops with O(n²) complexity, which means taking 10 seconds to find common users using the given code:
function findCommonUsers(users1, users2) {
    const common = [];
    for (let user1 of users1) {
        for (let user2 of users2) {
            if (user1.id === user2.id) {
                common.push(user1);
            }
        }
    }
    return common; }
How to detect and refactor inefficient application code?
- Regular code profiling and performance testing
- Use efficient algorithms and data structures
- Refactor code to remove redundancy
- Set clear performance benchmarks in PR reviews
In contrast, here’s how you can do the same task in O(n) time or 0.01 seconds simply using lookup sets:
function findCommonUsers(users1, users2) {
    const ids2 = new Set(users2.map(u => u.id));
    return users1.filter(user => ids2.has(user.id));
How Middleware helps
Middleware’s Application Performance Monitoring (APM) lets you trace code-level bottlenecks down to the function or line number. It helps pinpoint inefficient logic or hot paths and recommends optimization areas using historical trends.
Pinpoint inefficient loops, logic, and memory churn using Middleware’s real-time insights.
→ Get real visibility
5. Memory Leak
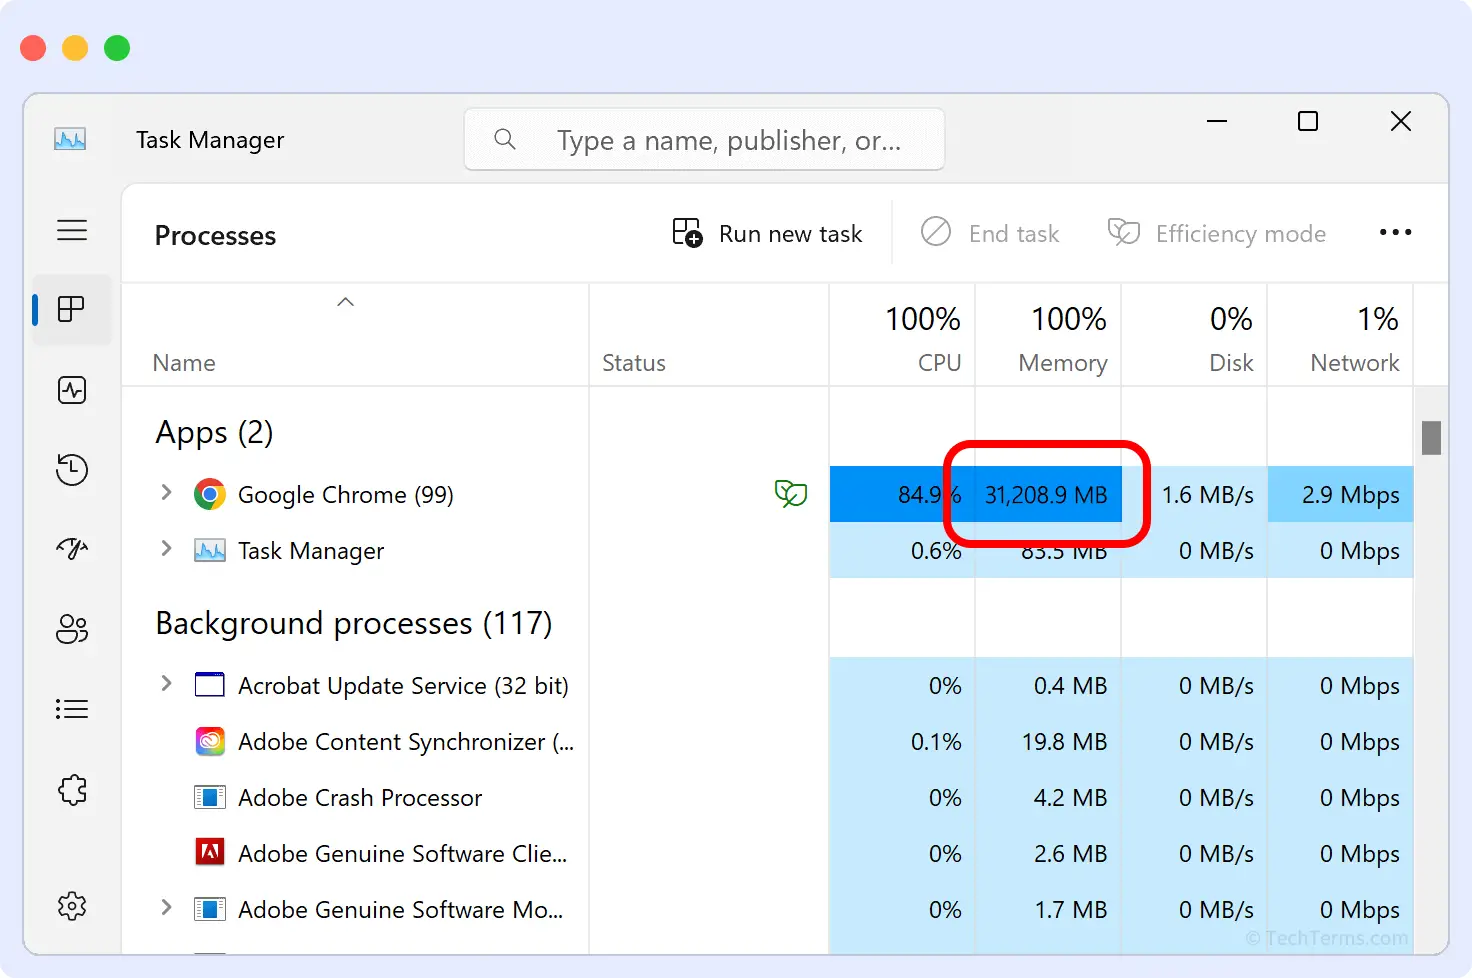
Memory leaks occur when applications allocate memory that is never released, leading to a gradual increase in memory usage until the app slows down or crashes.
What You’ll Notice
They can show their presence when an application unexpectedly crashes, even though it appeared to be working fine just a few minutes ago. You can also detect them through the task manager if an application or a browser is consuming way more memory than expected.
What’s Actually Causing It
- Unreleased object references in code
- Event listeners not cleaned up (e.g., in React components)
- Long-running JavaScript timers or closures
- Improper use of global variables or circular references
Example: A React component adds a window event listener but forgets to remove it on componentWillUnmount, leading to a persistent reference and memory bloat.
How to identify and fix memory leaks in your application?
- Regular memory profiling in development and production
- Fine-tune garbage collection settings
- Follow cleanup best practices in frontend frameworks
- Watch for browser console warnings related to memory
How Middleware helps
Middleware detects unusual memory usage spikes and helps you identify leaks early. Its real-time memory profiling and alerting features ensure you catch and resolve memory issues before they bring your app down.
Catch memory spikes before they crash your app. Try Middleware free – no setup friction
6. Misconfigurations
What You’ll Notice
Misconfigurations occur when incorrect environment or system settings break expected application behavior often due to manual errors or missing variables.
What’s Actually Causing It
- Incorrect API keys or environment variables
- Wrong database URIs, ports, or credentials
- Missing or mismatched CORS or domain configurations
- Version mismatches between staging and production
Example: An app in production accidentally uses a sandbox payment key, making real transactions impossible costing you both revenue and trust.
How to avoid and resolve common configuration mistakes?
- Perform regular configuration audits
- Use .env files and secrets management for sensitive values
- Automate environment checks in CI/CD pipelines
- Standardize environment variables and document expected values clearly
How Middleware helps
Middleware detects configuration drift between environments like staging, dev, and prod. It sends alerts for missing API keys, invalid domain whitelisting, and more reducing the impact of human errors.
7. Third-party dependencies
Modern apps rely heavily on third-party services from payment processors and CRMs to analytics and email APIs. These external tools accelerate development but can become invisible performance bottlenecks or points of failure if not monitored.
What You’ll Notice
Imagine an external payment processing API going down during peak shopping hours – the worst nightmare you could have possibly imagined. If you’ve heard of the infamous npm left-pad incident, you’re probably already extremely cautious of using open-source packages without auditing them.
Third-party dependencies bring their application performance issues, and the easiest way to spot them is through warning signs in your development environment. They may also surface by breaking a specific feature of your application that you could swear was working fine before you updated a dependency in your application.
What’s Actually Causing It
- Deprecation or instability in third-party libraries
- Dependency updates introducing breaking changes
- Rate-limiting, outages, or performance degradation from external services
- Over-reliance without fallbacks or graceful degradation mechanisms
Example: If your email provider’s API has a timeout spike during Black Friday promotions, your transactional flows may silently fail, hurting both conversion and trust.
How to Fix It
- Monitor and audit all critical third-party services regularly
- Use semantic versioning and lock dependency versions where possible
- Set up fallbacks and retry mechanisms for essential API calls
- Add performance SLOs (Service Level Objectives) around key integrations
How Middleware helps
Middleware monitors the performance, availability, and latency of third-party services (like payment gateways, CRMs, or auth providers). It alerts you instantly if an integration fails or underperforms, so you can switch to a fallback or fix the issue before users notice.
8. Oversized Assets
What You’ll Notice
Slow rendering pages, especially on mobile devices, can be detrimental to your company and business. The first time your website opens takes way too long to load, and your users constantly complain how hard it is for them to access your application on an older device or slower internet connections.
What’s Actually Causing It
- Uncompressed or high-resolution images (e.g., 20MB+ product images)
- Synchronously loaded CSS/JS files blocking the main thread
- Bloated libraries or unnecessary client-side dependencies
- No lazy loading or progressive enhancement practices
How to Fix It
- Compress and optimize all static assets (images, fonts, videos, scripts)
- Implement lazy loading and tree shaking for JavaScript
- Use responsive images (
<picture>tag orsrcset) - Set cache headers and use CDNs for global asset delivery
- Regularly audit bundles using tools like Lighthouse, Webpack Bundle Analyzer, or Middleware
How Middleware helps
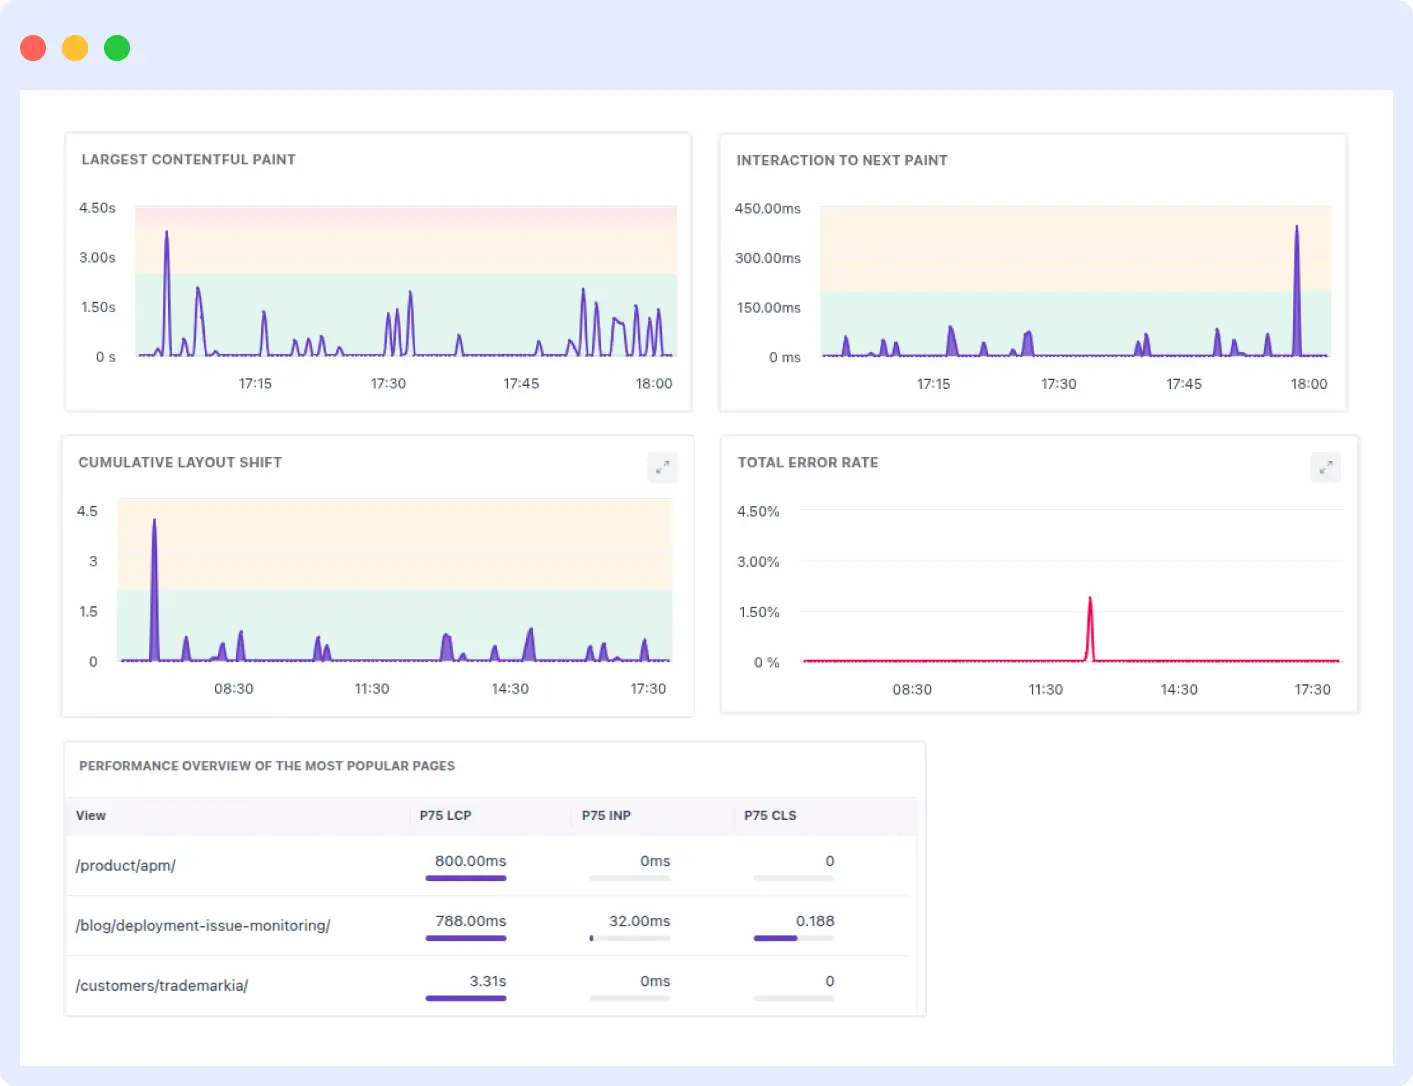
Middleware automatically monitors your frontend performance using Core Web Vitals like Largest Contentful Paint (LCP) and First Input Delay (FID). You’ll get real-time insights into which assets are slowing you down and actionable suggestions to optimize your load times.
9. Ineffective Caching
We discussed earlier how caching can help improve your network latency. However, some considerations need to be followed to make sure an effective caching mechanism enhances your application’s performance.
What You’ll Notice
I’ve enabled caching on my server, why do users still have to wait so long to see the data? Despite having a caching system set up, you may still encounter application performance issues due to network latency. Though they may not be that apparent and or intense, their still likely to cause a slow and laggy experience for your users.
What’s Actually Causing It
- Missing or incorrect cache headers.
- Caching dynamic content without proper invalidation.
- Using default expiration times that don’t align with how frequently your data changes.
How to implement proper caching strategies to improve speed?
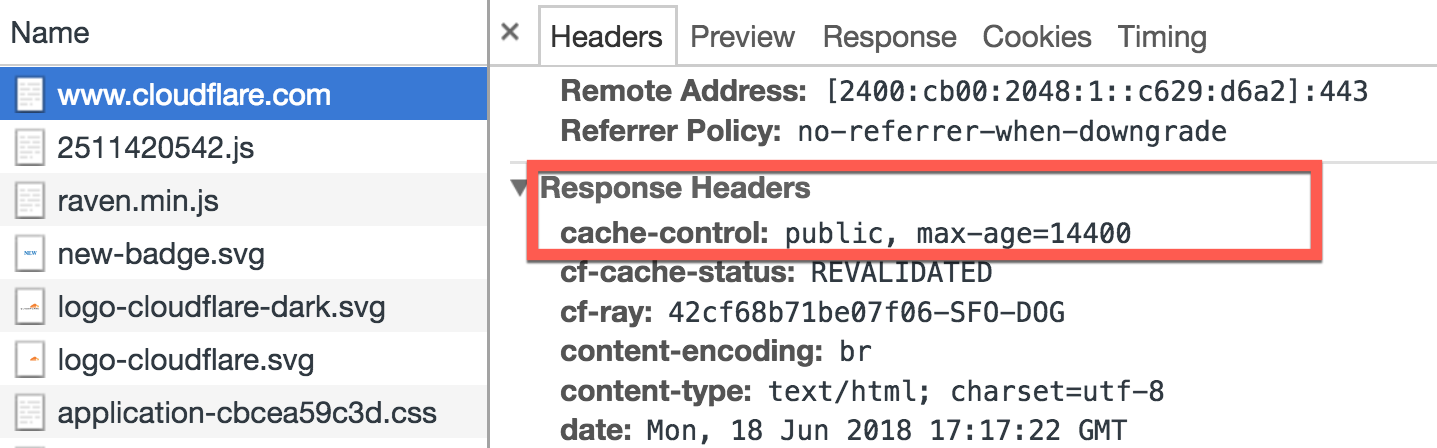
For instance, you can implement proper cache headers as shown below:
  res.set({
    'Cache-Control': 'public, max-age=60', // Browser cache for 1 minute
    'ETag': generateETag(user),
    'Last-Modified': user.updatedAt
  });

  res.json(user);
});
At times, multiple levels of caching, like a browser level, database level and application level, can also enhance your caching mechanism overall and lead to a smooth user experience, mitigating significant performance downsides for your users.
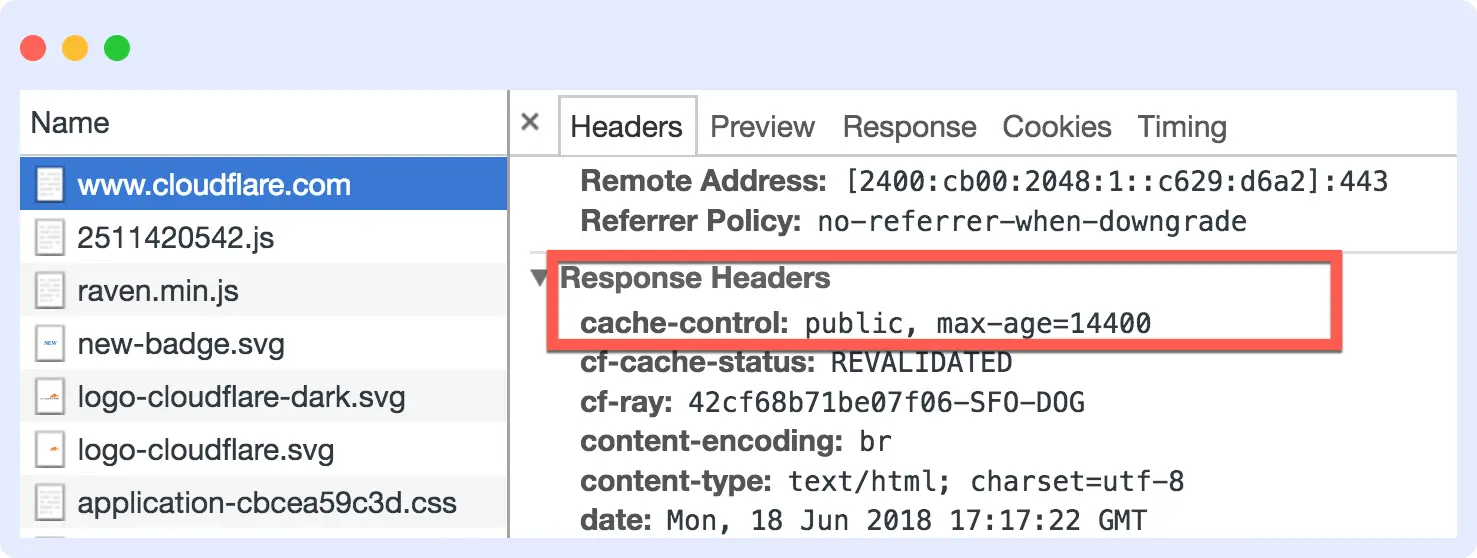
Here’s a cache for your static assets for 1 year when you know they aren’t going to change much soon:
app.use('/static', express.static('public', {
  maxAge: '1y', // Cache static assets for 1 year
  etag: true,
  lastModified: true
}));
10. Heavy Client-side Processing
We’ve already seen how an oversized initial asset can be attributed to large JavaScript bundles. However, JavaScript isn’t just unwrapped on the first go – it loads as and when your application requires it.
What You’ll Notice
- Laggy user interfaces during complex operations (e.g. real-time collaboration tools).
- Choppy animations, transitions, or scrolling on older devices.
- UI “jank” even without animations, due to poor JavaScript execution or heavy rendering logic.
What’s Actually Causing It
- Processing large datasets directly in the browser.
- Synchronous or blocking operations that freeze the UI.
- Lack of virtualization or batching for DOM updates.
- Inefficient handling of user interactions, updates, or re-renders.
How to Fix It
- Offload complex logic to the backend wherever possible.
- Use Web Workers for compute-heavy operations that can’t be avoided client-side.
- Implement list virtualization (e.g.,
react-window,react-virtualized) for large datasets. - Break up large tasks into non-blocking chunks using
requestIdleCallbackorsetTimeout. - Adopt
async/awaitand Promises to keep the main thread free.
How Middleware helps
Middleware lets you track slow rendering paths and heavy scripts using frontend performance dashboards. It identifies lag sources on specific devices or browser versions.
11. Poor API Design
Earlier in the lifecycle of a software product or application, API designs are often deemphasized and de-prioritized. This gives teams and developers the speed to ship features fast.
What You’ll Notice
As developers and teams continue to build on top of an outdated or unreliable API design, it starts causing application performance issues. This is because when the requirements of an API change, a lot of earlier assumptions and constraints also change.
Other times, a poor API design may also be attributed to not properly using the appropriate status codes or versioning your APIs.
Let’s say you built a simple endpoint to fetch user data. As your application evolved and got more complex, you started having more data in your user records or tables, but the old endpoint simply runs a query on a specific data collection or table and returns all data points.
What’s Actually Causing It
- Lack of planning or foresight in API architecture.
- APIs not updated to reflect new use cases or data models.
- Inadequate use of REST principles (e.g., improper status codes, poor resource structure).
- Missing support for filtering, pagination, or versioning.
How to Fix It
- Prioritize clean, consistent API design even at MVP stage.
- Review and refactor outdated APIs periodically, especially after major database or feature changes.
- Adopt pagination, filtering, and proper HTTP status codes as defaults.
- Use GraphQL or tools like tRPC to prevent over-fetching and improve flexibility.
- Document your APIs clearly so they scale with your teams and third-party users.
How Middleware helps
Middleware tracks API latency and response sizes. It flags endpoints that return excessive payloads or respond too slowly and offers actionable suggestions for improving API performance.
12. Concurrency Issues
Concurrency issues are another tricky rat to catch. However, they’re easy to spot in action. They often show up in production when multiple operations clash at the same time leading to unpredictable behavior.
What You’ll Notice
Application unexpectedly crashing, data being inconsistent in your database, or bugs that mysteriously go away on a page reload can be symptoms of concurrency issues.
What’s Actually Causing It
- Race conditions due to improper variable access
- Deadlocks when two processes wait on each other indefinitely
- Shared resources accessed without synchronization
- Thread pool exhaustion in high-concurrency environments
How to detect and handle concurrency problems in your code?
- Use thread-safe data structures and implement synchronization mechanisms
- Lock shared resources carefully (and release them reliably)
- Design idempotent APIs that safely handle repeated or overlapping calls
- Perform load testing and concurrency simulations pre-production
- Use atomic operations and background queues where needed
How Middleware helps
Middleware tracks race conditions, thread pool exhaustion, and database deadlocks. It gives detailed traces to identify exact operations that conflict under concurrency pressure.
13. Inefficient Logging
What You’ll Notice
Sometimes developers log every single variable and condition after every line of code. It’s almost harmless in development, but can be disastrous in production. Everything is just the way it should be, but you’re shipping a ton of logs with your application, and all of a sudden, you see jittery or laggy behavior.
Sometimes the application becomes slow to use at certain places, and it some interactions take unnecessarily long to perform. These may be signs of one of the most overlooked application performance issues – inefficient logging.
What’s Actually Causing It
- Verbose logging in production environments
- Synchronous logging blocking I/O operations
- Logging of large payloads or full SQL queries
- No log-level filtering (everything logged as
infoordebug) - No log rotation or cleanup strategy
How to reduce excessive logging that impacts app performance?
- Avoid logging unnecessary variables or stack traces
- Implement log-level controls (
debug,info,warn,error) - Use asynchronous logging wherever possible
- Add a toggle or environment variable to disable verbose logs in production
- Regularly audit your logs and set up alerts for abnormal log volume
How Middleware helps
Middleware provides log noise filtering and alerts you when log volume spikes unexpectedly. This prevents disk saturation and pinpoints the exact logs causing delays.
14. Monitoring Gaps
You’ve optimized everything but without observability, you’re flying blind.
What You’ll Notice
- Sluggish mobile pages go unnoticed until users bounce
- Customers experience issues devs can’t replicate
- Sudden traffic dips, slow APIs, or errors with no clear root cause
- Debugging becomes guesswork instead of data-backed action
Here’s a frustrated developer trying to narrow down the root cause of slow API calls, something that a monitoring tool can easily solve for you:
Application latency troubleshooting
byu/ozone007 innetworking
“We have web application deployed in cloud and having issues randomly api request problem is that it’s taking more then 750 ms… how can we troubleshoot hop by hop latency…”
What’s Actually Causing It
- Relying solely on manual checks or user complaints to detect issues.
- Only monitoring one layer (e.g., backend), while frontend, database, or infrastructure issues go unnoticed.
- Delayed detection of critical issues due to absence of alerting systems.
- Using legacy or separate tools that don’t offer centralized, correlated insights.
- Missing out on real-world performance data from actual users and devices.
- Inability to simulate and test user journeys proactively.
- Teams can’t act on insights if data isn’t clearly surfaced in usable dashboards.
How to close monitoring gaps and proactively catch performance issues?
- Real-time alerting on performance regressions
- Dashboards tracking frontend, backend, DB, and infrastructure health
- Baseline metrics to detect anomalies early
- User-centric monitoring (RUM + Synthetic) to capture real-world experience
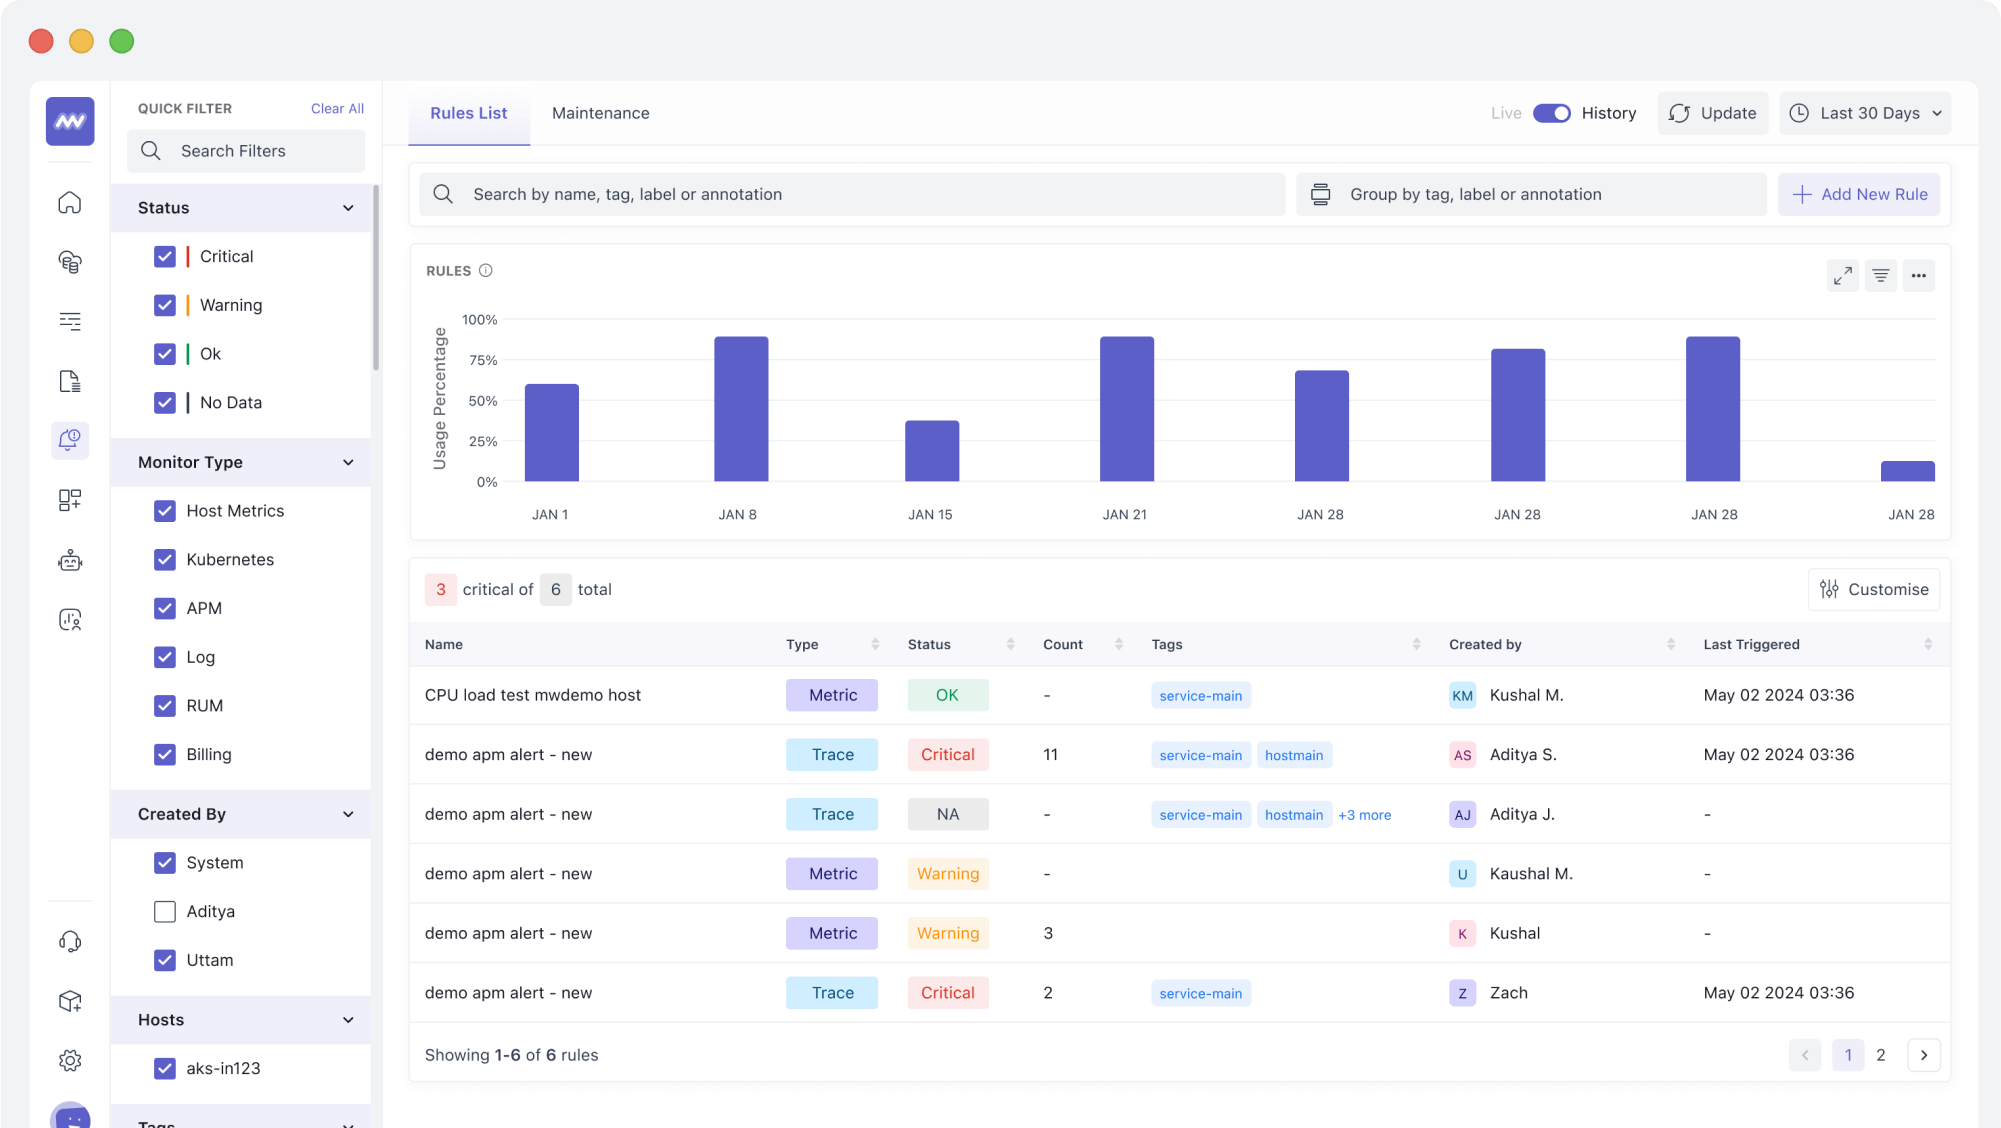
How Middleware helps
Middleware offers real-time dashboards, alerts, and APM for frontend, backend, database, and infrastructure covering every blind spot and keeping your app under continuous watch.
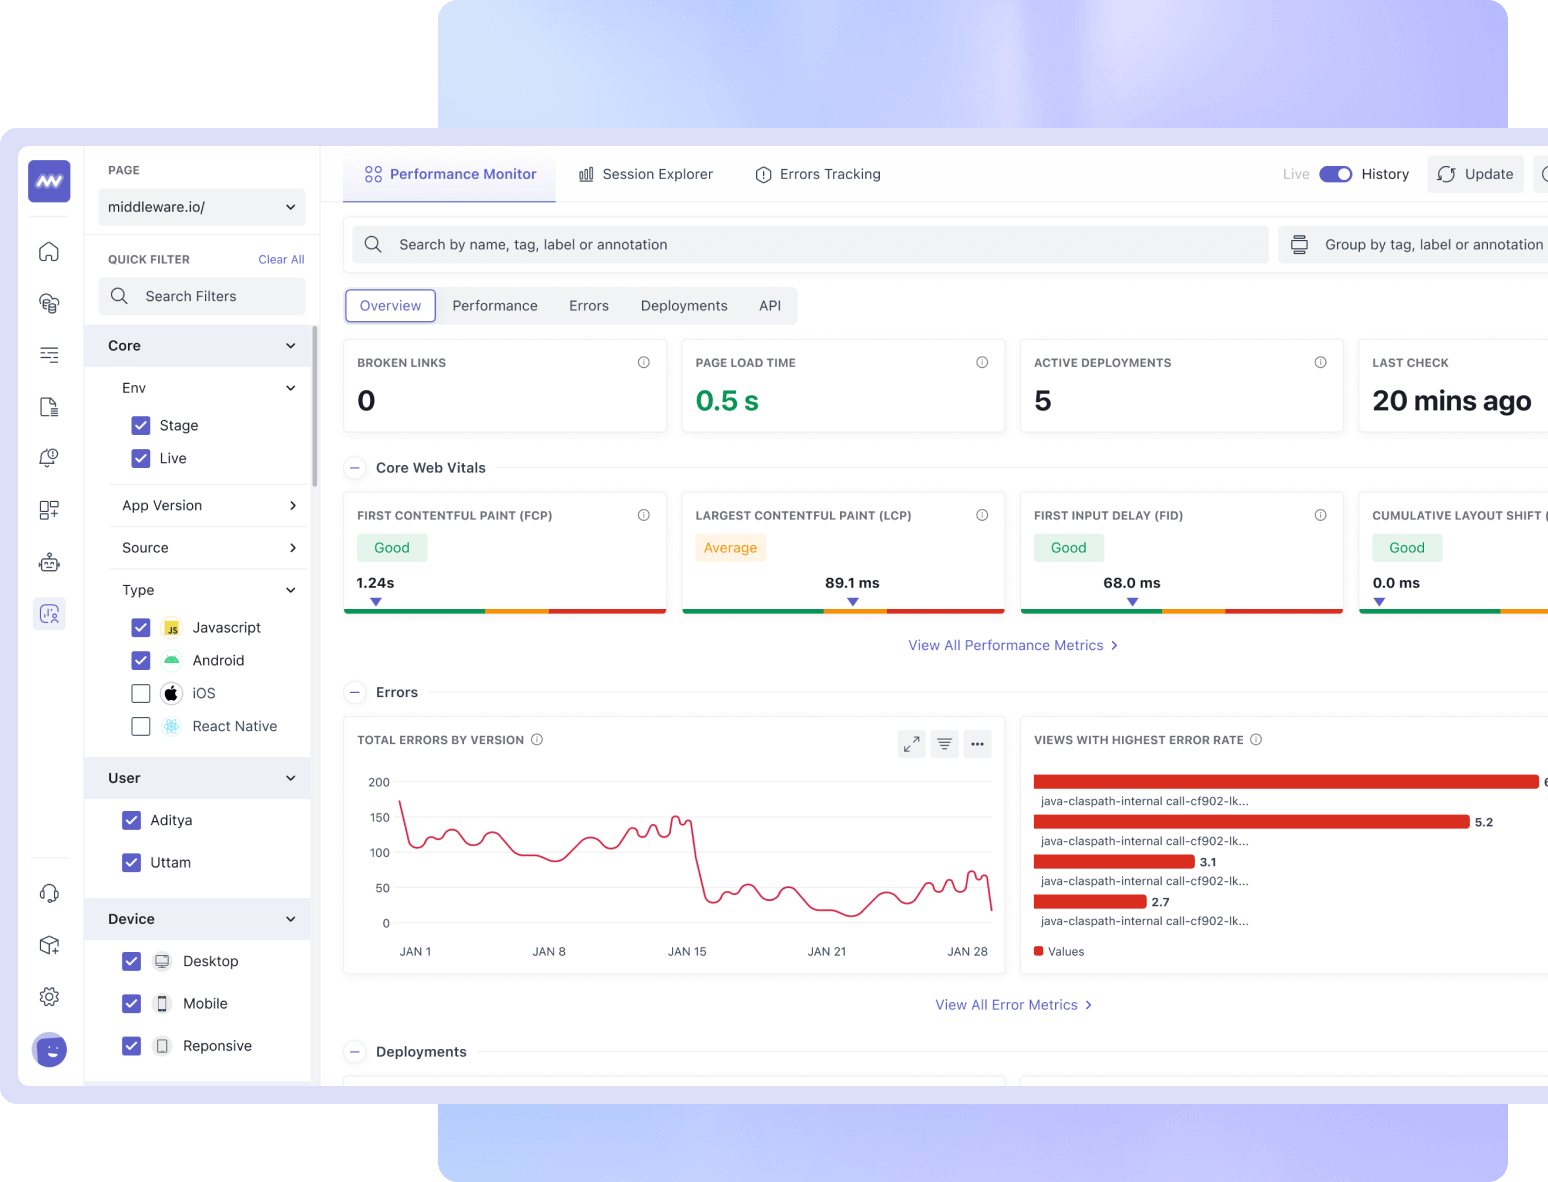
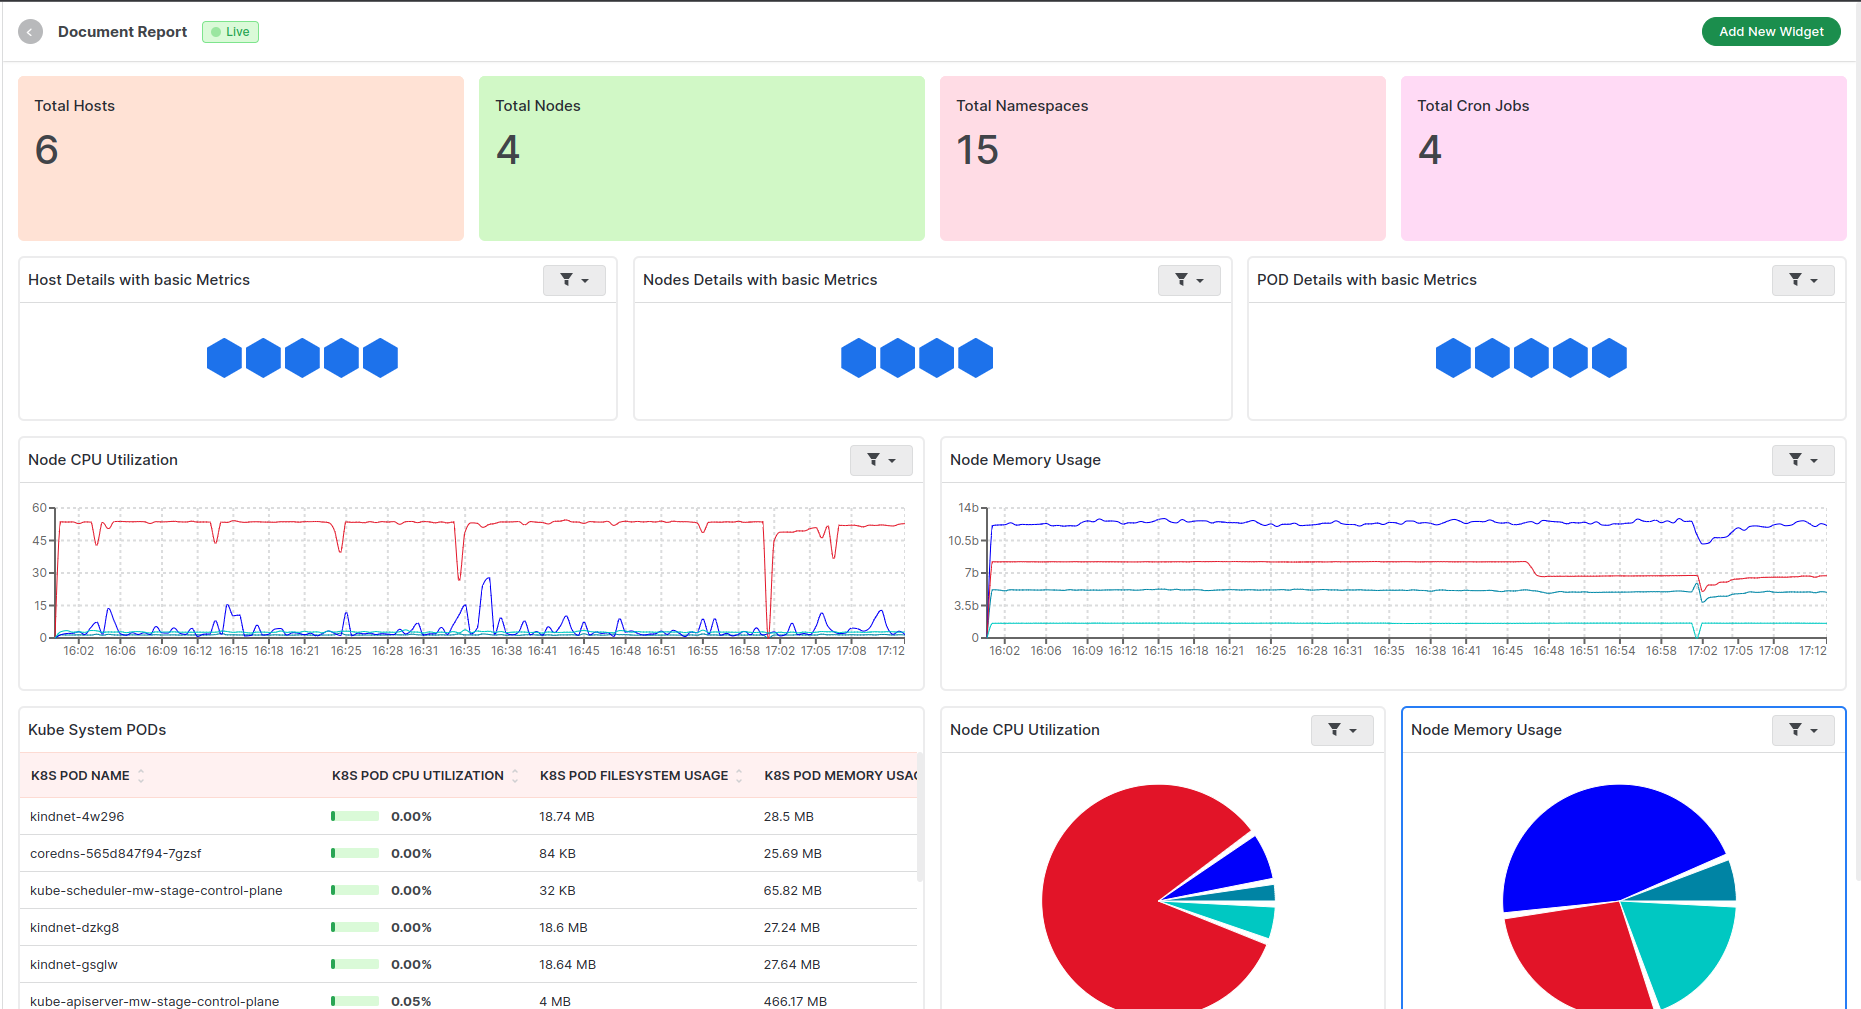
Implementing Monitoring and Alerting with Middleware
Middleware is a powerful modern observability tool that can help you monitor your application effectively and, in turn, mitigate these application performance issues. You can configure alerts to notify whenever an application performance metric goes down.
Understanding how your application performs in real-time can truly elevate how you can optimize the end-user experience on the fly. Moreover, you get dedicated database, infrastructure and user experience monitoring to tackle performance issues across a wide spectrum of categories.
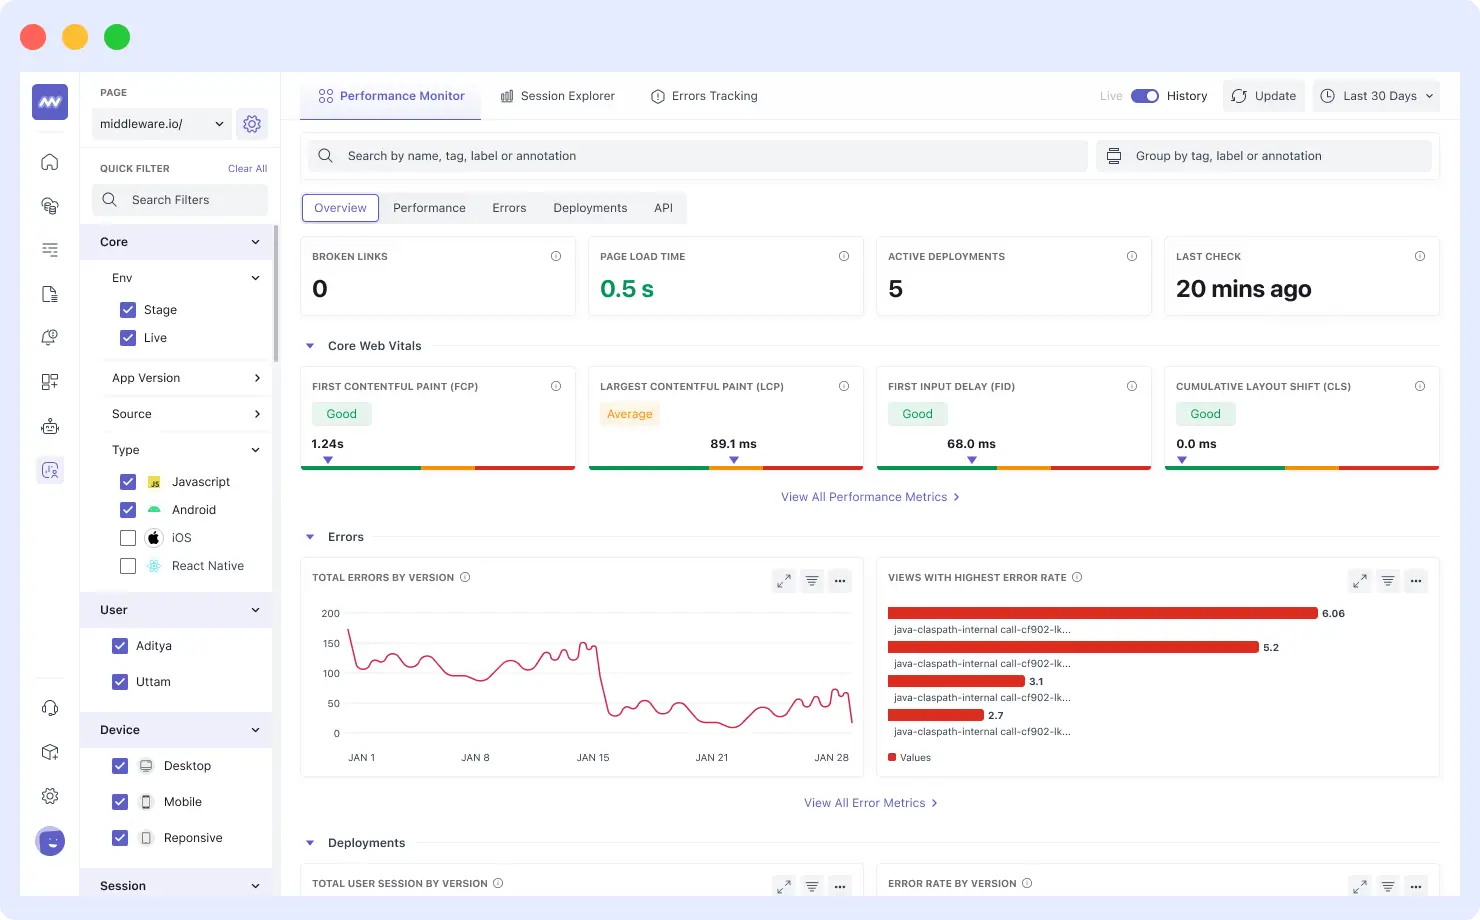
Its interactive dashboard can also help you discover patterns that can be flagged early so you can take relevant actions to prevent these patterns from becoming an actual performance issue.
Conclusion
Application performance isn’t a one-time thing, it’s a continuous investment that reaps big returns. You can start small, but focus on being proactive and consistent, not neglecting performance issues, is a habit that can go a long way. With a great monitoring tool under your belt, you can make sure your application performs well in all circumstances, and if it doesn’t, you can fetch everything from your arsenal to fight it.
Catching issues before users feel them is the kind of habit that builds fast, resilient applications.
And the best part? You don’t have to do it alone.


