In the high-stakes environment of Black Friday, e-commerce platforms encounter intense traffic surges that can heavily strain system performance. For example, during Black Friday 2023, online sales soared to $9.8 billion, a 7.5% increase from the previous year, highlighting the substantial pressure placed on digital infrastructures.
Despite these gains, some retailers experienced website outages, underscoring the critical need for reliable platform engineering practices that prioritize valuable feedback from internal customers.
A key strategy to mitigate such risks is integrating observability into platform engineering. Observability offers real-time insights into system behavior, allowing teams to proactively identify and address issues before they affect users. By adopting observability, platform engineering teams can improve system resilience, sustain uninterrupted user experiences during peak events, and uphold operational stability.
This article examines how observability elevates platform engineering by tackling complex challenges, refining workflows, and fortifying system reliability.
Understanding Platform Engineering
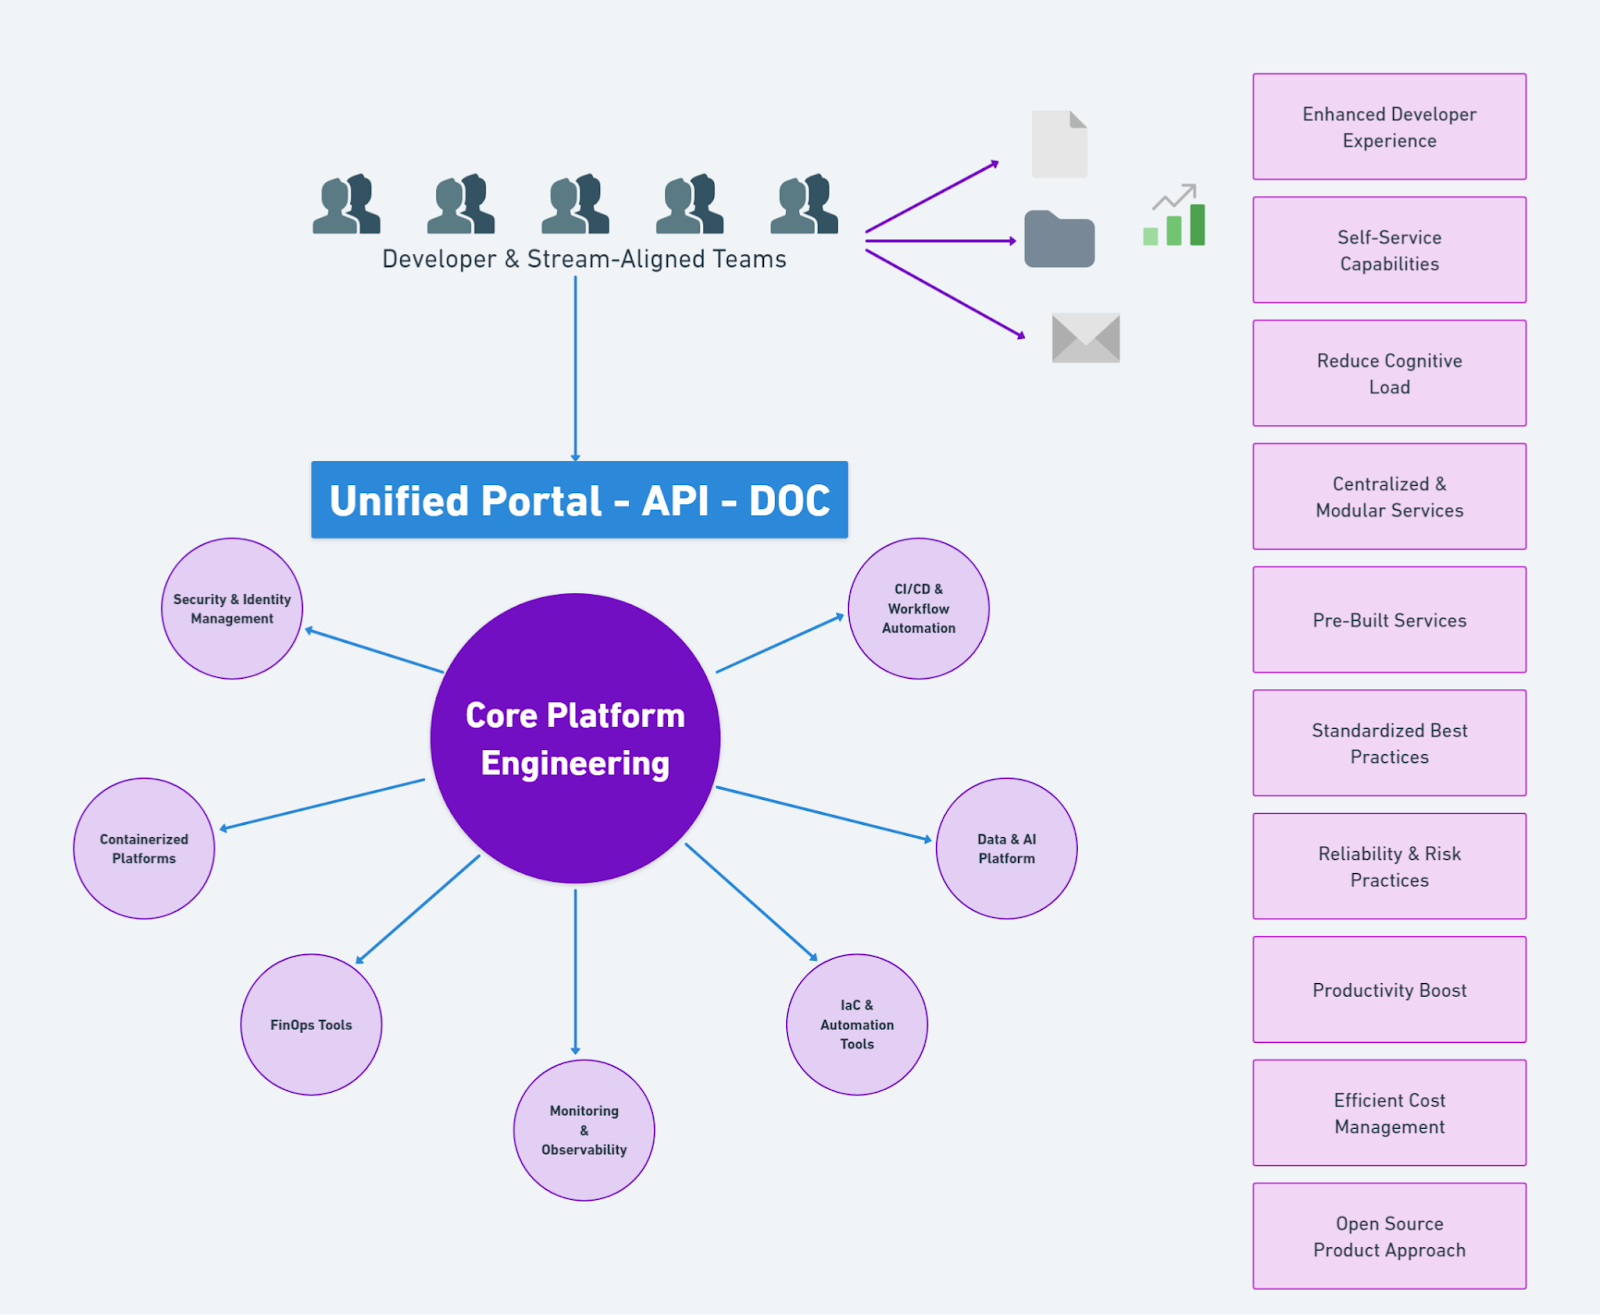
Platform engineering is about creating a stable, scalable foundation that meets the needs of development and operations teams. Rather than just managing infrastructure, it involves building shared tools, environments, and workflows to improve collaboration and minimize operational friction for development teams. By providing a standardized platform, platform engineering enables faster, consistent application deployment and allows engineers to focus on development without being weighed down by infrastructure complexities.
Roles within platform engineering, such as release engineers, tooling engineers, and infrastructure architects, work together to ensure smooth deployments, maintain tool efficiency, and design scalable infrastructure, all critical for a cohesive platform engineering strategy.
Complexities
Modern infrastructure is increasingly complex and continuously evolving, posing significant cognitive load and challenges for engineers. This complexity stems from the need for various tools and frameworks, such as Kubernetes for container orchestration, Helm for application deployment, Terraform for infrastructure as code, and specialized monitoring systems. These tools, while powerful, must work in harmony, which requires careful planning and configuration.

Platform engineering addresses these complexities by establishing a cohesive, scalable foundation, yet it must navigate several critical factors:
- Distributed systems: As applications scale, they frequently extend across multiple servers, cloud providers, or regions, forming a complex interconnected network. Reliable communication among these services is important, as even minor disruptions can ripple across the entire system.
- Microservices: Breaking applications into smaller, independent services offers flexibility but introduces challenges like dependency management, version control, and service discovery to ensure each microservice connects smoothly with others.
- Real-time data flow: Many applications rely on real-time data processing for analytics, user interactions, or insights. Handling these data streams efficiently requires infrastructure that can maintain high throughput with minimal latency.
For example, scaling a service during peak demand, such as an e-commerce sale, requires not only a reliable infrastructure but also automation and monitoring to dynamically adjust resources and prevent bottlenecks in real time.
Infrastructure management
In platform engineering, effective infrastructure management is key to sustaining a reliable and scalable environment that supports both development and operations. Through efficient deployment, monitoring, and management of infrastructure, platform engineers establish a solid foundation that adapts to changing demands and improves application performance. Additionally, these practices enable developer self-service by providing integrated tools and workflows that empower developers to manage their applications autonomously.
This involves:
- Automating deployments to ensure consistent and rapid releases, minimizing errors.
- Monitoring performance across key metrics to detect and resolve issues before they affect users.
- Scaling resources dynamically based on demand, managing costs while ensuring system readiness during peak times.
Together, these infrastructure management practices support platform engineering’s core goal: building a resilient environment that enables teams to deliver applications efficiently and reliably.
Platform Engineering vs. DevOps vs. Site Reliability Engineering (SRE)
While platform engineering, DevOps, and Site Reliability Engineering (SRE) all contribute to improving software delivery, each focuses on distinct aspects of the process:
- Platform engineering: Focused on building and maintaining the core infrastructure and tools, platform engineering creates a scalable foundation for development and operations. A platform engineer provides self-service tools and environments, reducing friction and enabling teams to build, test, and deploy efficiently.
- DevOps: DevOps is a cultural approach that promotes collaboration between development and operations. It aims to optimize workflows, automate processes, and improve delivery speed through practices like CI/CD, fostering alignment across teams for faster, more reliable releases.
- Site reliability engineering (SRE): Developed at Google, SRE applies engineering principles to operations, focusing on balancing reliability and release velocity. SREs set and maintain service-level objectives (SLOs), manage incident response, and use error budgeting to keep services reliable while supporting a stable release pace.
Why Observability is Needed in Platform Engineering
Beyond traditional monitoring
Traditional monitoring focuses on tracking known metrics, setting alert thresholds, and responding to specific issues as they arise. This makes it largely reactive and useful for catching immediate problems like high CPU usage or memory consumption. However, monitoring’s limitations become evident when dealing with the intricate, interdependent systems found in modern infrastructure, where isolated metrics rarely reveal the full picture.
Observability, by contrast, is dynamic and proactive, giving platform engineering teams and software developers a holistic view of system interactions. Instead of flagging individual metrics, observability enables engineers to query and explore data across services, providing insights into relationships and dependencies that monitoring alone might miss. This expanded visibility allows teams to troubleshoot complex issues more effectively, ensuring that all system components work together smoothly and stably.
Real-world use cases
In a microservices architecture, where applications are built from many interdependent services, a slowdown or failure in one component can cascade across the system.
For example, monitoring might highlight general latency in user-facing features, but observability tools can trace the source of the slowdown to a specific service. By examining traces, metrics, and logs, platform engineers can pinpoint precisely where the latency originates, whether it’s a slow database query or an overloaded API.
Consider these use cases:
- Latency detection in distributed systems: Observability traces can help track the path of a user request, identifying exactly where delays occur within the sequence of services. If a payment service is causing delays in the checkout process, observability will help pinpoint that bottleneck, while traditional monitoring might only indicate increased latency without context.
- Root cause analysis across services: In complex architectures, a failure in one microservice might impact several downstream services. Observability connects the dots, showing how errors propagate through the system and allowing platform engineers to trace the issue to a specific API call, third-party integration, or configuration change rather than treating symptoms across multiple services.
- Proactive anomaly detection: Observability also enables early detection of performance issues by identifying subtle changes, such as a gradual increase in response times or error rates. By recognizing these early indicators, platform engineers can take corrective action before an incident escalates, preserving system stability and user experience.
Through observability, platform engineering teams can maintain not only a responsive but also a resilient platform. They gain the depth needed to identify, address, and prevent issues, increasing overall system reliability while supporting the smooth operation of critical applications.
The three pillars of Observability
Observability relies on three foundational components, often called the “pillars” of observability, which together offer a comprehensive view of system health and performance:
- Metrics: Metrics are quantitative data points that track the performance of key resources, such as CPU usage, memory consumption, or request rates. Metrics provide real-time indicators of system health, helping engineers identify trends and respond quickly to any abnormalities.
- Logs: Logs are detailed records of events across the system. They capture a chronological account of actions, errors, and system warnings, providing context for when, where, and how specific events occurred. Logs are invaluable for tracing issues back to their source, as they offer precise, timestamped information about the system’s state.
- Traces: Traces follow the lifecycle of a request as it travels through different components of a system, from start to finish. They offer a visual map of each service or function the request interacts with, pinpointing where delays or errors might occur. Tracing is particularly useful for diagnosing issues in distributed systems, as it reveals how different services interact and where bottlenecks might lie.
The platform engineering team plays a crucial role in implementing these three pillars, allowing teams to gain an in-depth view of system operations enabling them to understand both individual components and their interactions within the broader infrastructure.
Proactive issue resolution
One of the most significant advantages of observability is the ability to detect potential issues before they impact users proactively. Unlike traditional monitoring, which often alerts teams after an issue has occurred, observability enables engineers to identify patterns and anomalies early.
By tracking unusual behaviors or shifts in metrics, logs, or traces, teams can respond to signs of potential failures in real time, addressing issues before they escalate.
This proactive approach improves system resilience, optimizes workflows, and ultimately helps maintain a smooth user experience by reducing downtime and preventing disruptions. Initiating the platform engineering journey by engaging with engineering teams to identify bottlenecks and developer frustrations is crucial for continuous improvement.
Challenges Observability solves for Platform Engineers
Managing complexity
With systems becoming increasingly distributed, internal platform teams play a crucial role in maintaining a clear overview. Observability provides the necessary visibility to understand how different components interact and where issues may arise.
Reducing MTTD and MTTR
Reducing Mean Time to Detect (MTTD) and Mean Time to Resolution (MTTR) is critical for minimizing downtime and improving user experience. A platform team plays a crucial role in these efforts by making operations easy and improving collaboration among different tech teams. Observability lowers MTTD by continuously monitoring for anomalies, enabling engineers to catch issues as they emerge. Once a problem is detected, observability tools provide detailed, actionable insights that accelerate MTTR. With relevant data readily available, teams can efficiently assess issue severity, identify impacted areas, and implement solutions.
For more on the benefits of reduced MTTD and MTTR, see MTTR vs MTTD and How to Reduce MTTR.
Faster triage and root cause analysis
When issues arise, the ability to quickly diagnose and resolve them is crucial. Observability facilitates faster triage by correlating data from metrics, logs, and traces, giving engineers a comprehensive view of what happened, when, and why.
With these insights, engineers can delve into specific events to identify the root cause, whether it’s a failing API, resource bottleneck, or misconfigured service. This efficient diagnostic approach leads to quicker resolutions and contributes to a more stable and resilient system.
The platform engineering team binds various tools, services, and APIs into a cohesive internal developer platform, creating well-organized processes that strengthen developer autonomy and efficiency.
Building an Observability Framework for Platform Engineers
Building blocks
Effective observability in platform engineering revolves around three main components: logging, metrics, and tracing. Internal developer platforms (IDPs) play a crucial role in facilitating these components by organizing workflows and providing tools that make software development complexities easy. Together, these elements provide a holistic view of system performance and health, enabling engineers to monitor, diagnose, and improve infrastructure more effectively.
Top Tools
Various tools in the industry make implementing observability practical and efficient, often managed by internal platform teams. Some of the most popular tools include:
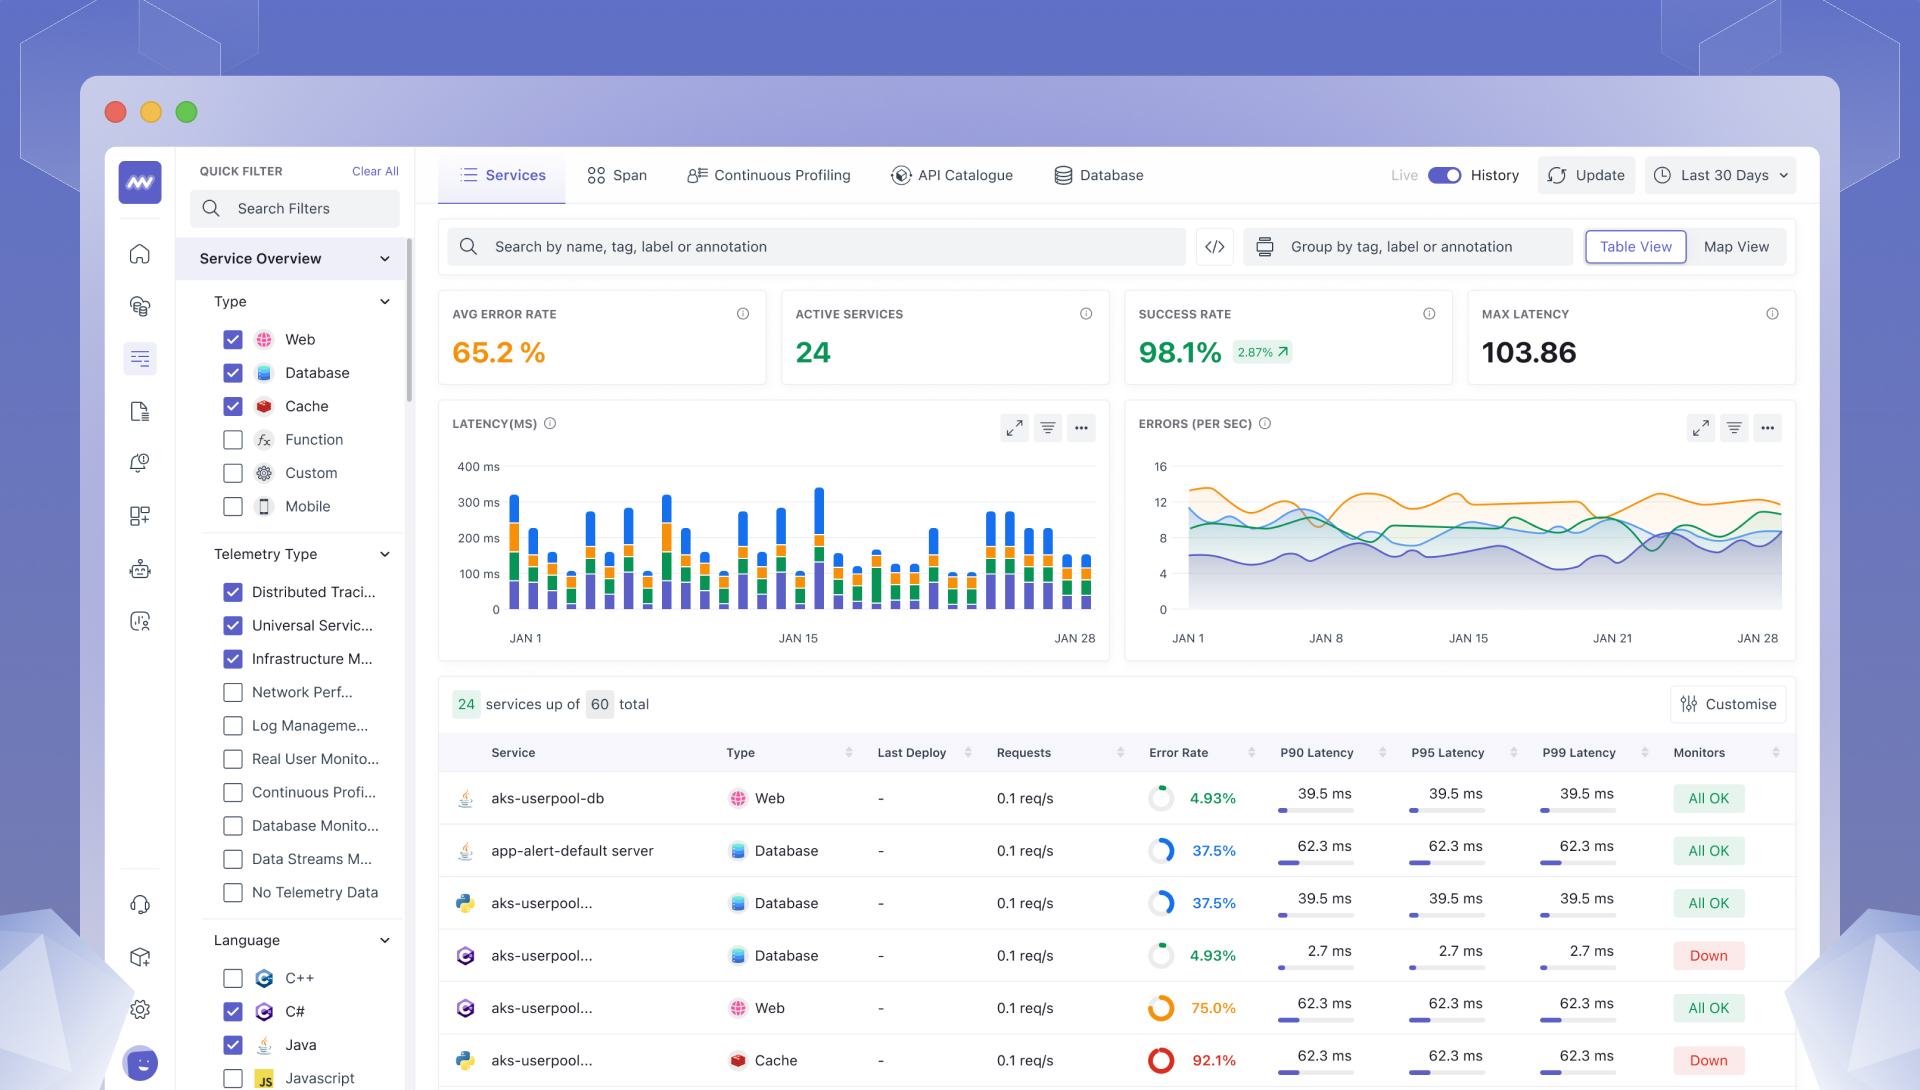
- Middleware: A full-stack cloud observability platform that empowers teams to optimize cloud operations, reduce downtime, and boost productivity with 100% ingestion control. Middleware offers a comprehensive suite of observability tools, including infrastructure monitoring, log monitoring, APM, LLM observability, database monitoring, synthetic monitoring, serverless monitoring, container monitoring, and real user monitoring. With Middleware, teams can improve MTTR, expedite root cause analysis, and boost developer productivity while reducing observability costs by up to 10X.

- DataDog: A monitoring and analytics platform that provides real-time insights into application performance, infrastructure health, and user experience. With DataDog, teams can track key metrics, monitor logs, and receive alerts and notifications.
- New Relic: An observability platform that provides real-time insights into application performance, user experience, and infrastructure health. With New Relic, teams can monitor and troubleshoot their systems, and gain insights into customer behavior.
See how Middleware is Drawing Customers Away from Datadog & New Relic!
- Prometheus: An open-source monitoring system that specializes in collecting and querying metrics. With Prometheus, teams can set up time-series data collection and define custom metrics to track critical aspects of their applications.
- Grafana: Known for its interactive dashboards, Grafana enables visualization of metrics collected from various sources, including Prometheus. With Grafana, teams can set up real-time monitoring and build customized dashboards to visualize performance trends.
- Jaeger: A distributed tracing tool that helps track the path of a request as it flows through different services. Jaeger enables engineers to pinpoint latency sources and identify where service interactions could be optimized to reduce bottlenecks.
By combining these tools, teams can monitor their systems more effectively, gaining the visibility needed to maintain performance and reliability.
Best practices
Implementing observability effectively involves more than just choosing the right tools. Here are some key practices to ensure a successful observability strategy:
- Start with high-impact services: Begin by implementing observability in key services where visibility is most impactful, then gradually expand coverage across other parts of the infrastructure.
- Promote team-wide adoption: Ensure everyone understands the importance of observability and how to use the tools. Conduct training sessions and foster a culture that values data-driven insights, as this will encourage consistent use and better understanding across teams.
- Prioritize consistency and data quality: Establish standardized formats for logs, metrics, and traces to ensure consistency. Consistent data makes it easier to correlate insights and helps maintain a clean, actionable dataset.
- Iterate and improve: Observability is not a one-time setup; it evolves with the system. Regularly review and refine your observability practices to keep up with changing infrastructure needs and optimize performance.
With these practices, the platform engineering team can build an observability framework that not only monitors systems constructively but also permits platform engineering to create a stable and reliable foundation for applications.
Using Observability to drive developer productivity
Strengthen self-service
Observability provides developers with real-time visibility into system performance, enabling them to diagnose and resolve issues independently. This autonomy lessens reliance on central support and boosts productivity, aligning with platform engineering’s goal of minimizing operational bottlenecks. By tracing issues quickly, developers can make direct improvements, refine workflows, and reduce dependency on operations teams.
Serving internal customers, primarily app developers, is crucial in improving self-service capabilities. With access to metrics, logs, and traces, developers can:
- Diagnose issues faster: Observability data enables developers to pinpoint issues independently, whether it’s an API bottleneck, database slowdown, or configuration error.
- Optimize workflows: Real-time insights allow developers to monitor the impact of their code changes, facilitating immediate improvements and supporting platform stability.
- Minimize disruptions: Self-service observability speeds up issue identification and resolution, leading to fewer disruptions in productivity and increasing platform resilience.
Case Study: Trademarkia
For many organizations, observability is a powerful enabler of developer self-sufficiency. Consider the experience of Trademarkia, a visual search engine for trademarks, which encountered significant hurdles with an outdated tech stack. Transitioning from .NET Core to a microservices-based architecture, the company needed a reliable observability solution to keep pace with its newly distributed infrastructure.
By implementing Middleware’s observability platform, Trademarkia gained the real-time log monitoring and insight needed to optimize issue detection and resolution. With this observability framework in place, developers could diagnose and resolve issues independently, often within minutes rather than hours. This self-service capability not only accelerated debugging times but also reduced dependency on central support, enabling the team to focus on scaling and improving the platform.
Trademarkia’s move to observability also had a measurable impact: a 20% reduction in time to resolution, improved productivity, and proactive issue detection. This observability-driven approach to platform management allowed Trademarkia to offer users a smoother, more responsive experience, ultimately reinforcing the stability of the platform and freeing engineers to focus on strategic development. The company’s success highlights the importance of initiating the platform engineering journey by engaging with engineering teams to identify bottlenecks and developer frustrations.
Read more about Trademarkia’s observability journey here.
Choosing the right Observability strategy
Choosing the right observability strategy is a decisive factor for strengthening platform performance and ensuring alignment with organizational needs. Here are five key strategies with a platform engineers focus:
- Align with business objectives
Ensure observability supports broader goals, like rapid incident response or improved user experience, making it a valuable asset that aligns with platform engineering’s purpose of building a responsive and resilient infrastructure. - Prioritize scalability
Choose solutions that can scale with infrastructure, managing increased data volumes without performance degradation. This directly supports platform engineering’s aim of creating an adaptable and future-ready foundation. - Focus on usability
Opt for intuitive tools that are accessible to all team members, encouraging adoption across development, operations, and platform engineering teams. Usability drives collaboration and fosters quicker issue resolutions, reinforcing a cohesive engineering strategy. - Ensure smooth integration
Select tools that integrate well with your existing tech stack, enabling a continuous data flow and improving efficiency. Smooth integration aligns with platform engineering’s goal of reducing operational friction and enabling efficient workflows. - Balance cost and value
Evaluate the investment against long-term benefits in reliability and productivity, ensuring observability remains cost-effective. This supports platform engineering by ensuring resources are used effectively to build a resilient and sustainable platform.
Things to avoid in Observability
While observability is crucial, certain practices can hinder its effectiveness. By steering clear of these common pitfalls, platform engineering teams and the platform team can maintain clarity, reduce operational load, and reinforce platform resilience.
- Avoid information overload: Observability can produce large volumes of data that may overwhelm teams and obscure critical insights. By concentrating on key metrics, logs, and traces, platform engineering teams can ensure that only relevant data informs performance and issue resolution, helping maintain a responsive and resilient platform.
- Maintain data hygiene: Regularly reviewing and removing outdated or redundant data keeps observability dashboards clear and actionable. Consistently managing data quality allows platform engineers to troubleshoot effectively without the distraction of irrelevant information, reducing operational overhead.
- Ensure consistency: Standardizing data formats, naming conventions, and protocols across observability tools enables teams to interpret data accurately and fosters a unified approach across the organization. Consistent data practices also allow platform engineering teams to improve infrastructure efficiently, minimizing confusion or errors and reinforcing platform stability.
Conclusion
Starting with observability may seem challenging, but by focusing on key services and gradually expanding, teams can see substantial improvements.
As platform engineering evolves, software engineering organizations will find observability pivotal in maintaining resilient and reliable systems. Emerging trends like AI-driven observability offer promise for even greater insights and operational gains.
What is platform engineering?
Platform engineering focuses on building and maintaining scalable and reliable infrastructure, along with tools that support the software development lifecycle. It ensures smooth collaboration between development and operations teams by providing shared services and environments.
Is platform engineering the same as DevOps?
Platform engineering and DevOps have different focuses. Platform engineering provides the infrastructure and tools, while DevOps emphasizes collaboration and practices that enable teams to work together efficiently across development and operations.
What is observability in platform engineering?
Observability in platform engineering is about gaining insights into system performance and behavior through metrics, logs, and traces. It helps teams quickly identify and resolve issues, ensuring the system remains efficient and reliable.
What role does observability play in platform engineering?
Observability in platform engineering provides critical visibility into infrastructure and applications, helping teams proactively monitor, detect, and resolve issues before they impact users. It supports stable, scalable operations by enabling engineers to understand system behaviors, identify anomalies, and optimize performance across complex architectures.
How does observability differ from traditional monitoring?
Traditional monitoring relies on pre-defined metrics and alerts to track known issues, while observability offers a broader, more dynamic view. With observability, engineers can investigate unanticipated problems by exploring metrics, logs, and traces in-depth, allowing for faster diagnostics and a proactive approach to system resilience.
What challenges can observability help solve for platform engineers?
Observability helps platform engineers and software developers manage the complexity of distributed systems, decrease Mean Time to Detect (MTTD) and Mean Time to Resolution (MTTR), and strengthen root cause analysis. By consolidating data from metrics, logs, and traces, observability allows teams to pinpoint issues more effectively, reducing downtime and boosting system stability.


