In the last decade, the need for observability has grown tremendously, and so have the tools. Two tools that have always stood toe-to-toe are Datadog and Dynatrace. When it comes to the popular Datadog vs Dynatrace debate in the observability community, both are regarded as industry titans and provide a comprehensive set of features for a fool-proof observability platform. So which observability powerhouse should you choose and why?
In this post, we’ll explore how the tools compare regarding monitoring capabilities, features, pricing, and much more. By the end of this post, you’ll have zero decision fatigue in picking the right observability tool for your specific needs.
Datadog vs Dynatrace: Infrastructure Monitoring
When it comes to integrations, Datadog will surprise you with its wide range of infrastructure metrics that span across a multitude of infrastructure platforms. You can create highly customizable dashboards using its extensive library of more than 500 integrations. As if this wasn’t enough, you also get support for Kubernetes and container environments.
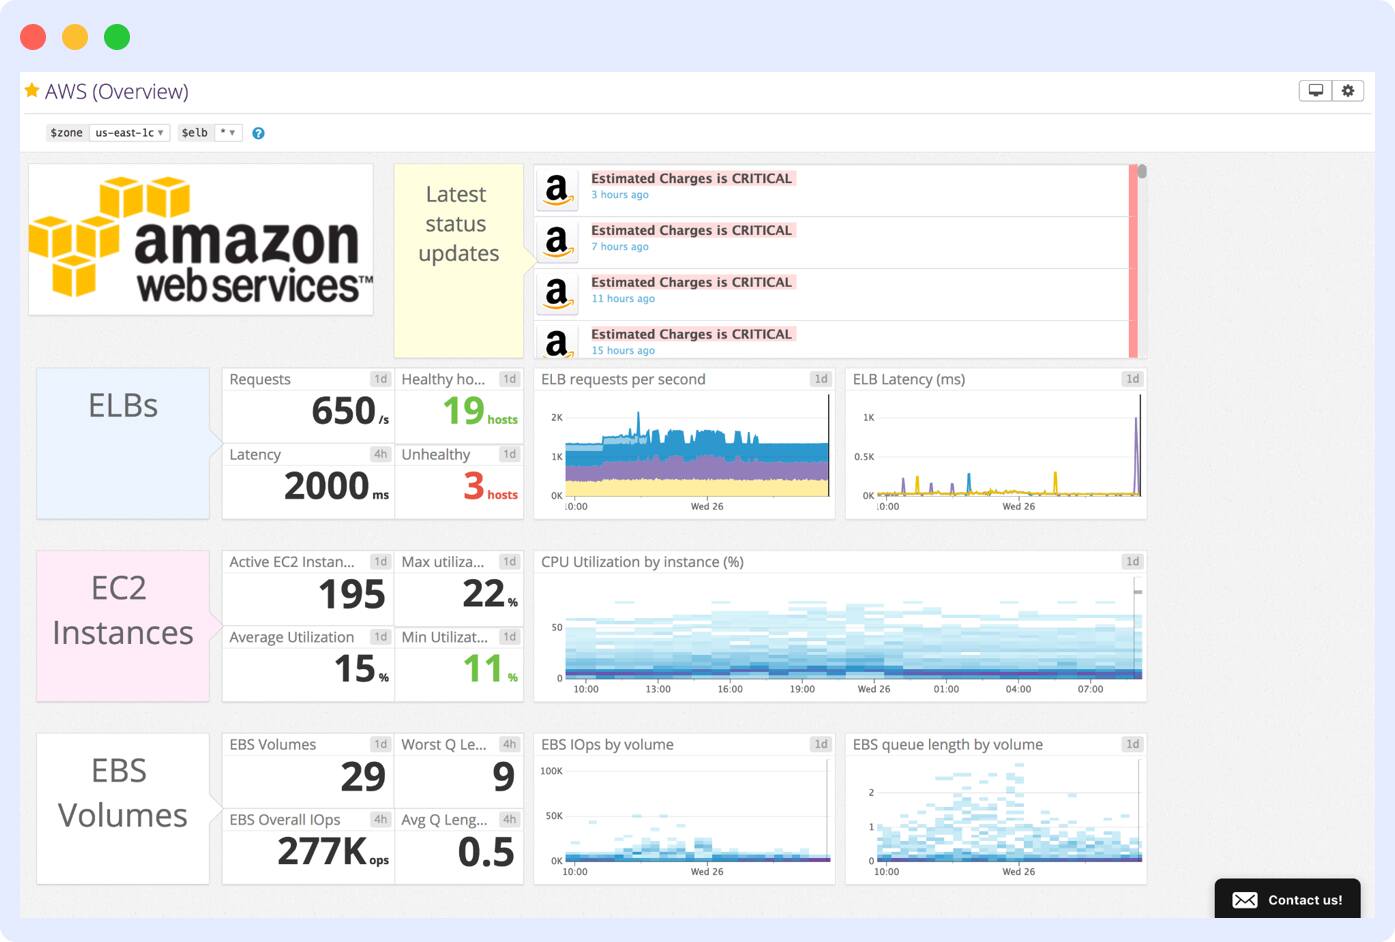
Moreover, if you require multi-cloud or hybrid environments, you can use Datadog’s unified platform for visibility across providers such as AWS, Azure, GCP and even any on-premises infrastructure you own.
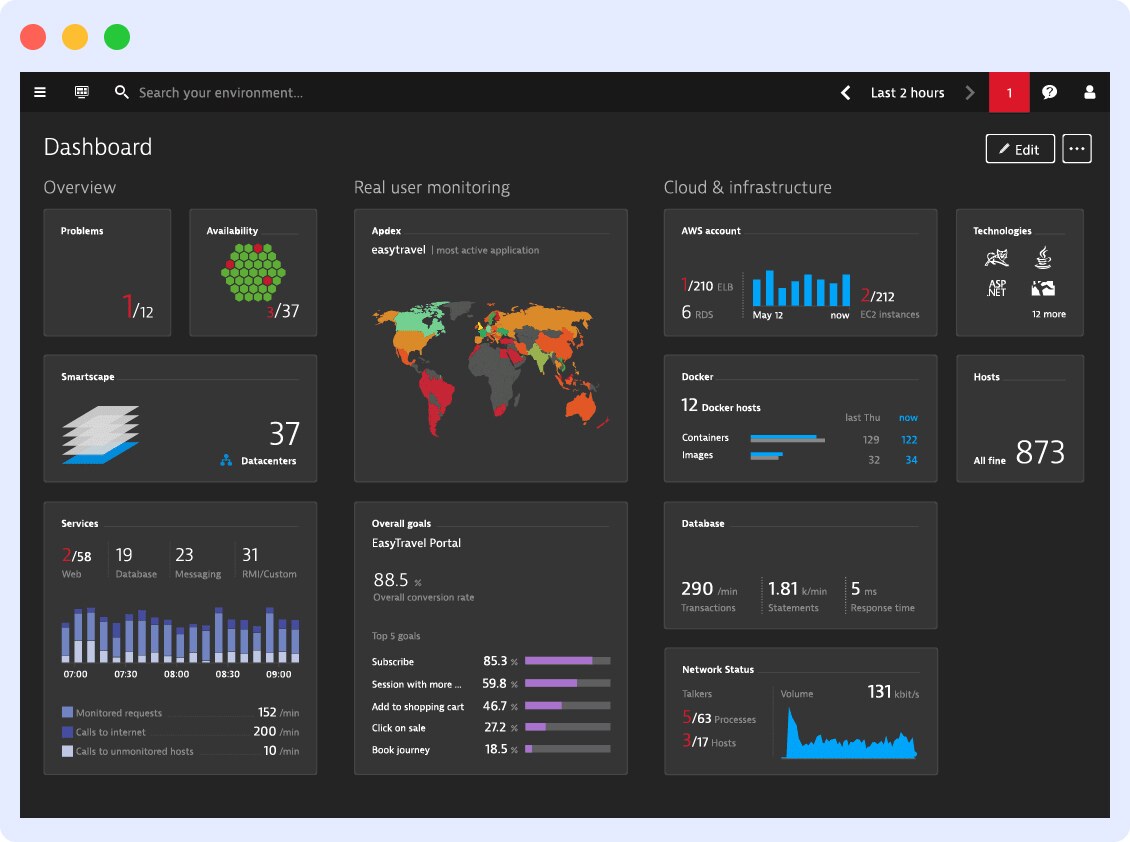
On the other hand, Dynatrace gives you a significantly simplified infrastructure troubleshooting system. With a more well-rounded, out-of-the-box setup, you’ll spend less time tinkering with configurations and setup than you would with Datadog.
Winner
We’ll call it a tie – both Datadog and Dynatrace excel in different contexts when it comes to monitoring. If you’re a large enterprise, you can make the most of the automation Dynatrace offers. If you’re an agile team with diverse cloud environments, Datadog’s flexibility can be a safer bet.
Datadog vs Dynatrace: Log Management
Another area where Datadog vs Dynatrace stands apart is their log management capabilities.
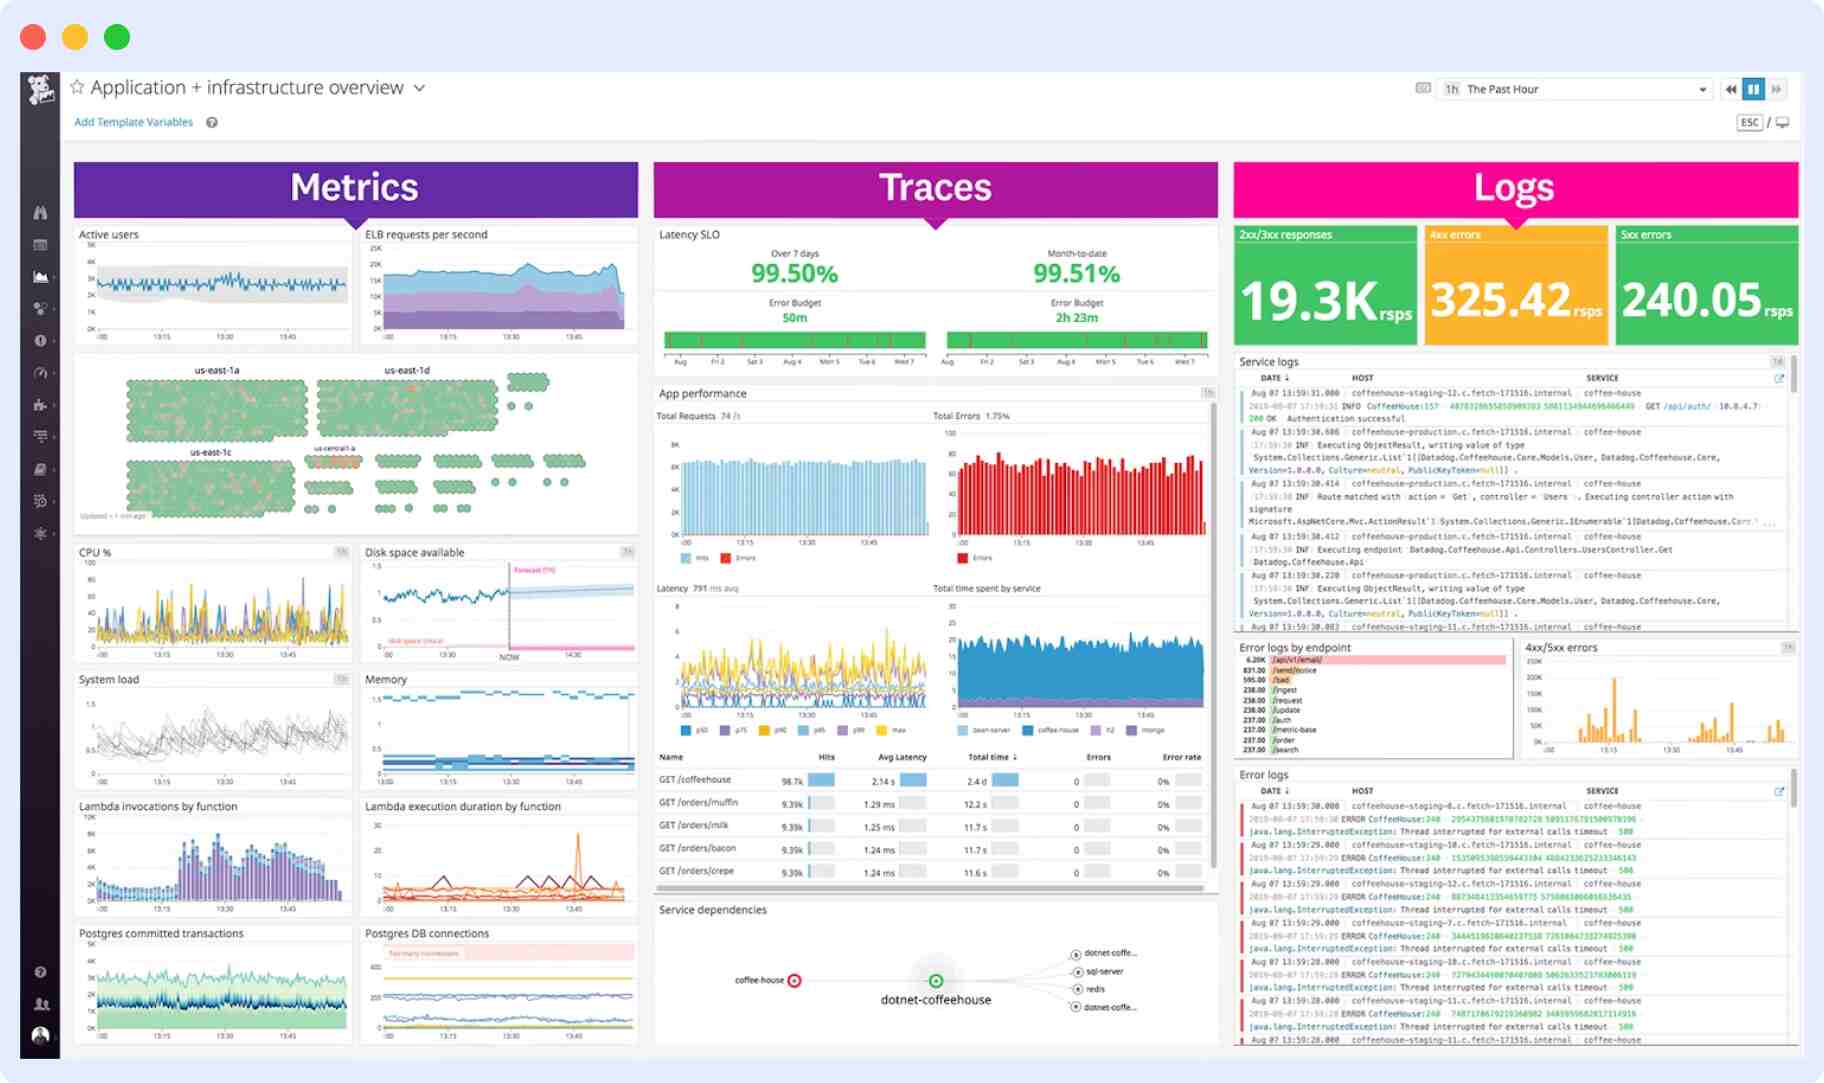
Datadog makes it extremely easy to narrow down issues by giving you a robust, searchable, and multifaceted filtering log management. This provides you with some powerful log querying capabilities. Moreover, logs from your system are integrated with your metrics and so you can correlate specific log entries directly with your metrics. The only problem with Datadog’s log management is that you need to manually configure them in the agent configuration files.
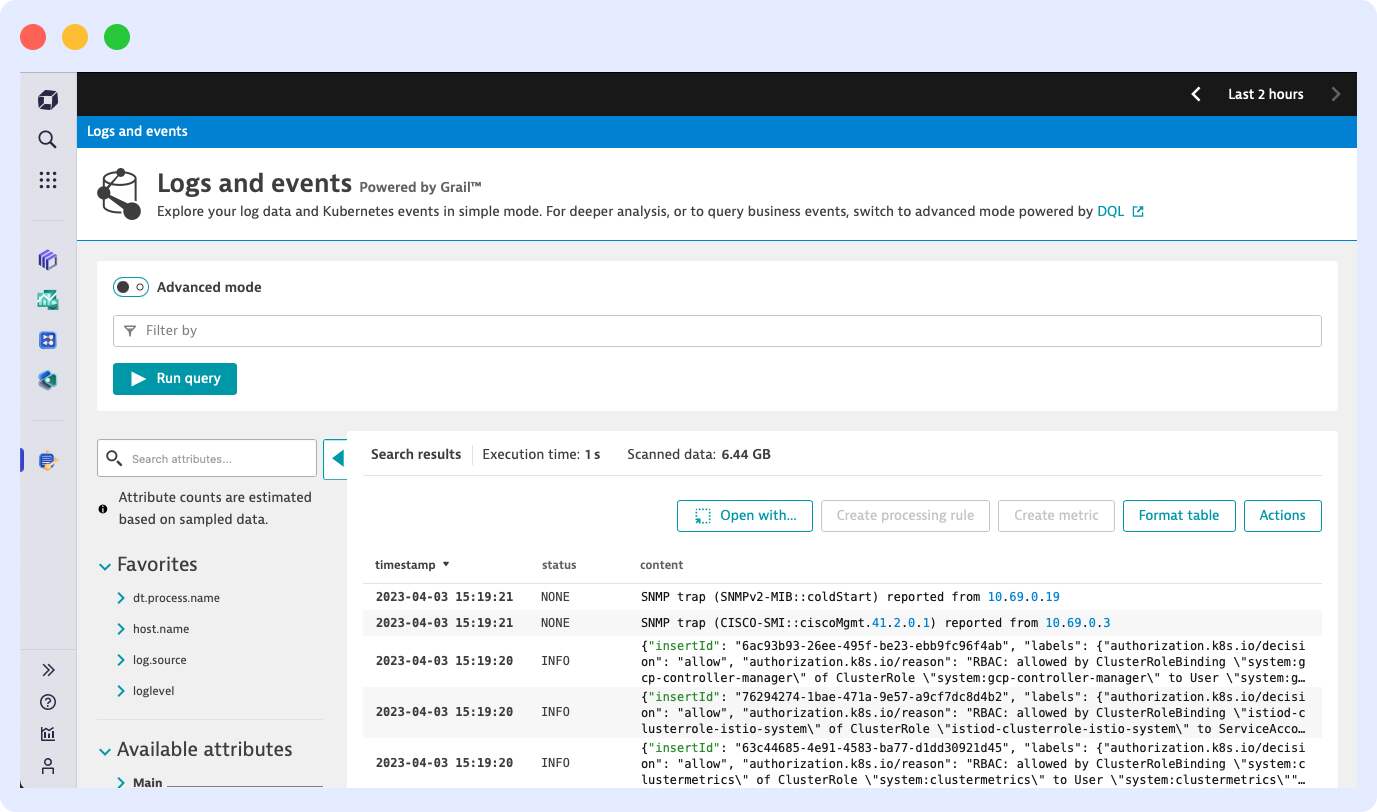
Dynatrace emphasizes its AI engine to automatically detect and classify different log anomalies. If your system has a repetitive pattern of errors, Dynatrace will flag the relevant logs and alert you of the same. However, compared to Datadog, Dynatrace provides a limited log querying mechanism, making its log management comparatively underwhelming. However, it does provide a much more convenient way to set up log management straight from the UI without the need for any manual configuration.
Winner
The upfront work involved in setting up log management in Datadog can be compensated by its powerful log searching mechanism and correlation with metrics. Dynatrace’s automated log classification is more of a convenience factor, so we’ll give this one to Datadog.
Datadog vs Dynatrace: Application Performance Monitoring (APM)
When it comes to APM, you want a tool that can go granular into your code and catch even the slightest change in metrics, such as response time, error rates, resource usage, etc. Much of this depends on the algorithms that the tool internally uses to measure these metrics through your code execution.
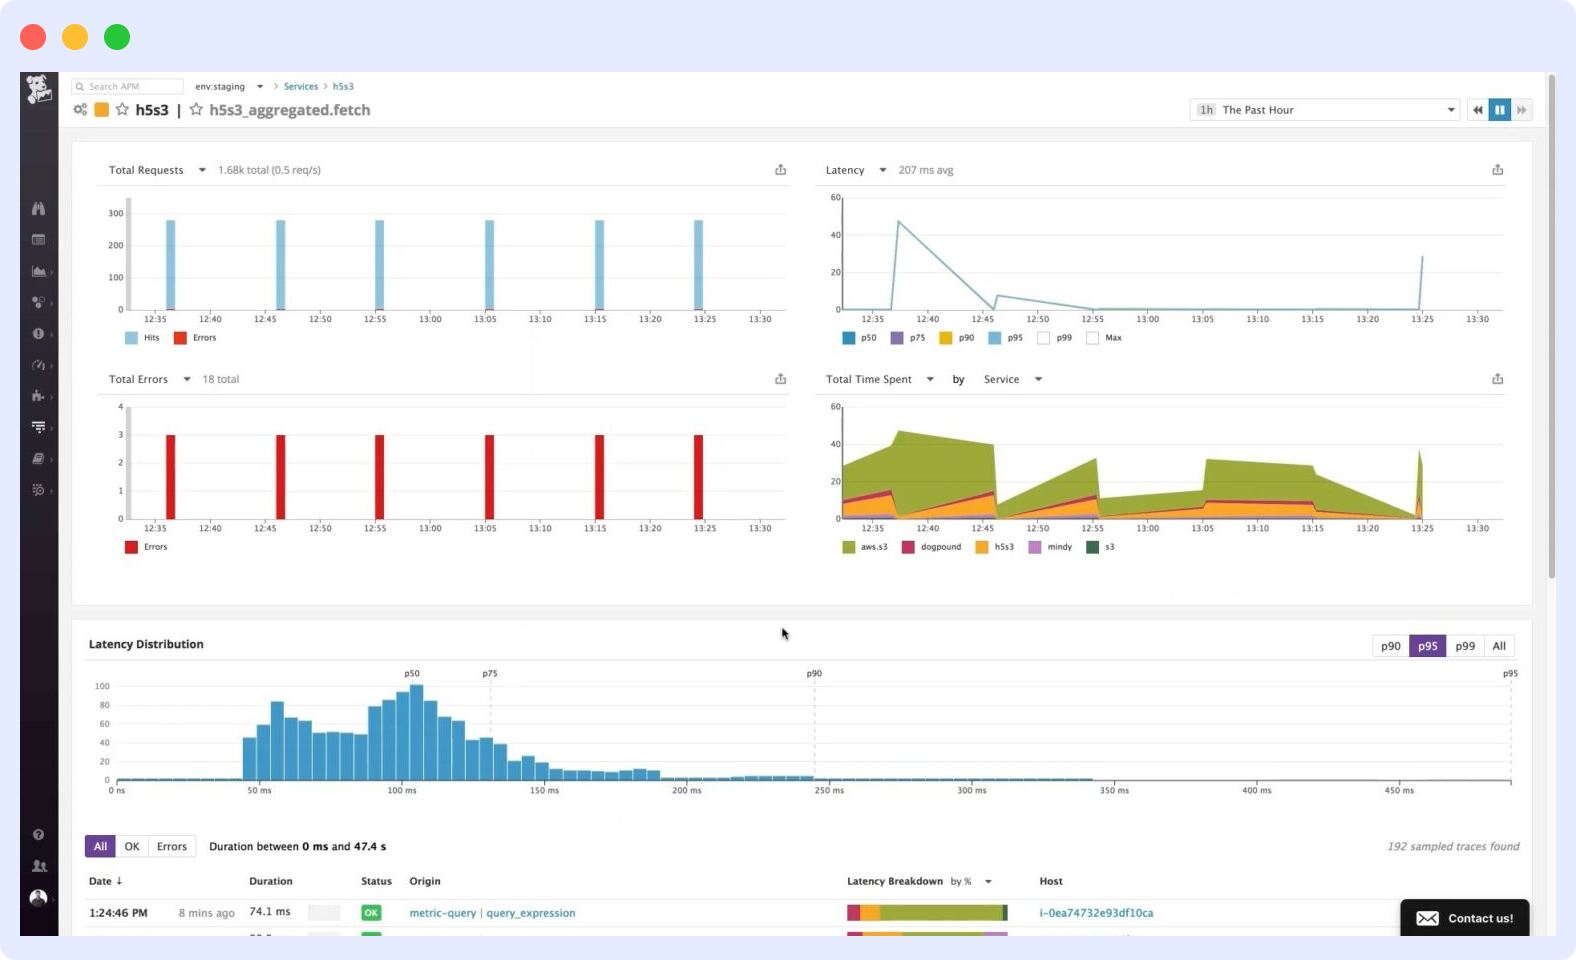
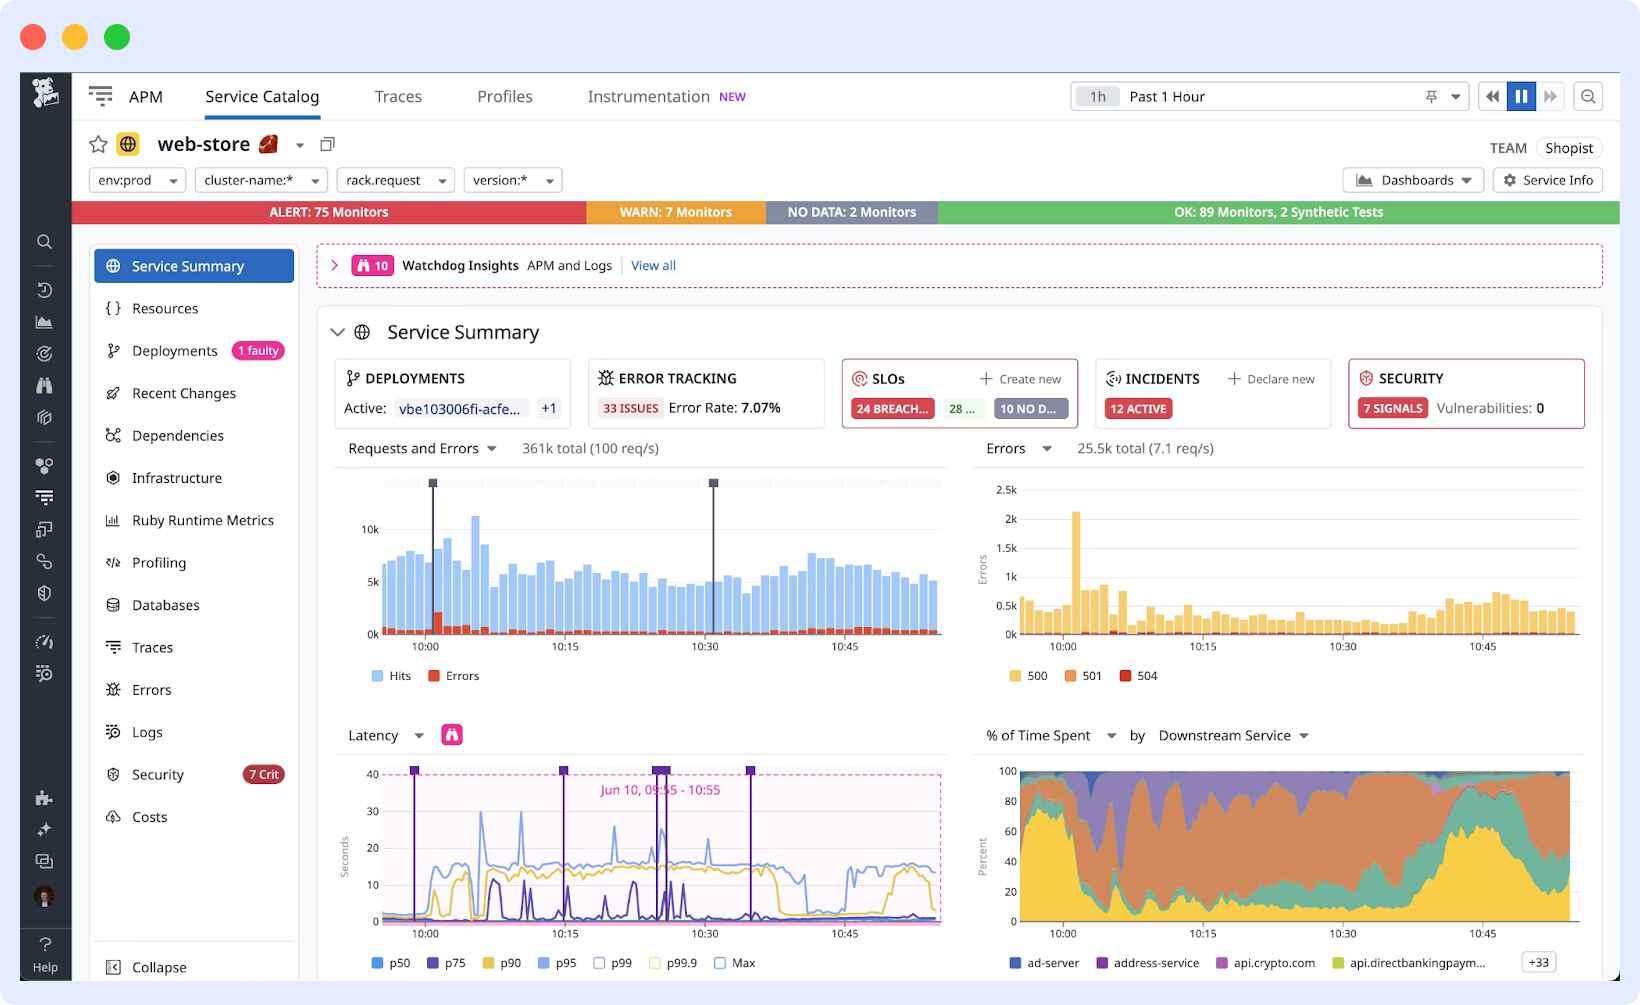
Datadog’s application performance has a separate dashboard not directly available from the main dashboard, which may make it hard to locate. However, once you locate it, it’s much simpler to get started. Standard distributed tracing with code-level visibility provides a good level of application performance monitoring but can feel less powerful against Dynatrace.
Dynatrace utilizes a proprietary PurePath tracing technology that provides method-level visibility into your code. You also get AI-powered root cause analysis to wave a magic wand that finds the root cause for you without having to sift through the metrics manually. It does have a comparatively steeper learning curve.
Winner
With a stronger and quicker automated analysis for your application’s monitoring, Dynatrace sweeps the win in this category.
Datadog vs Dynatrace: Real User Monitoring (RUM)
Monitoring logs, infrastructure, and applications will only take you so far, but what about the actual user experience? Real-user monitoring is perhaps the trickiest type of monitoring. You’ll be surprised by how much you can use it to enhance your application’s overall user experience. Yet it’s something often overlooked by engineering teams. But if you do it right, you not only impress your users but also meet your business goals.
Both tools offer session replays, which is something a lot of monitoring platforms have started offering to get a real sense of how your users behave.
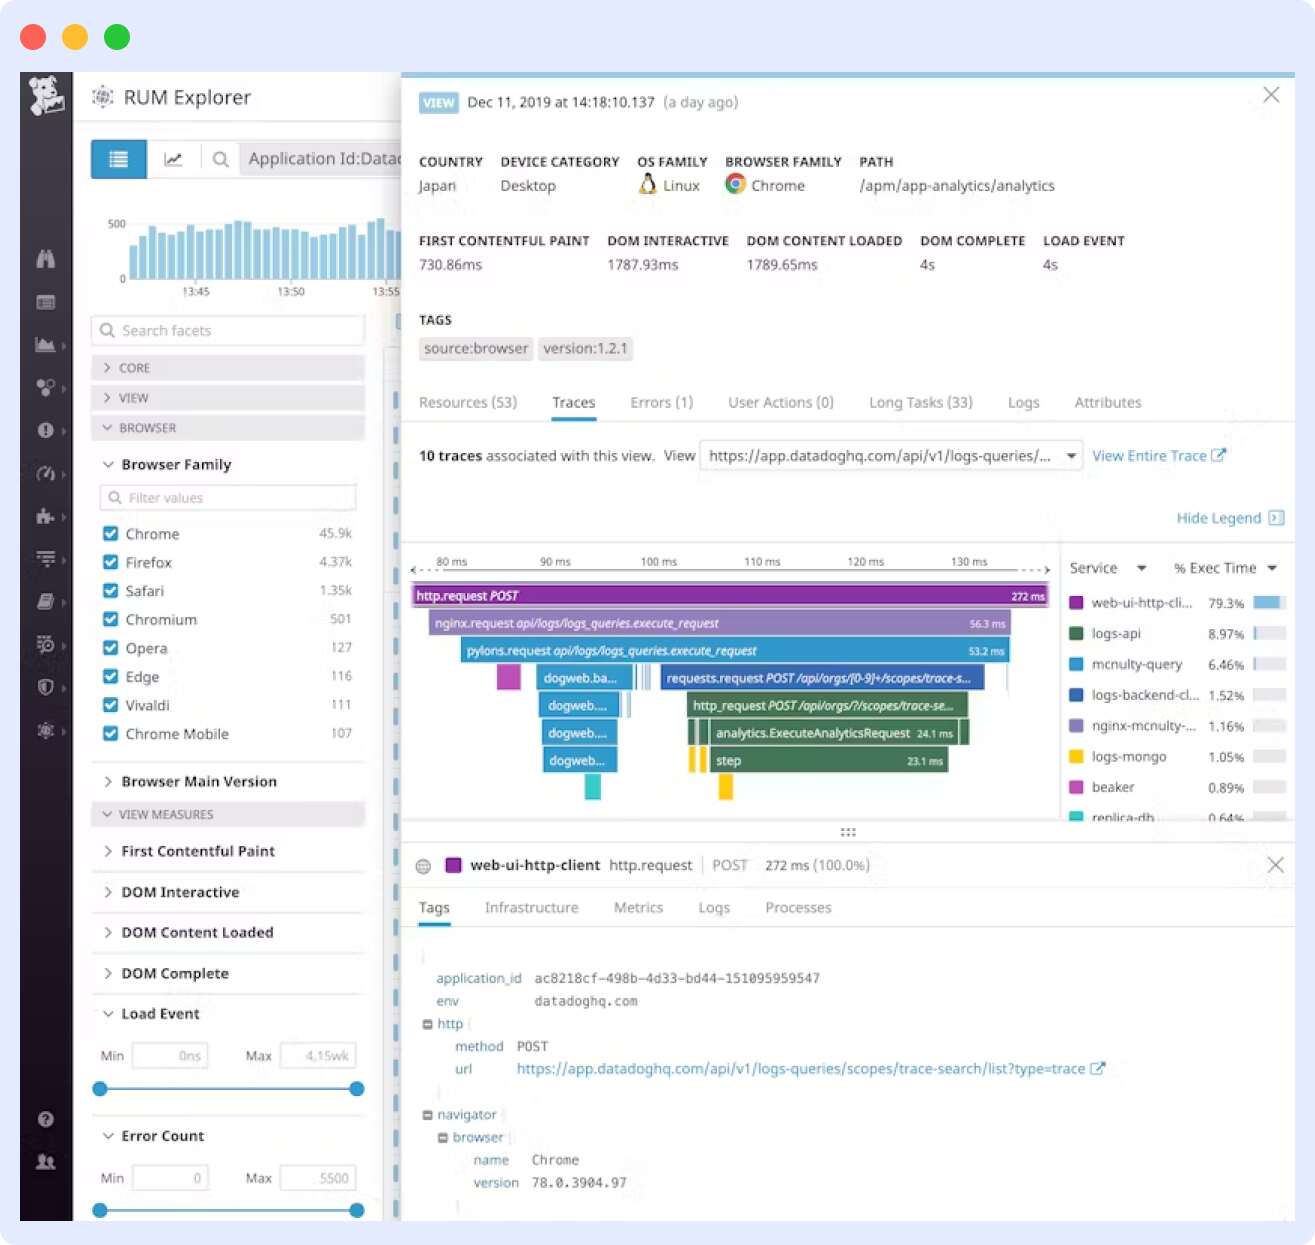
Datadog also provides you with client-side metrics like web vitals, network request tracking, JavaScript-related errors and detailed user journey maps. These are certainly helpful, but they may be overkill for an engineer who’s trying to communicate these findings to their relevant teams.
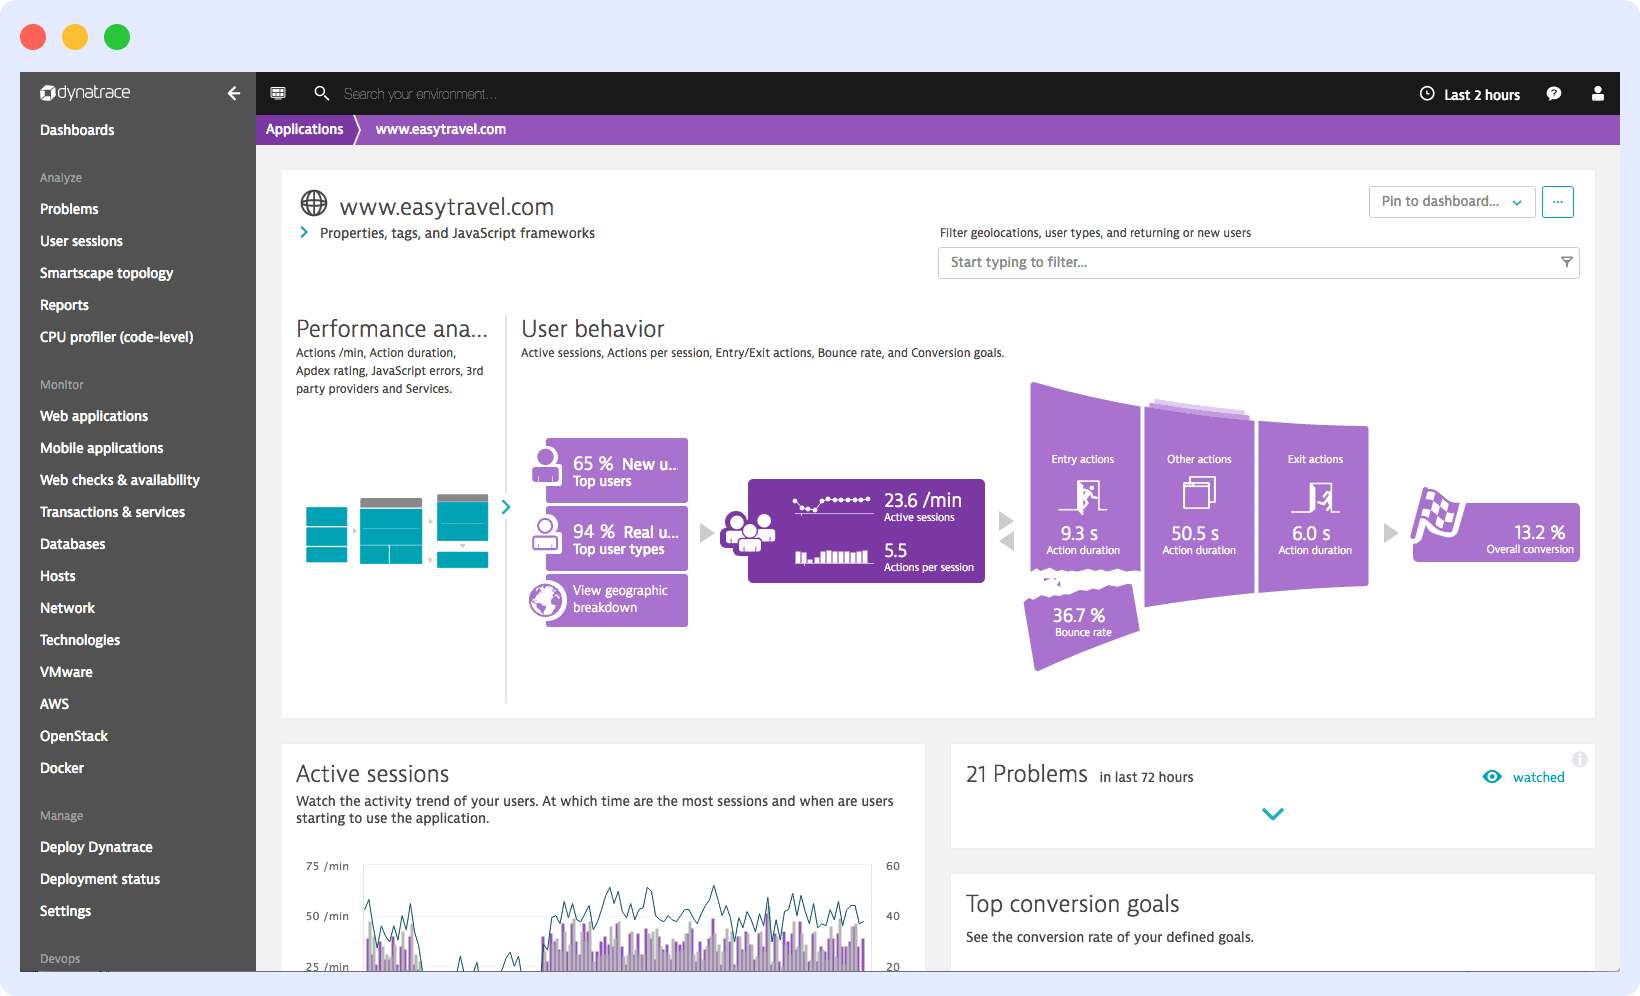
This is where Dynatrace leaps. It gives you correlations between user behaviour and business metrics. You can define these business metrics on your own, such as conversion rates or revenue. For instance, Dynatrace can detect if your application’s checkout page has a slow load time that can lead to decreased conversion rates.
Winner
Dynatrace bags the win again due to its superior business correlation with user experience analysis. Are you keeping score? It’s 2-1 with Dynatrace in the lead!
Datadog vs Dynatrace: Incident Management & Alerts
What good is a monitoring system if hell breaks loose in your application and you don’t get notified? A thorough alerting system helps you process and manage incidents, thereby helping you resolve performance issues or outages promptly to ensure reliability for your end users. Luckily, both tools allow you to set detailed alert thresholds and create custom alerting logic.
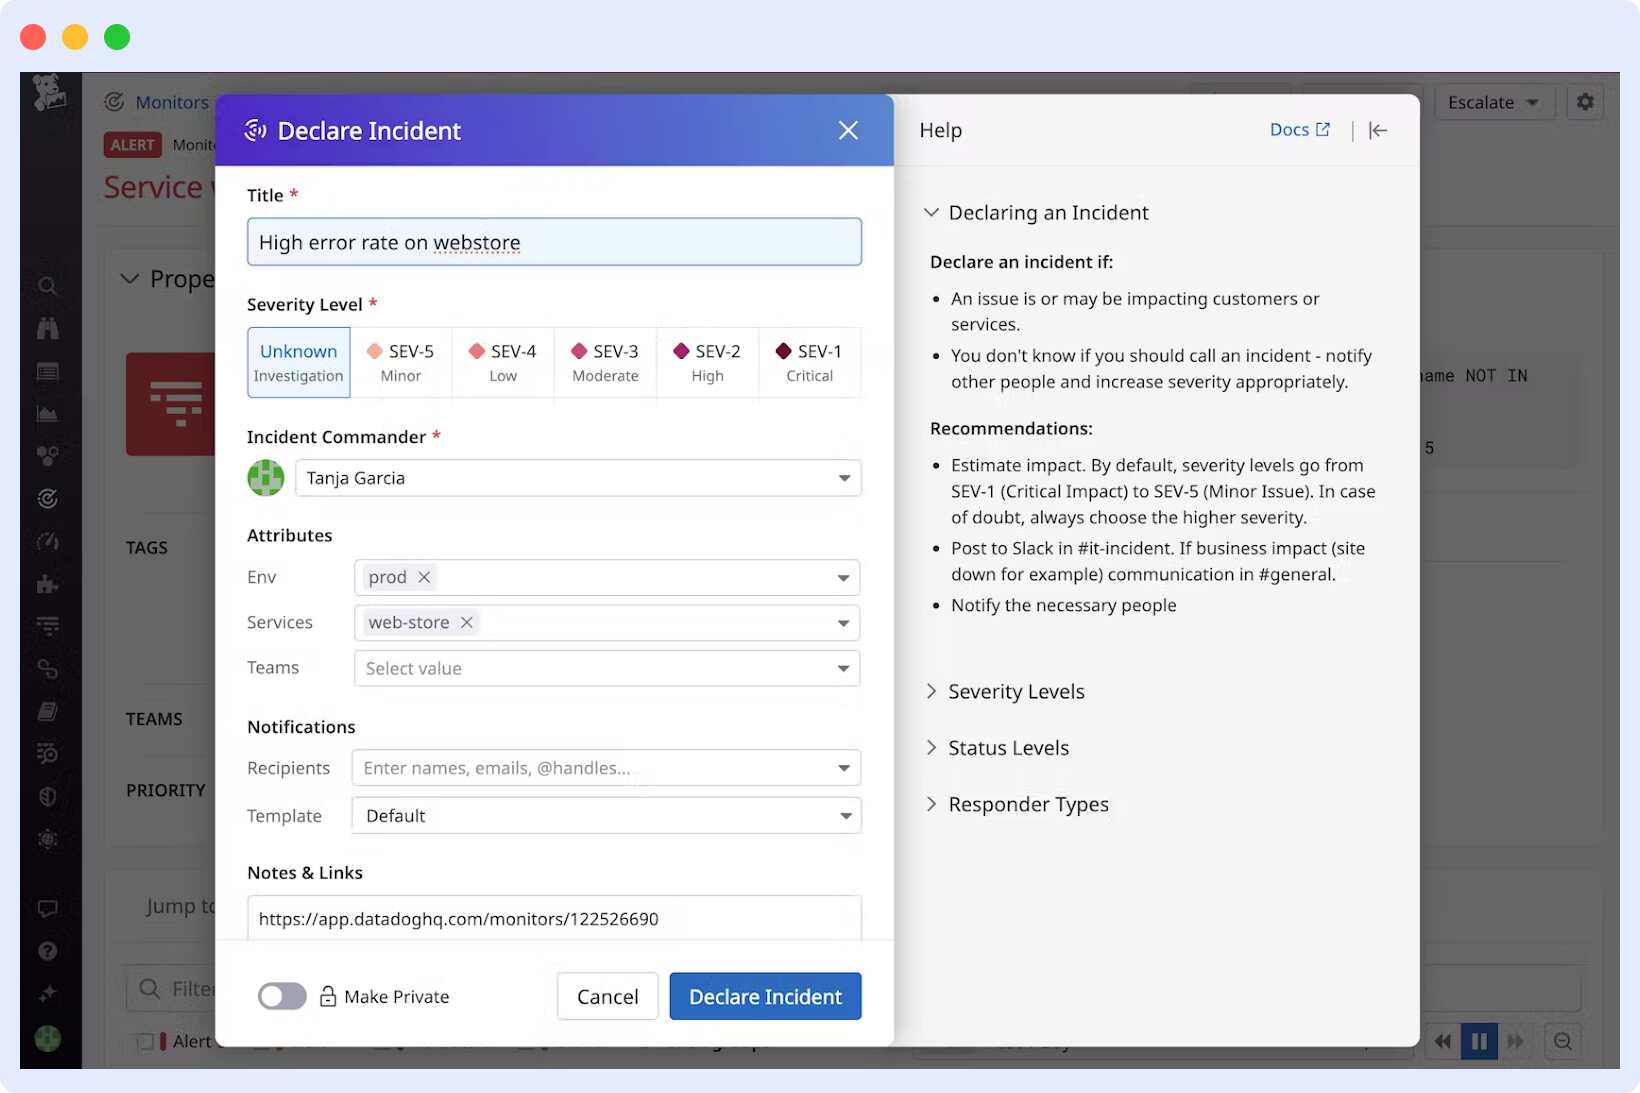
Datadog gives you complete incident management where you can not only create but also rank or prioritise these incidents. You can also manage these incidents by assigning them to other members of your team. Alerts can be easily integrated with automated emails or Slack webhooks so you’re well-informed of these incidents.
I wish there was a way to manage on-call schedules or communicate incidents directly through Datadog’s status pages, but given the incident management and alerting features already present, it might be too much to ask for.
Dynatrace doesn’t offer a dedicated incident management unlike its rival. It does offer basic alerting, but it’s limited in comparison to Datadog. A key feature with alerts is grouping, which is quite powerful. Dynatrace groups related issues together automatically and groups multiple alerts into a single alert.
This makes it easier for anyone on your team to review these alerts and take action quickly by reducing the manual process of scouring through multiple alerts and the chance of running into alert fatigue.
Winner
Grouping alerts is a useful feature, but the lack of dedicated incident management gives this one away to Datadog.
Datadog vs Dynatrace: Security Monitoring
Both tools can be equally great at using the existing monitoring capabilities like detecting logs, metrics and traces to further detect any security pitfalls. However, Datadog provides analytics for monitoring the security of your infrastructure.
Dynatrace, on the other hand, gives you security monitoring at the application level. It can instantly detect vulnerabilities introduced by third-party libraries or any newly deployed code.
Winner
With a more well-rounded infrastructure security, Datadog is the winner in this category.
Datadog vs Dynatrace: OpenTelemetry Support
Datadog provides native support for OpenTelemetry and allows you to configure your OpenTelemetry collector to directly export data into Datadog.
Dynatrace provides integrations with OpenTelemetry collectors where your OpenTelemetry data is ingested into the platform, which then Dynatrace uses to further provide automated insights using its AI engine.
Winner
Dynatrace’s automated insights on OpenTelemetry data can be a good brag against Datadog’s standard but limited OpenTelemetry support. Dynatrace sweeps the win in this category.
Datadog vs Dynatrace: Ease of Integration & Deployment
We saw earlier how Datadog banks on the countless integrations it offers. The flip side of this is the overhead in the initial setup and manual configuration that’s required. To deploy Datadog, you’ll need to install and configure agents across various infrastructure components. This can be extremely time-consuming for large-scale complex environments.
We also saw how setting up logs requires some configuration upfront. For deployments, you don’t have the option of choosing on-premise with Datadog.
Dynatrace, on the other hand, is relatively straightforward to set up and configure. The initial onboarding support makes it easier for anyone setting it up for the first time to get the hang of it in minutes. You can also configure agents directly from the web app.
Moreover, once you install OneAgent, Dynatrace automatically takes over and starts reporting logs without any additional configuration steps needed. Dynatrace gives you both cloud as well as on-premise deployments so you can opt for whatever suits you best.
Winner
With a simpler and faster initial setup and flexible deployments, Dynatrace is the go-to tool in this category for complex or large-scale environments.
Datadog vs Dynatrace: UI & UX
Datadog offers a simple and highly intuitive interface where you can easily access data or browse through different sub-product pages, such as the one for querying and visualization.
You can build custom dashboards using the built-in drag-and-drop feature or tailor-fit the visualizations and widgets to your monitoring needs. Any technical team will find it a breeze navigating through Datadog’s interface.
With a modern and sleek UI, Dynatrace simplifies user interactions for managing complex or large-scale systems using its automated assistance. However, its dashboard, for the first time, can appear overwhelming due to the volume of data it displays all at once.
Winner
This one certainly goes to Datadog due to its more user-friendly interface that requires relatively less of a learning curve to adapt and get the hang of the tool.
Datadog vs Dynatrace: Data Querying & Visualization
Both tools provide their own powerful and flexible querying languages that are useful for different use cases. Datadog offers support for JSON and Lucene, whereas Dynatrace offers its proprietary query language called DavisQL. Dynatrace also integrates well with both SQL and GraphQL.
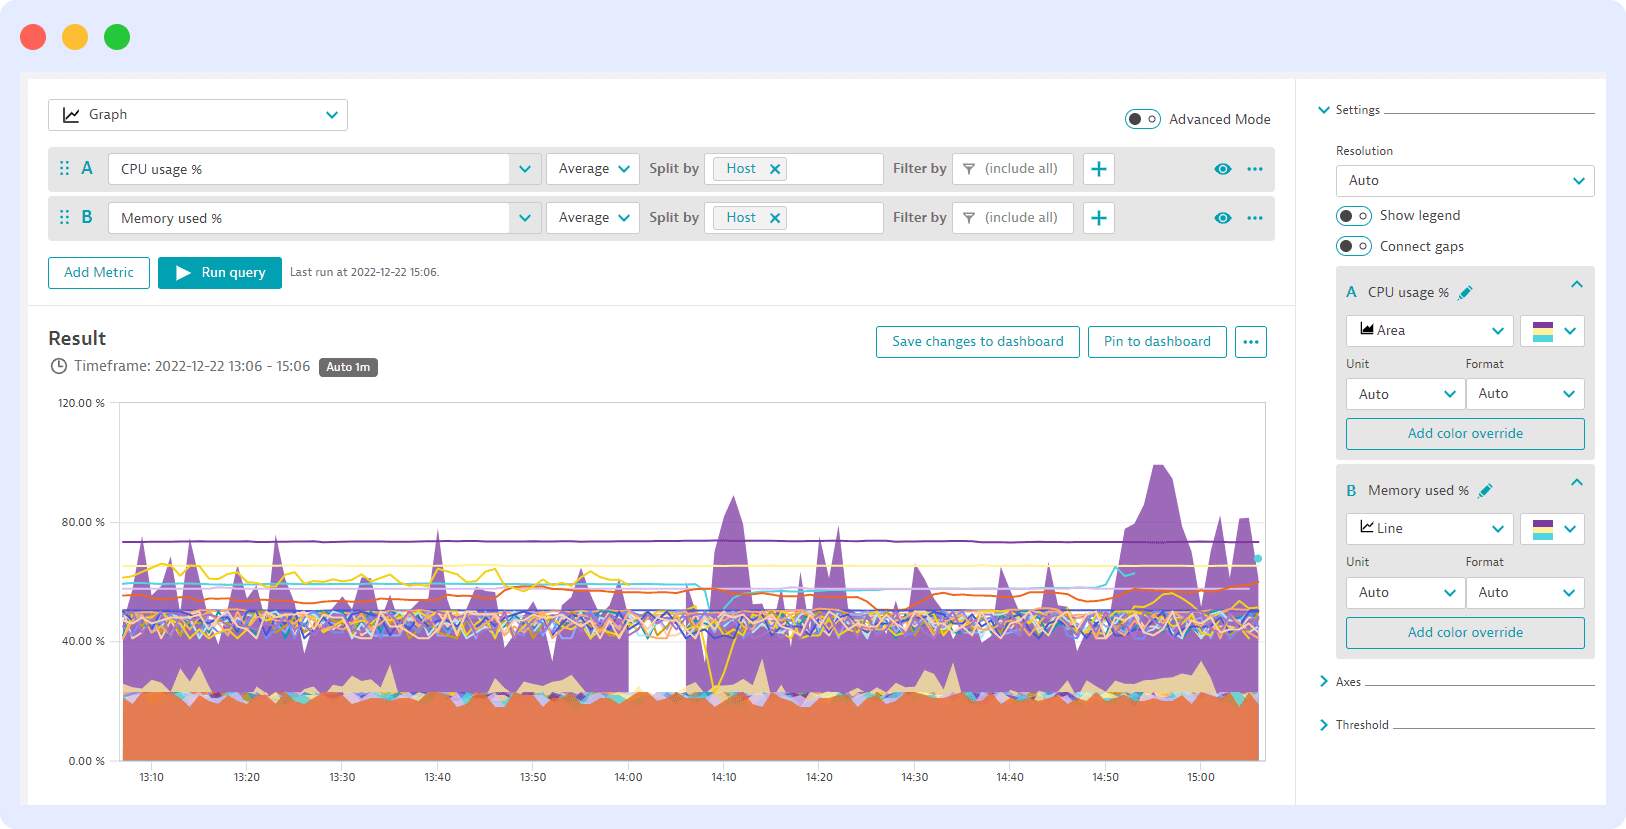
Datadog’s querying gives you detailed and precise analysis of metrics and logs. You can perform complex queries and create completely customizable visualizations and dashboards on top of the results from those queries.
Moreover, you can even use visual tools like heatmaps, line graphs, etc, for a more clear and detailed analysis.
Dynatrace’s querying and visualization are geared towards business use-cases and also offer fewer customizations and flexibility compared to Datadog. It’s still very useful if you want to translate your observability metrics to direct business outcomes.
Winner
Here’s another one for Datadog – perfect for teams that want more flexible, detailed and customizable visualizations.
Datadog vs Dynatrace: Team Management & Access Control
While I like how Datadog’s incident management works well with team management, where you can track and assign incidents to team members, overall access control features are present in both the tools. You can invite teammates, define roles and access levels for each role and work in silos with the rest of your team using both tools.
Winner
This is a no-brainer tie.
Datadog vs Dynatrace: Pricing
What good are all those features if you don’t have the budget for them? Pricing is often the most crucial factor, not just the numbers, but how those numbers change with how your usage changes.
Datadog’s pricing is based on usage. Its Pro plan costs $15 per host per month,and ethe nterprise plan starts at $23 per host per month. However, you’ll be charged separately for metrics logs, APM, security features, and other add-on features that you may want. If your usage is small, it can be cost-friendly, but as your usage grows, costs may become less predictable.
Dynatrace has a usage-based pricing but it’s more aligned with the scale and resource usage of your infrastructure. It offers two modes, and pricing differs based on which one you choose – SaaS or on-premise. Enterprises tend to prefer Dynatrace due to its lower relative cost at scale.
Winner
There are clear winners here, but it depends on the level of scale and complexity of your infrastructure. Datadog is cost-effective for smaller organizations, whereas Dynatrace is cost-effective for large enterprises.
“Compared to other observability solutions, Middleware offered similar or even superior capabilities at a much lower cost, eliminating the need for expensive tiered pricing or additional charges for advanced features. This made Middleware a more accessible and scalable solution for a business like ours. In fact, we were able to reduce our costs by 75%.”
Krishna Charan BS, Information Security Head, MindOrigin
Datadog vs Dynatrace: Automation and AI
Since AI isn’t a buzzword anymore, coupled with automation, a monitoring tool that utilizes AI capabilities can supercharge the productivity of your DevOps and Infra teams.
While both tools provide some level of automation, Dynatrace banks on its automation and AI features. Automated root cause analysis, better code tracing abilities and automatic issue resolution using its OneAgent, Dynatrace fares better in this category.
Winner
This one goes to Dynatrace.
Datadog vs Dynatrace: Third-Party & Community Reviews
We went through various third-party review platforms such as G2, Gartner, Reddit and the platform’s community reviews to give you a neat little summary of what engineers, infra heads and SREs think about both the tools.
In a nutshell, users find Datadog a user-friendly and easy-to-set-up monitoring platform. They love its out-of-the-box integration with AWS. However, they do emphasize the pricing challenges they experience in large-scale environments.
I’m not surprised by how popular Dynatrace is for its AI-driven root cause analysis and automation features. However, users are cautious about its pricing since it can get out of hand easily. Users also praise it for its application performance monitoring capabilities and business intelligence features.
Overall, Datadog seems to be more popular amongst teams, and that may primarily be because users find it a good all-purpose monitoring tool. Dynatrace is preferred by enterprises at scale, mostly because the cost is aligned with the value delivered to the enterprise teams.
Winner
All in all, I don’t think one tool outperforms the other in terms of community reviews. Overall, community support and reviews are almost at par for both the tools. We’ll call this a tie.
Datadog vs Dynatrace: Common Issues and Limitations
Both tools have their limitations, and it’s time to understand if they can be deal-breakers for you.
Datadog’s pricing model makes it difficult to manage costs for large-scale deployments. The extensive customization capabilities and integrations are helpful, but they can appear overwhelming to some users, especially those who don’t have a lot of experience with infrastructure tooling.
Datadog also has less structure in their documentation, which can make it hard for anyone to navigate through them and understand how to work with the tool.
Dynatrace works well with large-scale deployments, but its pricing will make you wonder if you can ever use its amazing AI features at your current scale. If you’re budget-conscious, you might have a hard time justifying its cost. Lack of flexibility and customization is another pain point for a lot of users.
Winner
This one is a tie, too – but we hope you keep these limitations in the back of your head when you decide on the right tool for your team.
Datadog vs Dynatrace: Summarising the key differences
When comparing Datadog vs Dynatrace across all major categories, it’s clear that both tools excel in different domains. However, one tool’s strength is another tool’s weakness, which makes it easier for you to draw your verdict in this Datadog vs Dynatrace debate.
Datadog excels with its intuitive, user-friendly interface and remarkable flexibility in integration support. Its highly customizable dashboards, paired with powerful querying capabilities, make it an exceptional tool for comprehensive monitoring needs. Adding further value are its robust security monitoring features and sophisticated out-of-the-box incident management system.
Dynatrace differentiates itself using its AI engine, coupled with its OneAgent technology and automation features. With more powerful application monitoring capabilities, it can be an ideal choice for teams looking to use monitoring to improve their business outcomes.
Here’s a quick 2-minute refresher of the entire blog post where we’ve summarised all the key differences in each category and why one tool, we believe, outperforms the other.
| Category | Winner | Key Differentiator |
| Infrastructure Monitoring | Tie | Datadog: Flexibility and integrations Dynatrace: Automation and simplicity |
| Log Management | Datadog | More powerful log querying and correlation with metrics |
| Application Performance Monitoring | Dynatrace | PurePath tracing and AI-powered root cause analysis |
| Real User Monitoring | Dynatrace | Superior correlation between user behavior and business metrics |
| Incident Management & Alerts | Datadog | Complete incident management with ranking and assignment capabilities |
| Security Monitoring | Datadog | Better infrastructure-level security monitoring |
| OpenTelemetry Support | Dynatrace | Automated insights on OpenTelemetry data |
| Ease of Integration & Deployment | Dynatrace | Simpler initial setup and flexible deployment options |
| UI & UX | Datadog | More intuitive interface with less learning curve |
| Data Querying & Visualization | Datadog | More flexible and customizable visualizations |
| Team Management & Access Control | Tie | Both offer comparable capabilities |
| Pricing | Depends | Datadog: Better for smaller organizations Dynatrace: Better for large enterprises |
| Automation and AI | Dynatrace | Superior AI-driven insights and automation |
| Third-Party & Community Reviews | Datadog | More popular across a wide set of teams |
Datadog vs Dynatrace: When to choose which tool?
It’s time to declare a verdict in this Datadog vs Dynatrace battle.
Choose Datadog if you:
- Are a medium to large scale organization and only need cost-effective standard monitoring capabilities
- Don’t care about automation and AI features as much as a well-rounded and comprehensive monitoring experience
- Want a tool that’s adept in infrastructure and security monitoring
- Don’t need on-premise deployments and need visibility across multiple cloud providers
Go with Dynatrace if you:
- Are a large enterprise and want the freedom of both on-premise and cloud-hosted deployments
- Want a modern-looking observability tool with a core focus on application performance monitoring
- Can use AI features and automated insights to boost the productivity of your engineering teams
- Need a monitoring platform that goes beyond observability by offering business intelligence
Remember, no tool will meet every need – you only need to pick the one that suits you the most and gives you the most value for money.
A Better Alternative: Middleware
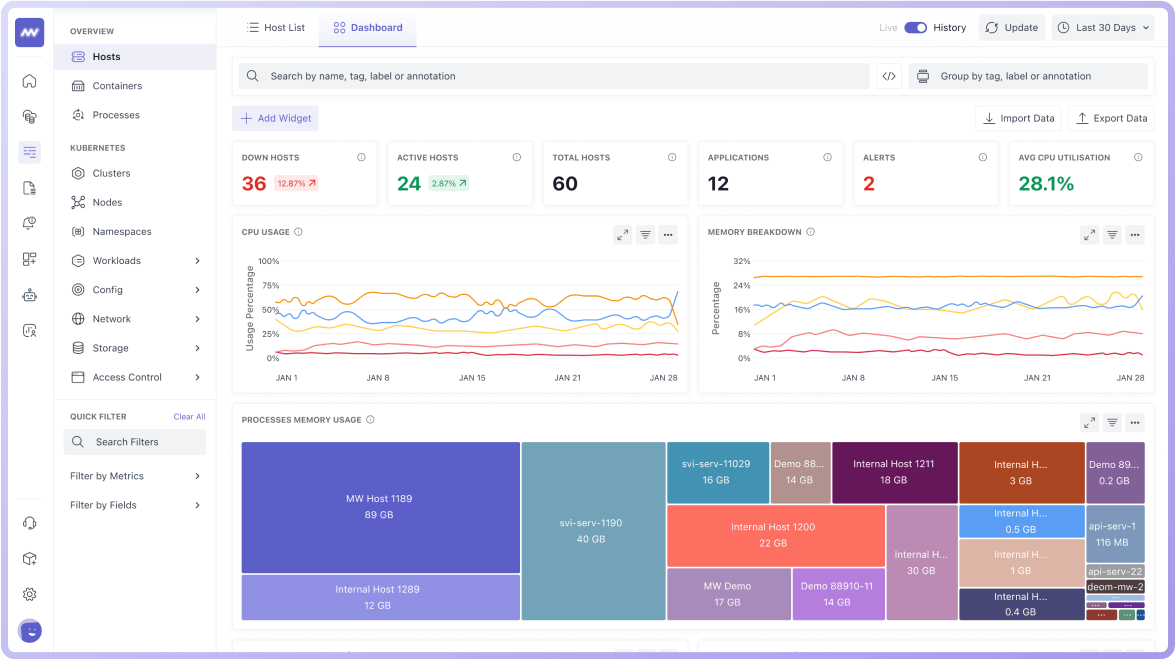
Middleware is a powerful alternative that solves the Datadog vs Dynatrace dilemma by combining the strengths of both platforms while addressing their limitations, giving you the best of both worlds.
Middleware offers a complete monitoring solution with the ability to track observability data and create meaningful visualizations. You get all your logs, traces, errors, etc, under a single dashboard, making it easier for your engineering teams to make sense of this data without getting overwhelmed by it.
Middleware provides the flexibility of Datadog and the automation capabilities of Dynatrace in a more accessible pricing model that organizations of all sizes can adapt to. You get powerful infrastructure monitoring and intuitive log management without the need for extensive configuration requirements.