After surging demand in recent years, Container monitoring has become an essential part of a cloud-native environment. In this practice, the system collects metrics and other data from microservices-based applications. These heavy require software that can monitor container health and resources so it can run seamlessly and improve application performance.
So, let’s understand more about container monitoring and its challenges and benefits.
What is container monitoring?
Container monitoring involves collecting and analyzing performance data from container-based applications to ensure their health and efficiency. Kubernetes provides built-in logging capabilities. These logs may include information such as the number of requests served by the API. In these instances, dependent services fail to connect to a particular container or logs of users attempting to access a service or application.
This proactive practice is essential for promptly identifying and resolving issues, enhancing application performance, system reliability, and ensuring a seamless user experience.
How does container monitoring work?
Container monitoring tracks and analyzes the performance of containerized applications, helping teams monitor CPU, memory, and network usage, detect issues, and resolve failures before they impact users.
Container monitoring tracks the performance and health of containerized applications. This includes:
- Resource Usage: Monitors CPU, memory, and network utilization.
- Logs & Metrics: Collects real-time logs and performance metrics.
- Health Checks: Detects failures and downtime.
- Security Monitoring: Identifies vulnerabilities and threats.
- Automation & Alerts: Sends notifications for anomalies.
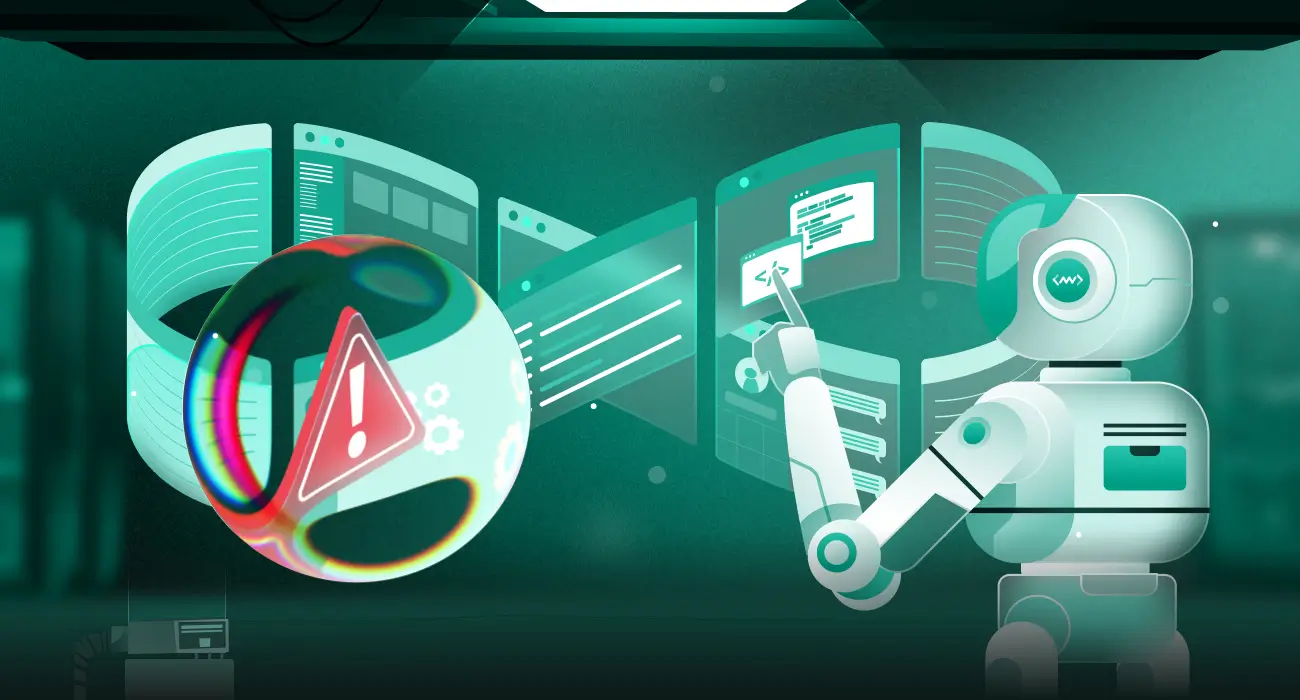
Challenges in observing and managing containers
Challenges in observing and managing containers are numerous. Containers start, stop, and move frequently, making tracking their performance and dependencies a complex task. Additionally, the ephemeral nature of containers, their distributed dependencies, and the scalability of large-scale systems all pose significant challenges to effective container monitoring.
Another example is that platform users experience performance issues with buffering, delays, and timeouts during peak usage times, as resource limitations and database surges affect the system.
Lack of system resource visibility makes it difficult for the team to analyze the root cause when addressing problems, as they depend on user-submitted reports.
So, let’s understand what more challenges are…
The ephemeral nature of containers
Containers are short-lived and frequently replaced during scaling, updates, or recovery. Without continuous monitoring, valuable performance data is lost when they shut down, making issue detection and diagnosis difficult.
Distributed dependencies
Microservices depend on interconnected containers, where delays or failures in one can disrupt others. Monitoring must reveal these dependencies to help teams quickly identify the root cause of performance issues, not just the symptoms, thereby keeping them informed and aware.
Scalability
Large-scale systems run hundreds or thousands of containers simultaneously, generating massive amounts of data. Application monitoring tools must efficiently collect and analyze this data without slowing down performance.
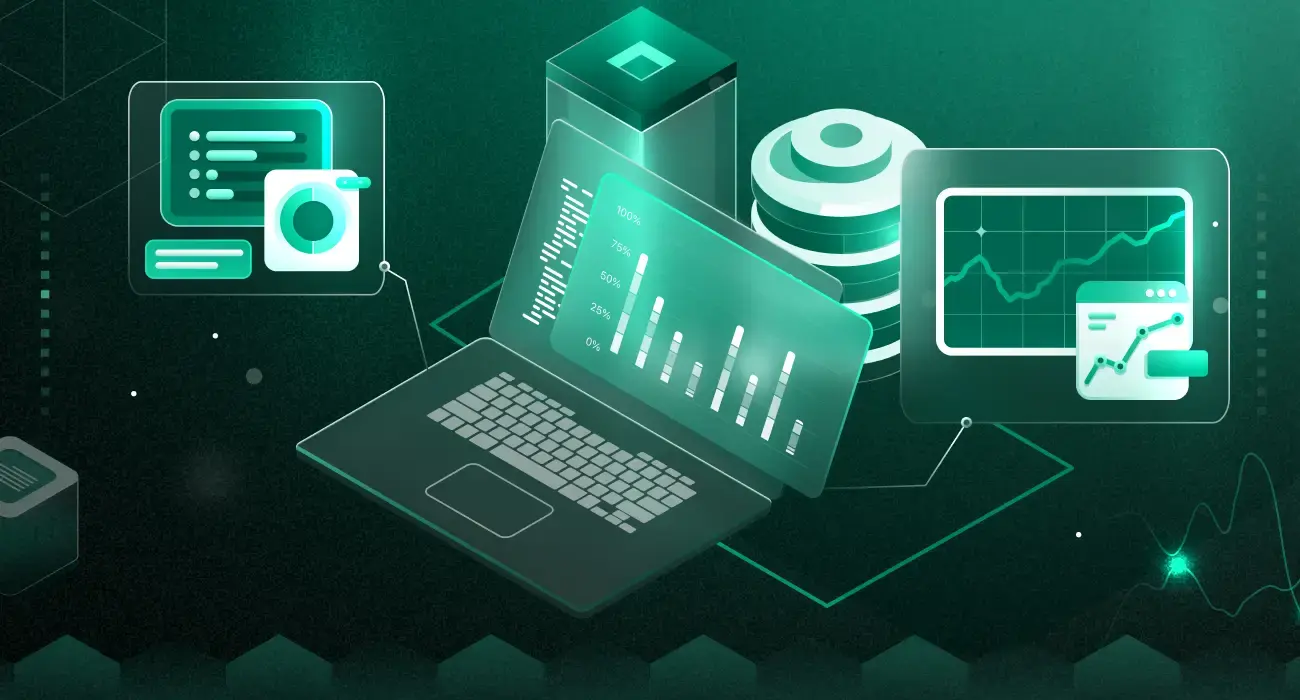
Advantages of implementing container monitoring
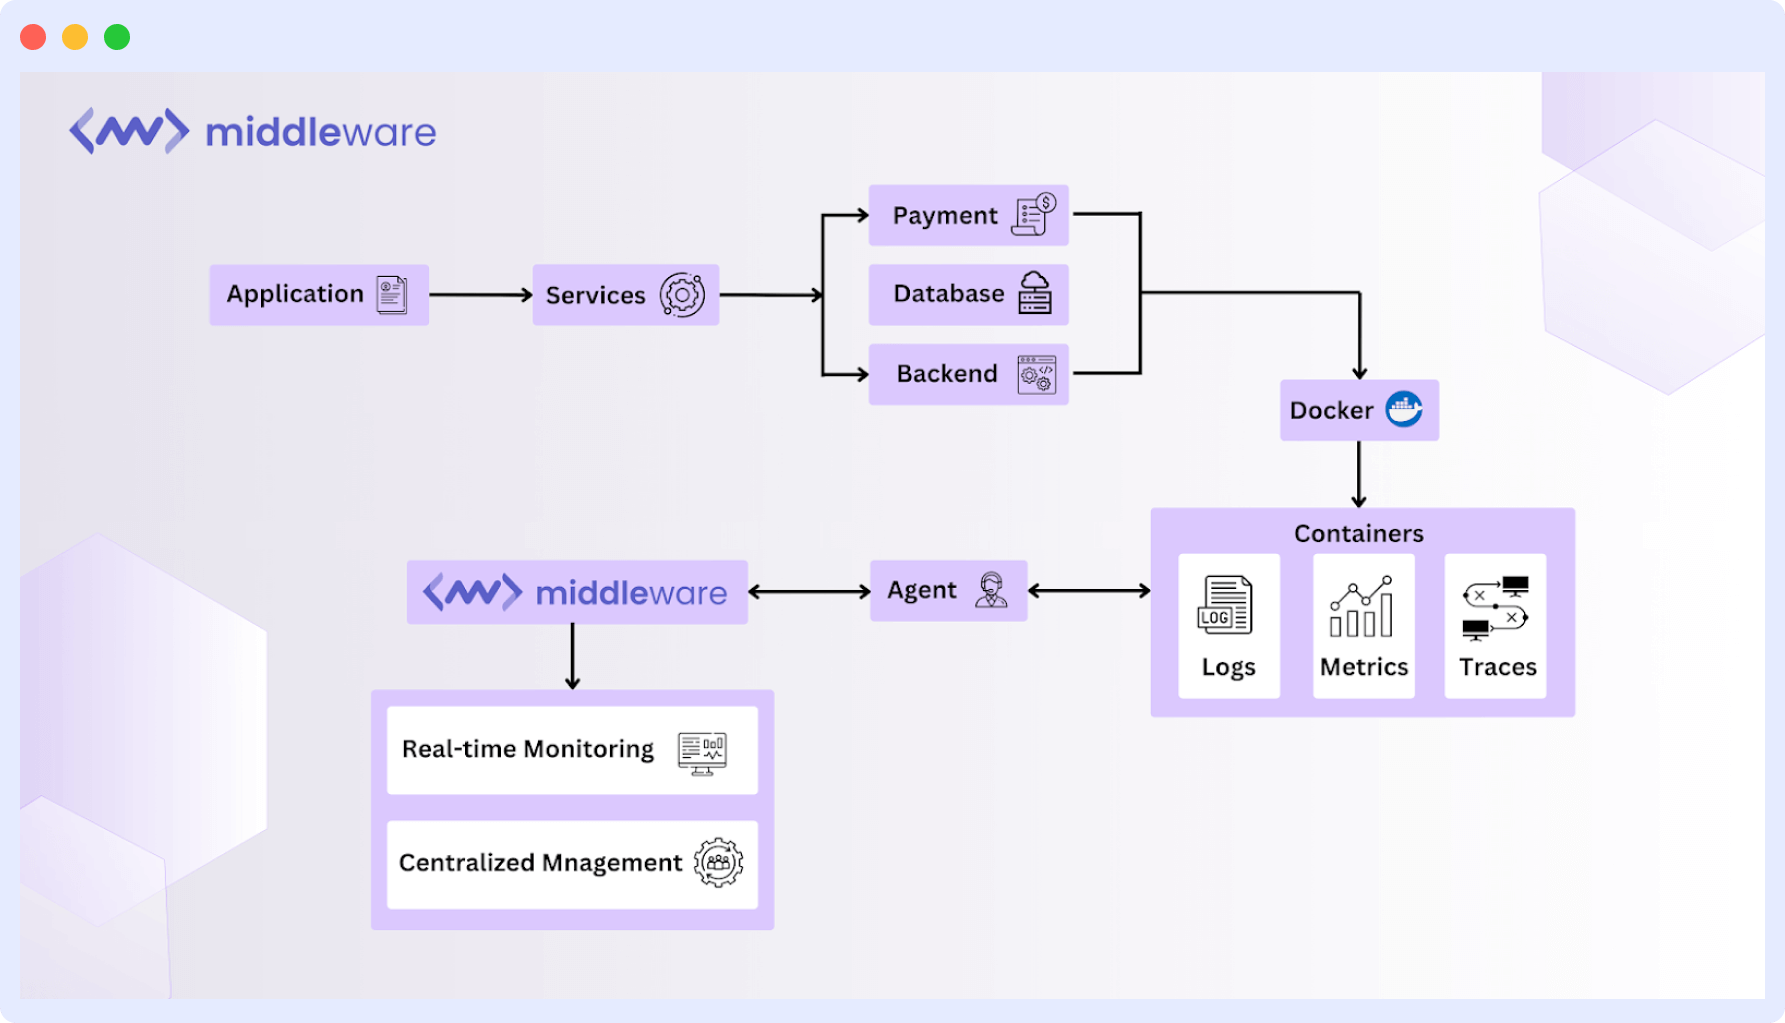
Container monitoring tools track application logs, metrics, and traces, collecting real-time data from containers and transferring it to a centralized dashboard. This improves visibility, speeds up issue resolution, and ensures system stability. It also addresses challenges like short-lived containers and complex microservices by providing unified insights and workload optimization.
Here are some of the benefits. Take a look.
Bridging gaps in native tools
Native tools like kubectl logs and docker stats track basic container activity but often lack real-time issue detection, detailed insights, and system-wide observability. Managing alerts across multiple services with tools like cAdvisor and Sysdig can be complex. Advanced monitoring solutions such as Middleware, Prometheus, and Datadog bridge these gaps with intuitive dashboards, instant alerts, and deep insights, enabling efficient container management and troubleshooting.
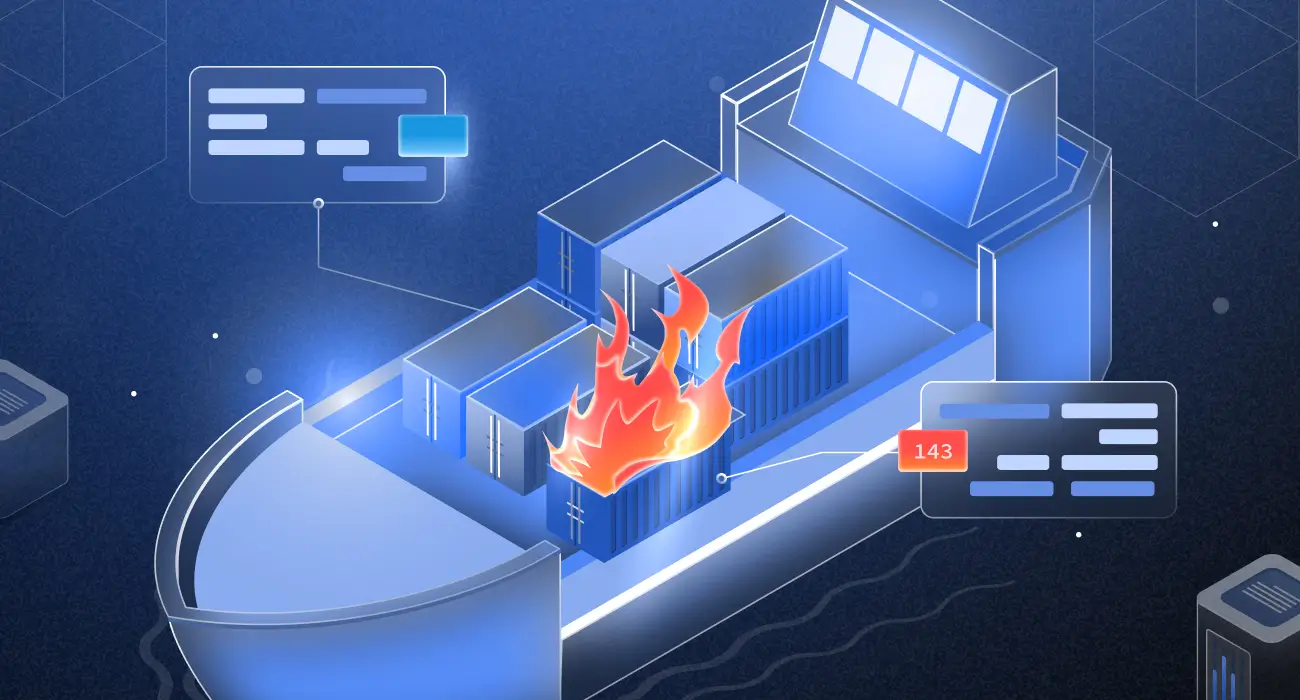
Avoiding performance issues with container monitoring
During a live lecture, the platform struggles with a traffic surge. The video encoding container exceeds resource limits, causing delays, while the overloaded database faces timeouts and failed queries, leading to login failures and disrupted interactions.
Without visibility into resources, the operations team reacts too late, leaving students frustrated, negative reviews piling up, and the platform’s credibility at risk. Container monitoring could have helped the education platform detect database crashes and video buffering issues early, reducing downtime and improving the user experience.
Managing containerized environments is complex, with hundreds of containers running & utilized across servers. Without monitoring, resource overuse in one container can cause dependent services to slow down or crash, as seen with the database failure that blocked student access.
Centralized dashboards
A containerized ecosystem spans traditional physical infrastructure, cloud-based platforms, and hybrid deployments. Initial monitoring combines CPU, memory, networking, and storage data from all platforms into one transparent display to identify difficulties more smoothly.
Real-time alerts
Organizations are unaware of operational problems until their end-users encounter difficulties due to inadequate monitoring systems. Therefore, it is fundamental to container supervision to set immediate warning systems that identify resource overload, system failures, and network slowness and alert teams quickly for preventative action.
Predictive analytics
The analysis of historical data by container monitoring solutions creates predictions about potential failures while avoiding basic reactive responses to problems. Carefully analyzing CPU memory and network trends enables teams to implement resource expansion and workload optimization measures before breakdowns occur.
Finding issues faster
Troubleshooting containerized systems is challenging with multiple running services. Container monitoring solutions simplify this by providing clear insights into resource usage, logs, and service interactions. For instance, during a live session, monitoring detects a CPU spike in video encoding containers, preventing delays and user frustration, unlike manual log checks that slow down issue resolution.
Preventing downtime
Container monitoring plays a crucial role in ensuring smooth application performance by detecting real-time resource issues, crashes, and network delays. It enables teams to resolve problems early and automates actions like scaling or restarting containers to maintain stability, thereby preventing potential downtime.
Finding and fixing the root cause
Container monitoring detects issues and provides logs, tracing, and insights for faster troubleshooting. For instance, in a fintech app, tracing tools identify a misconfiguration causing repeated database queries and high CPU usage. Engineers quickly fix it, restoring service without long delays. Continuous monitoring ensures smooth operations and an improved user experience.
How do you monitor containers in Kubernetes?
Kubernetes, a popular container orchestration platform, plays a crucial role in container monitoring. It offers built-in tools to track resource usage and application health. DevOps teams can use metrics servers, Prometheus, and Grafana to get real-time insights into cluster performance, identify bottlenecks, and optimize resources.
To get logs for a specific container using Kubernetes, you can use the following command: kubectl logs [pod_name]. This command will display the logs of the specified pod, providing valuable insights into the container’s activities and performance.
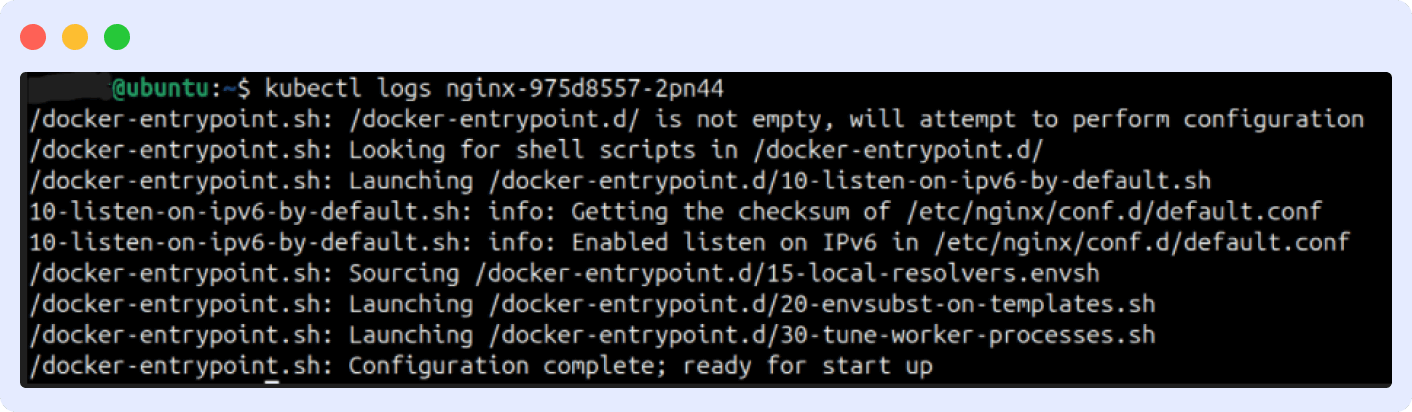
This shows the logs of a pod named nginx-975d8557-2pn44 using Kubernetes.
The regular start-stop-action of containers between servers requires monitoring to find performance bottlenecks and stabilize operations for continuous performance delivery.
The service or delays will occur when containers encounter resource constraints that affect CPU capacity, memory availability, or network bandwidth consumption.
The Kubernetes command kubectl get pods enables us to view all pods located in the default namespace to monitor their status.
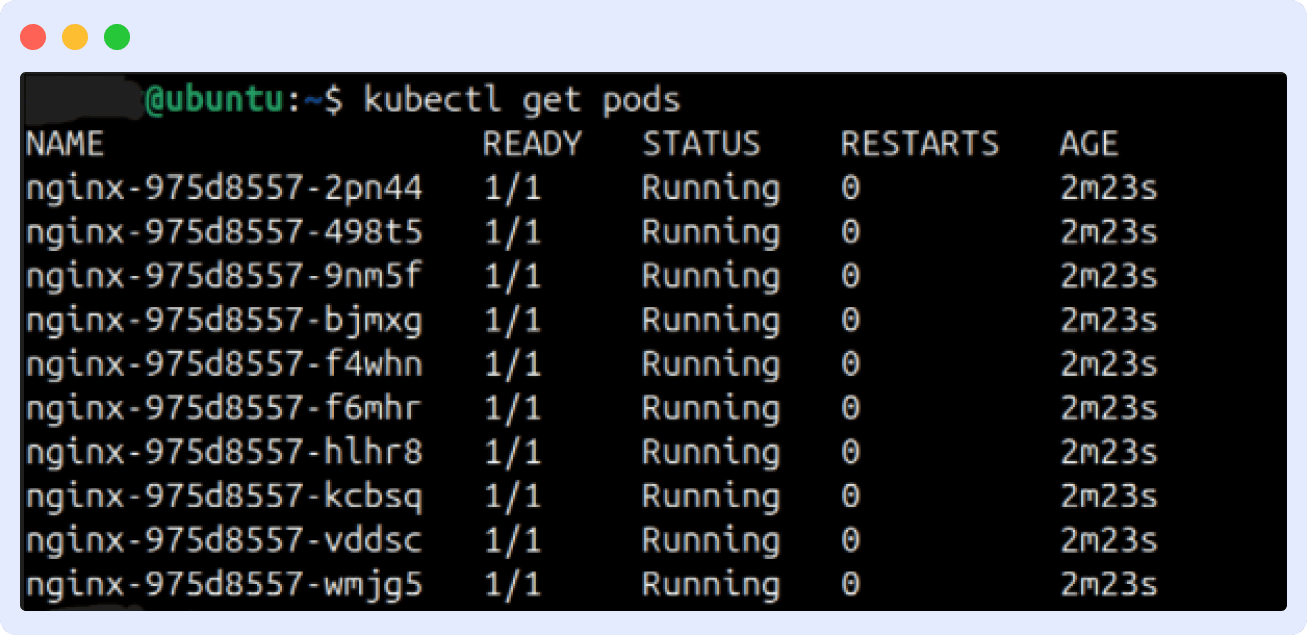
While kubectl commands offer basic container monitoring, their usefulness is limited due to the challenges of reading and interpreting unstructured logs.
Consider container monitoring tools
Monitoring containerized applications helps detect performance issues, resource limits, and failures before they cause downtime. Here are some standard tools:
Observability platforms for container monitoring: tools like Middleware, Sematext, Prometheus & Grafana, and Datadog provide container monitoring, logs, traces, and metrics in a unified dashboard.
Middleware supports OpenTelementry for logs, metrics, and tracing and offers real-time alerts and anomaly detection, while Prometheus & Grafana focuses on time-series data and visualization. Other tools support OpenTelemetry for distributed tracing with AI-driven insights.
How does Middleware monitor containers?
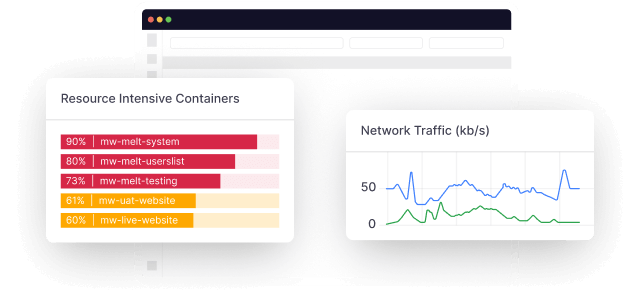
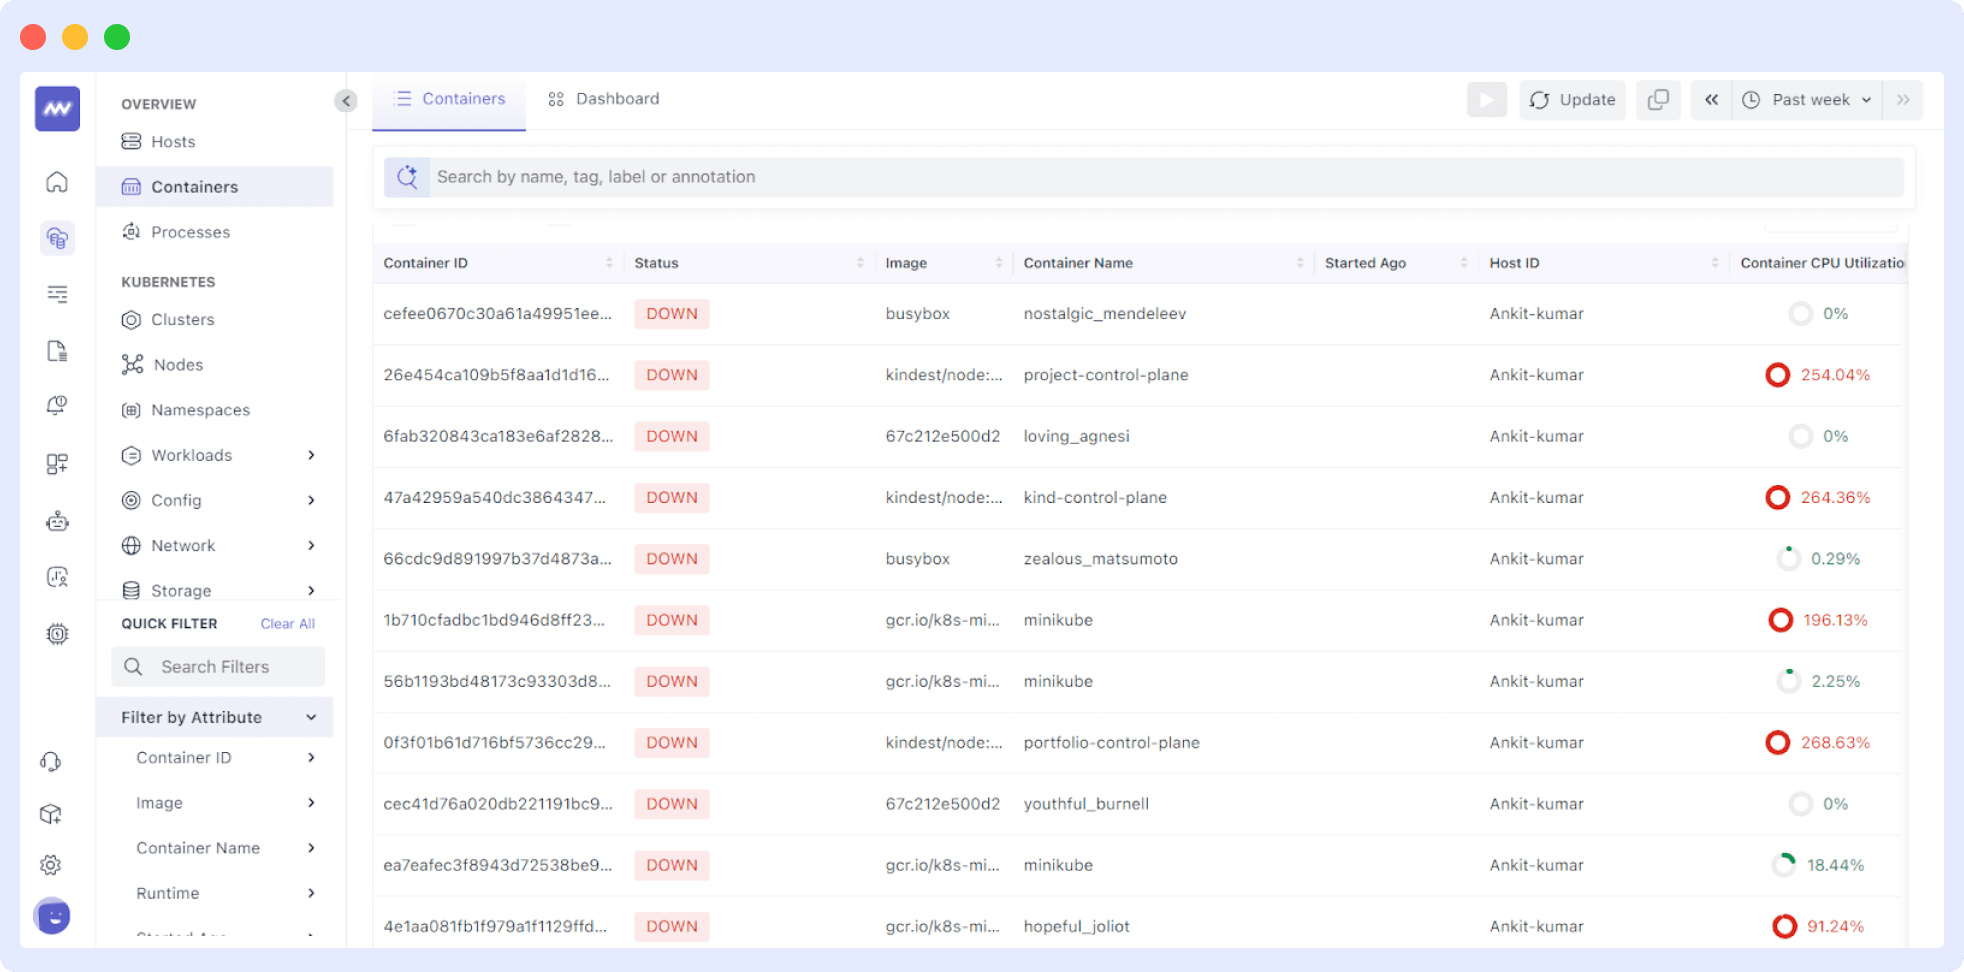
Middleware simplifies this process with a dedicated dashboard that provides complete container details, including images, names, IDs, and structured log reports. This enhances visibility, streamlines monitoring tasks, and makes issue resolution more efficient.
The dashboard of container monitoring solutions shows a structured log, simplifying monitoring tasks and enhancing their effectiveness. Middleware takes this a step further by offering a clear, detailed view of container performance, making issue detection and resolution faster and more efficient.
Setting up container monitoring
Real-time tracking of performance is essential for containers because it helps prevent application failures while deploying applications becomes simpler. The monitoring agent gathers system data, logs, and metrics to provide significant visibility into container workload activities.
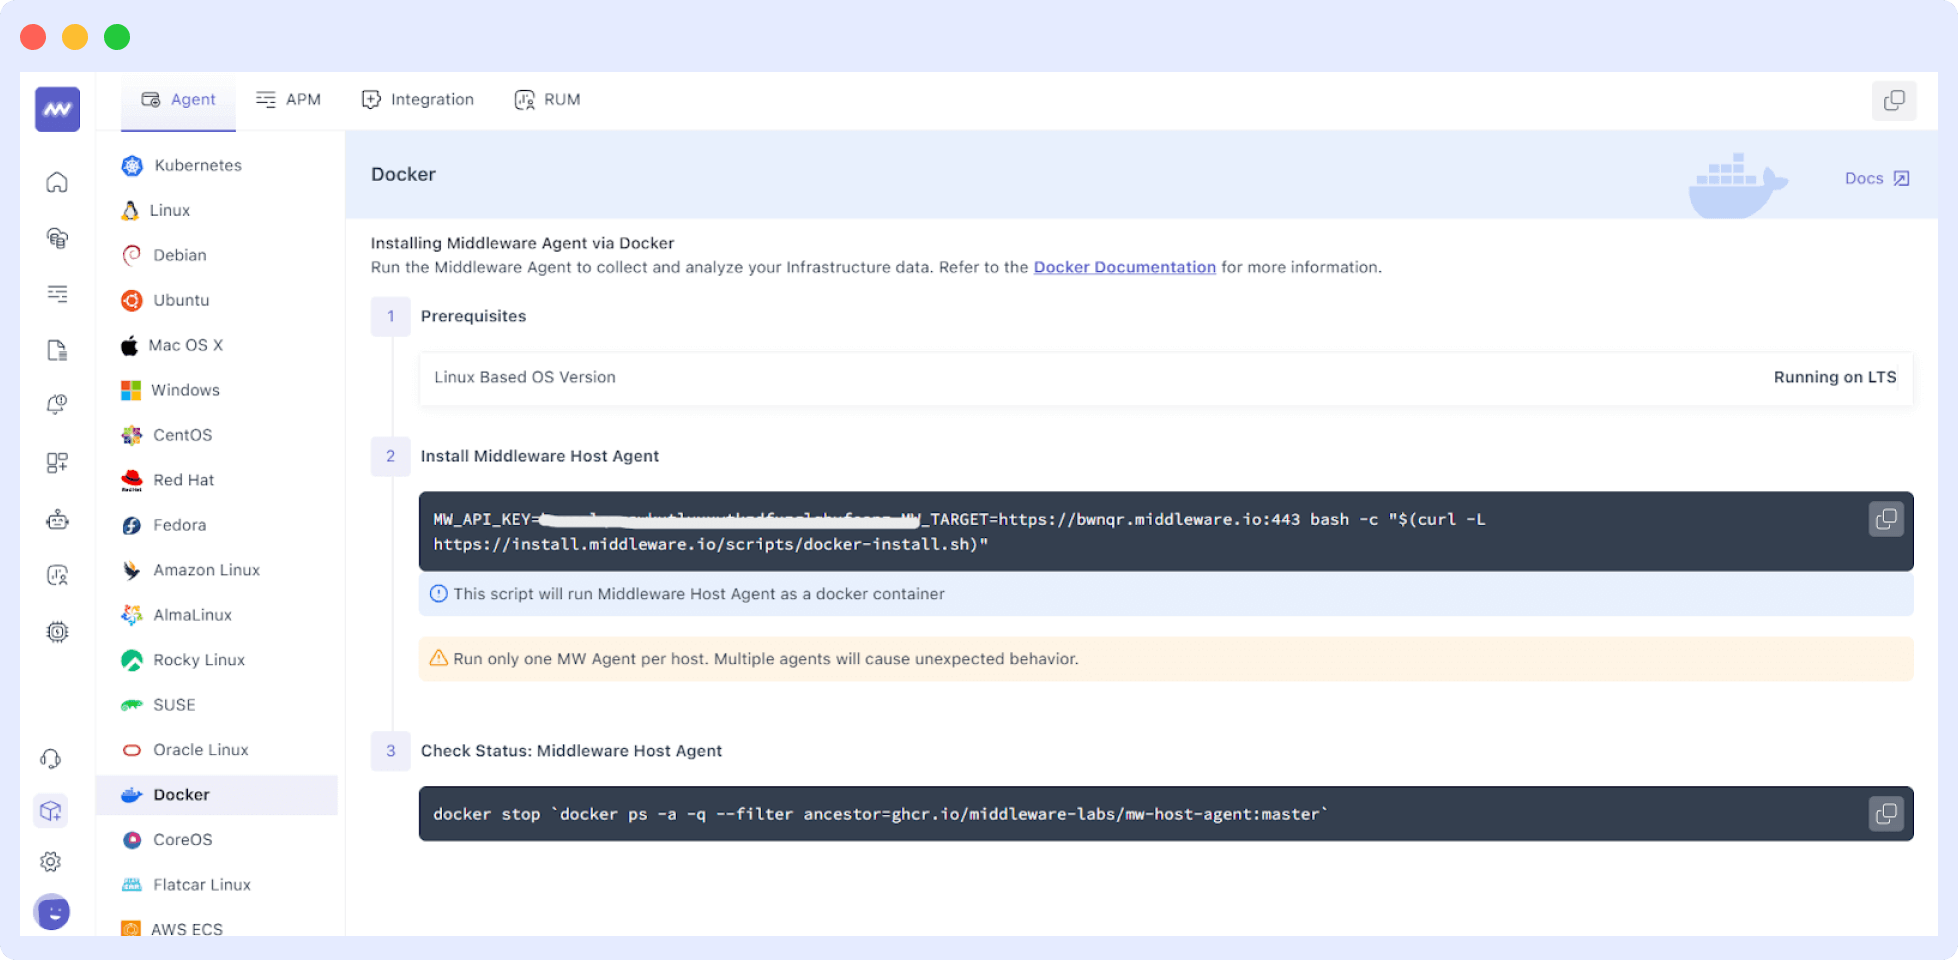
The setup of monitoring tools consists of basic commands that lead to implementation success. Using these tools, teams can solve performance problems early through real-time CPU tracking, memory usage, and infrastructure monitoring and logging abilities.
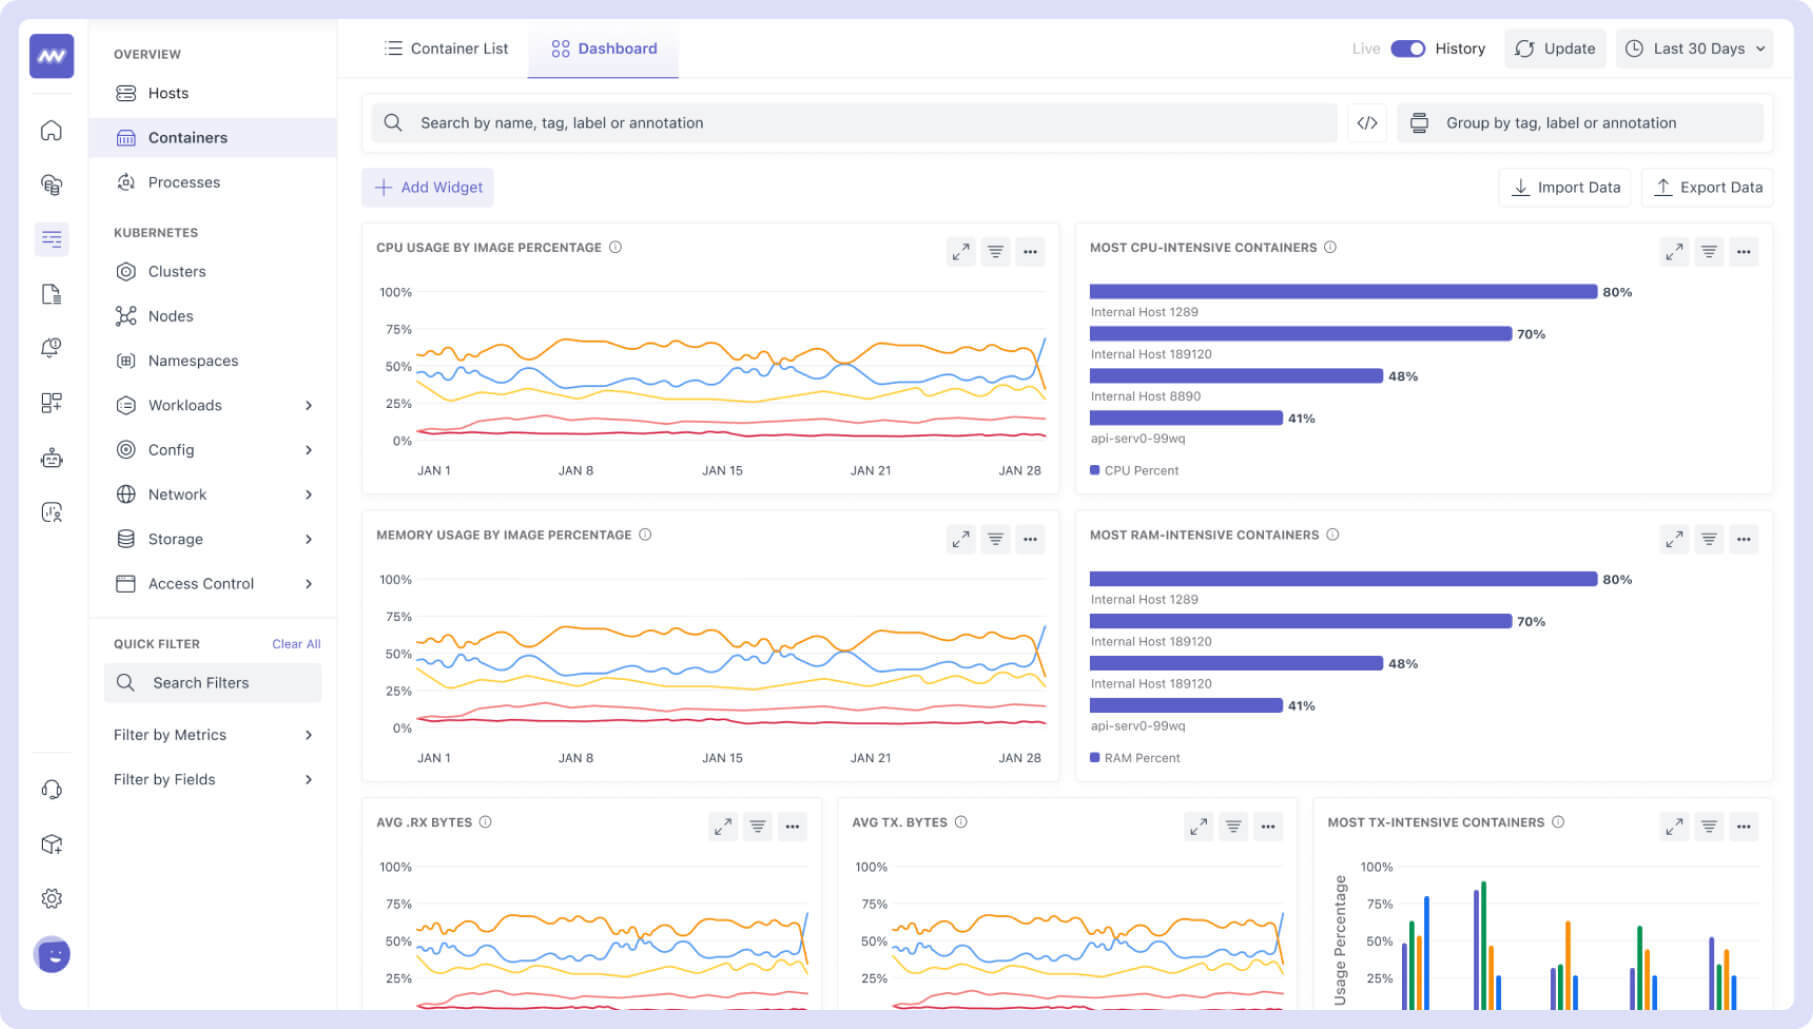
Collected data is displayed in customizable dashboards, making it easier to analyze trends, optimize workloads, and troubleshoot issues before they impact applications.
How Middleware prevented a major failure
During high traffic, Middleware detected a misconfigured environment variable, causing high CPU usage in a database container. The issue was fixed and the container was redeployed before downtime occurred, maintaining performance without user impact. The problem could have led to service disruptions, frustrated customers, and revenue loss without monitoring. Real-time monitoring ensures smooth operations under heavy traffic.
A customer from Generation Esports highlighted the difference Middleware made:
“With Datadog, it often took too long to receive alerts, which meant we were reacting to problems rather than preventing them. Middleware allowed us to get ahead of issues.”
Aaron Hawkey, Co-Founder & CTO, Generation Esports
This case study shows how Middleware helps teams detect, prevent, and resolve problems faster, ensuring application stability when it matters most.
Conclusion
This article highlights the importance of container monitoring to avoid failures and slow performance. Without it, issues may go unnoticed until downtime occurs. Monitoring tracks container health, sends alerts, and provides real-time data in one place. It helps teams quickly detect and resolve problems, manage resources efficiently, and maintain stability during high traffic. Start improving your container monitoring today.
FAQ
What is container monitoring?
Container monitoring tracks the performance and resource usage of containerized applications, collecting CPU, memory, network, and storage data. It helps detect issues such as resource shortages, crashes, and slow responses, ensuring efficient and reliable operations.
How does container monitoring work?
Container Monitoring collects metrics, logs, and events using agents or built-in tools, processes the data, and provides alerts and dashboards for analysis.
What are common container monitoring tools?
Prometheus, Grafana, ELK Stack, Middleware, Datadog, New Relic, Kubernetes Dashboard, and OpenTelemetry.
What metrics should be monitored in containers?
CPU, memory, disk usage, network traffic, container uptime, request latency, and error rates.
What are the characteristics of container monitoring?
Container monitoring involves real-time data collection, resource tracking, log analysis, and distributed tracing. It handles container dynamics, tracks microservice dependencies, and provides performance insights. Automation features like alerts and corrective actions improve efficiency.
How are container-based applications monitored?
Container monitoring tools integrate with platforms like Kubernetes and Docker Swarm to track CPU, memory, and network usage, analyze logs, and trace service requests. Dashboards and alerts help detect and resolve issues before they affect users.
What are the benefits of container monitoring?
- Enables tracking of resource utilization (CPU, memory, disk, and network) that helps optimize container operations.
- Allows detecting bottlenecks, failures, or anomalous conditions before users are affected.
- Monitors unauthorized access, vulnerabilities, and potential actions in real time.
- Provides granular logs and metrics that help diagnose and resolve issues quickly.
- Ensures efficient use of resources, reducing waste and improving cost-effectiveness.
- Helps to meet the required guidelines by taking the logs and tracking user activities.
- Monitoring the interaction of services and containers identifies failures in a microservices architecture.
How container monitoring helps identify and fix performance issues
Container monitoring tracks real-time metrics like CPU, memory, and network usage, assisting teams to detect and address problems early. Alerts for high resource use enable timely actions, such as adjusting resources for video encoding or scaling database capacity to prevent crashes.
By maintaining container health, monitoring minimizes downtime, ensures stability, and supports smooth performance, even during peak traffic.