



Observability migrations rarely fail because the new platform is worse. They fail in the gap between the pitch deck and week three, when a missing label breaks a 2 AM alert and nobody can say whether it’s the platform or the data. This guide breaks down the five patterns that quietly sink migrations, and what a phased, OpenTelemetry-native switch looks like when it actually holds up in production.
An observability migration is the process of moving your metrics, logs, traces, and alerting from one monitoring platform to another, ideally without losing detection speed or accumulating duplicate cost along the way.
TL;DR
- Most observability migrations do not fail because the new platform is bad. They fail because teams treat the switch as a tool swap instead of a chance to clean house.
- The five patterns that break migrations: instrumentation locked to a vendor agent, no clue which data is actually queried, dashboards and alerts ported one-for-one, parity checks that skip the on-call experience, and going live before value shows up.
- An OpenTelemetry-native setup with a working observability pipeline and an AI SRE agent keeps the migration healthy and workable.
Why do observability migrations fail? The critical part nobody warns you about
Every observability migration pitch looks the same on paper.
- Export the dashboards.
- Move the alerts.
- Point the agents at a new endpoint.
- Ship.
Then week three happens.
An alert fires at 2 AM. The trace is there, but a label is missing. The old dashboard showed p99 at 180ms. The new one shows 140ms for the same service. Somebody asks in Slack, “Is that the platform or is that us?” No one has a clean answer. The migration lead is on vacation. The bill from the old vendor is still running because half the services never got cut over.
This is the shape of a failed migration. Not a dramatic outage. A slow bleed of trust, until the team quietly starts logging into the old platform again “just to double check.”
The good news: the failure patterns are boring and predictable. If you know how they are going in, you can dodge them.
What actually breaks during a migration
Here are the five patterns that show up in almost every failed observability migration. None of them is about the target platform. All of them are about what the team decided, or didn’t decide, before touching anything.
1. Your instrumentation is glued to a vendor agent
The first question to ask before any migration is simple: who owns the shape of your telemetry?
If the answer is “the vendor’s agent decides,” you are already stuck.
Proprietary agents rename metrics, drop attributes, and lock you into a schema you did not choose. When you try to move, the old dashboards and alerts do not translate cleanly because the metric names, tags, and aggregation windows live in the vendor’s world, not yours.
OpenTelemetry fixes this by moving instrumentation into your code and your config, not the vendor’s binary. OpenTelemetry standard is not going anywhere and every serious backend has to speak it.
If your services already emit OTLP, migrating is mostly a matter of pointing the exporter at a new endpoint. If they do not, the migration is really two projects stapled together: instrument once for OTel, then switch backends. Do not confuse the two.
For a walkthrough of what OTel actually covers and why it matters, see Middleware’s guide to OpenTelemetry tools.
2. Nobody knows which data is actually being queried
This is the single biggest source of observability migration cost surprises.
Most observability environments have three to five years of accumulated telemetry that nobody looks at. Dashboards from a service that got deprecated. Metrics from a test tag that never got removed. Duplicate traces from two agents running in the same pod. All of it costs money to store, index, and query.
If you migrate all of it, you carry that waste into the new platform on day one. The bill spikes, someone panics, and the migration gets blamed for a cost problem that predates it.
The audit is not complicated. Before you cut over, pull three lists:
- Every alert rule, its threshold, and the last time it fired
- Every dashboard, its last accessed date, and the team that owns it
- Every metric, log stream, and trace source, along with how many queries hit it in the last 90 days
Anything that has not been touched in 90 days is a candidate to drop, not migrate. This is also worth doing on a rolling basis, not just at migration time.
Cardinality, the count of unique time series your metrics generate, is 50 to 70 percent of the bill at most vendors in 2026, while data volume is only 5 to 10 percent, so optimizing for ingest rate cuts 5 percent when 60 percent is available. If you are only looking at gigabytes ingested, you are looking at the wrong number.
Middleware’s observability pipeline exists exactly for this reason. It sits between your services and the backend, lets you filter and enrich telemetry inside your own cluster, and gives you a toggle to kill traces from a specific service without touching a line of code.
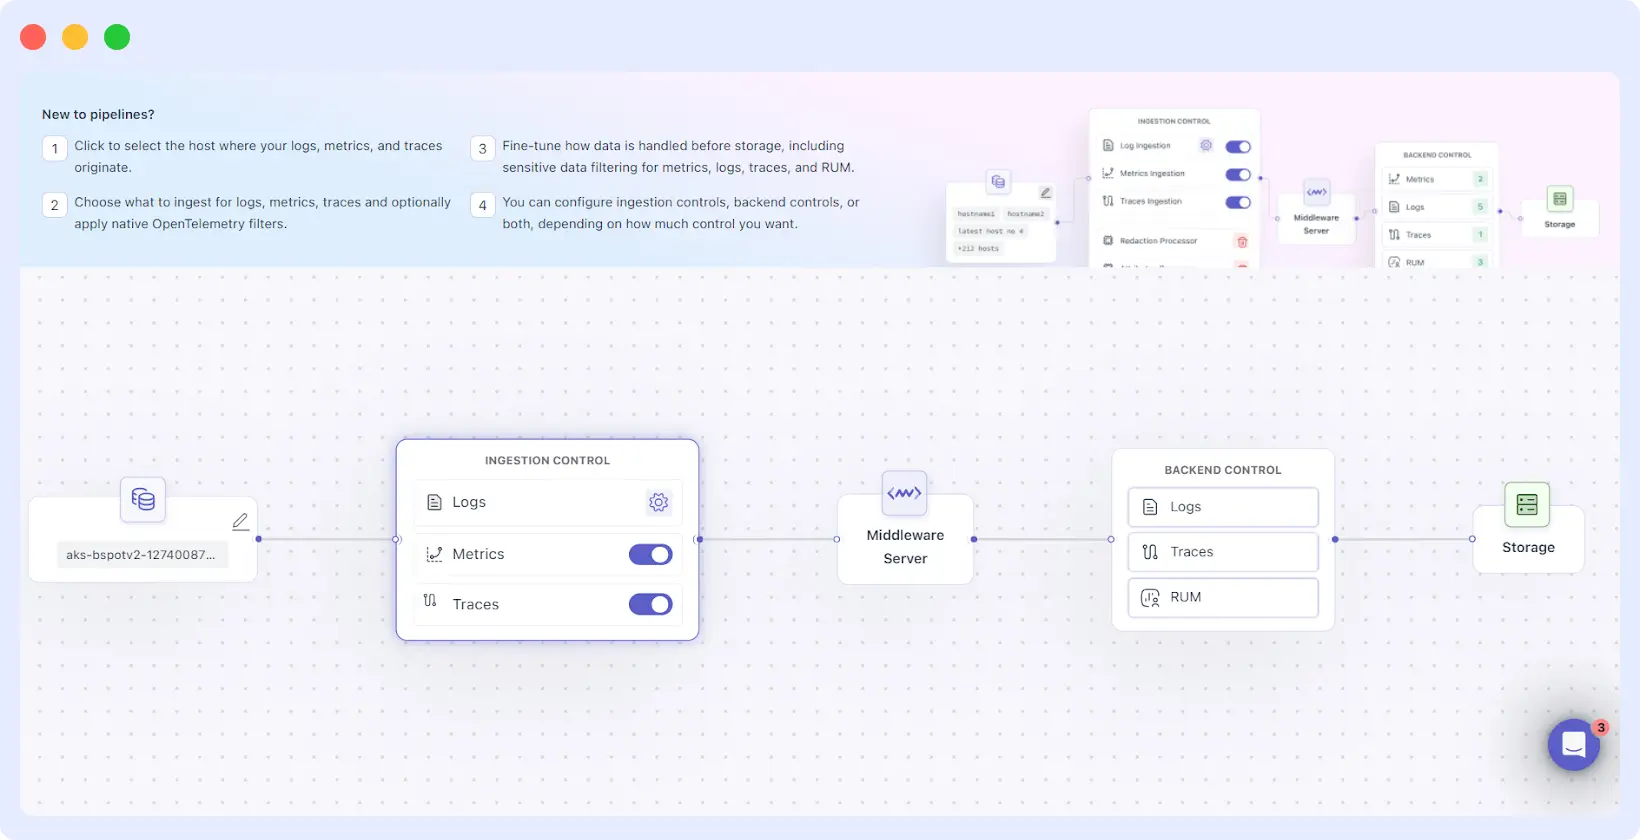
That is the kind of ingestion control that keeps waste out of the new platform instead of importing it.
3. Dashboards and alerts get ported one for one
The lazy observability migration is a copy-paste job. Every dashboard becomes a new dashboard. Every alert becomes a new alert. The new platform ends up as a clone of the old one, minus the muscle memory the team spent years building.
This does two bad things. First, it hides the fact that half of those dashboards were never useful. Second, it stops the team from using features the new platform actually has. If you moved to a platform with better trace based alerting or ranked root cause suggestions, and you kept the same threshold based alerts you had before, you paid for capability you are not using.
A better rule: for every dashboard and alert you plan to migrate, someone on the owning team has to answer, in one sentence, what decision it drives. If they cannot, it does not move. If they can, rewrite it to take advantage of what the new observability platform does well.
4. Parity checks miss the on-call experience
Most migrations define parity as “the same numbers show up on the same graphs.” That is a necessary check, not a sufficient one.
Real parity is whether the on-call engineer at 3 AM can resolve an incident on the new platform as fast as they could on the old one.
That means:
- The alert fires within the same detection window
- The alert payload has enough context to skip a login
- The trace linked from the alert loads without extra clicks
- The dashboard next to the trace shows the right resource
- A junior engineer can follow the trail without paging a senior
If any of those steps got worse, parity is not there yet, even if the p99 numbers match. This is the piece that developer resistance almost always turns out to be about.
Engineers do not push back on new platforms because they hate change. They push back because the new platform slowed their debugging loop, and nobody has explained why.
The fix is unglamorous: ingest prod data and run a real incident drill on the new platform before you cut over. Ideally, two or three. Not a synthetic test, but an actual “recreate last month’s Sev 2 and see if we would have caught it faster or slower” exercise.
This is also where an AI SRE agent earns its position. Middleware’s OpsAI reads alerts, pulls the relevant traces, logs, and metrics, and returns a ranked root cause with the evidence attached. The reason that matters during migration is that it flattens the learning curve. A junior engineer on a new platform with an AI agent in the loop can resolve incidents at senior speed, which shrinks the “the old tool was faster” complaint window from months to weeks.
5. Go live happens before value shows up
The last pattern is the most human. Somebody sets a cutover date, the date arrives, the switch flips, and the value proposition, whether that was lower cost, faster MTTR, or unified data, gets measured a quarter later. In the gap, the team is running two platforms, paying for both, and getting the benefit of neither.
The way out is to phase the rollout by service criticality rather than by team. Start with a few internal services that nobody is on call for. Prove parity there. Move customer facing services with low traffic next. Only touch business critical services once the process is boring.
Middleware’s Day 0 to Week 4 guide walks through what a phased rollout actually looks like, week by week, if you want a concrete template.
What makes observability migrations different from other tech migrations
Database migrations have staging environments. Cloud migrations have replay traffic. Observability migrations have neither, because the platform’s whole job is to see production.
Two things make this harder to get right:
The evidence of failure is missing evidence. A gap in tracing does not throw an error. It just means the on-call engineer cannot find the failing service. You only notice the gap during an incident, which is exactly when you cannot afford to.
Vendor pricing has already shaped your telemetry. If you have been on a platform that bills per host or per active time series, your team has been quietly stripping tags and sampling for years to keep the bill down. Those choices live in agent configs and Helm charts, not in the migration plan. They will follow you into the new platform if nobody digs them up.
A single application that was one VM in 2018 might be 50 pods in 2026, producing 50x the telemetry volume on an equivalent business workload. That growth is not going to slow down. Every migration is also a chance to pick a pricing model that does not punish you for that growth.
What a healthier or successful migration looks like
If you strip out the vendor pitch and the 4 to 6 months project plan, a working migration comes down to five moves:
- Instrument in OpenTelemetry or an OpenTelemetry-based vendor agent, not in a vendor-proprietary agent. Own the schema. Own the exporter. The backend becomes a choice, not a lock-in.
- Audit before you move. Drop anything that has not been queried in 90 days. Consolidate duplicate agents. Move the value, leave the waste.
- Define parity in terms of the on-call experience. Numbers matching is table stakes. Debugging speed is the real test.
- Phase by risk, not by team. Start where a missed alert costs nothing. Prove the process. Then move the money makers.
- Pick pricing that fits how your telemetry actually grows. Per host billing punishes Kubernetes. Per active series billing punishes high cardinality. Usage based billing on ingested volume, with a pipeline that lets you drop noise before it becomes cost, is the model that survives scale.
A recent report, The Landscape of Observability in 2026: Balancing Cost and Innovation, conducted by Dimensional Research and sponsored by Elastic, surveyed over 500 IT decision makers, and the pattern is consistent: teams that treat observability as a strategic function, not a line item, are the ones that get through migrations without regretting them.
Lazy migration vs phased migration
| Factor | Lazy migration (copy-paste cutover) | Phased migration (by risk tier) |
|---|---|---|
| Cost during transition | Paying for both platforms indefinitely, no firm cutover date | Runs both briefly per tier, with a set date to drop the old one |
| MTTR risk | Unknown until an incident exposes the gap | Tested against real incident drills before go-live |
| Rollback risk | High: entire estate moves at once | Low: only the current tier is exposed if something breaks |
How Middleware fits into this
Middleware is built around the assumption that most of the pain above is avoidable if the platform speaks open standards and gives you real control over what gets stored. If you are still weighing platforms broadly, this roundup of the best observability tools in 2026 is a useful starting point before you narrow the list.
A few specifics that map directly to the failure modes above:
- OpenTelemetry native ingestion. OTLP, Prometheus remote write, and native OTel Collector support mean you migrate by changing an exporter endpoint, not by rewriting instrumentation. See what to expect when switching to Middleware for the actual steps.
- A working observability pipeline. Filter, enrich, and route telemetry inside your own cluster before it ever hits the backend. Kill traces from a service for 24 hours during a migration without touching a deploy.
- OpsAI, the AI SRE agent, that also ingests alerts from Datadog and Grafana. You do not have to migrate everything at once to get value from agentic root cause analysis. Point OpsAI at your existing platform, let it investigate, then move services over as you build trust.
- Usage based pricing. No per host fee, no per user fee. Predictable as your service count grows.
If you are on Datadog and thinking about a move, Middleware has a full breakdown of why teams are migrating from Datadog and a Datadog alternatives comparison. If you are on ServiceNow Cloud Observability (formerly Lightstep) and racing the March 2026 end of life, the ServiceNow migration guide is the right starting point.
The takeaway
Observability migrations do not fail because the tools are bad. They fail because teams treat them as tool swaps and skip the harder question underneath: what do we actually need to see, who owns it, and what should it cost. A migration is the rare moment when you have permission to redesign that answer. Use it.
FAQs
How long does an observability migration take?
For a small environment with fewer than 50 services, a few weeks is realistic. For a Kubernetes estate with hundreds of services, plan for three to nine months, with most of that time going to inventory, parity validation, and phased rollout rather than the actual data cutover. The predictor of timeline is not the size of the platform, it is how complete your pre migration audit is.
Do we have to run both platforms in parallel?
Yes, for a while. Running side by side is how you validate parity without risk. The trap is running both indefinitely because nobody sets a firm cutover date. Pick a date per service tier and stick to it.
Which telemetry should not migrate?
Anything not queried in 90 days. Metrics tied to services that no longer exist. Duplicate signals from overlapping agents. Debug tags that were added for one incident and never removed. Migration is the cleanest audit window you will get for years.
How do we prevent developer pushback?
Explain the differences before the switch, not after the first complaint. Pick the three to five things engineers will notice, a query language change, a different default aggregation, a new alert payload format, and document them with side by side examples. Most resistance is about surprise, not the tool.
How does OpenTelemetry reduce migration risk?
If your services already emit OTLP, migrating backends is a config change, not a re instrumentation project. That single fact removes the largest chunk of scope from any migration. For a deeper walkthrough, see Middleware’s guide to observability.
What does success actually look like?
MTTR equal to or better than the old platform. On call engineers resolving incidents without escalation at the same rate as before. Cost per service equal to or lower than the old platform. Not “we finished the migration,” but “we cannot tell we switched, except that the bill is smaller.”

